This weekend’s commentary starts a medium-term weather update from Brian Lovern at Bespoke Weather. Please contact Brian at brian@bespokeweather.com for any related questions.
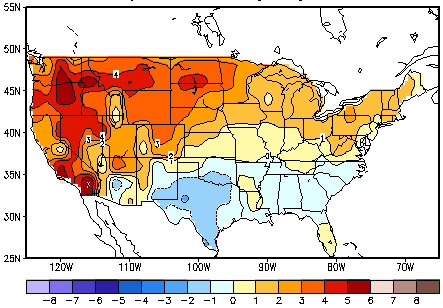
Summer (June to August) is in the books, and it wound up another hotter-than-normal one for the nation as a whole, totaling 970 GWDDs, though not as hot as last year, and not hot, relative to normal, in the South. The West was the hottest region, rather easily. In terms of the monthly breakdown, we had a hot June and August surrounding a cooler July.
Summer (June to August) Temperature Anomalies
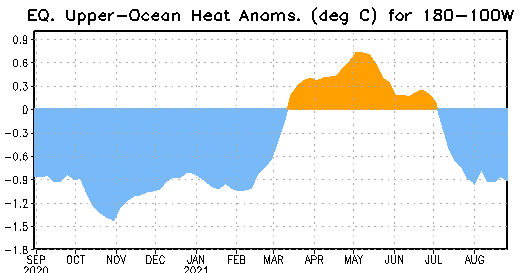
Attention now turns to the upcoming Fall (September to November) season. Over the last several weeks, we have seen the return of the La Niña base state, which is a large part of why August turned back hotter in the wake of the cooler July. Upper oceanic heat content anomalies across the tropical Pacific are strongly negative (cool-sided), telling us that the La Niña state likely remains intact this Fall.
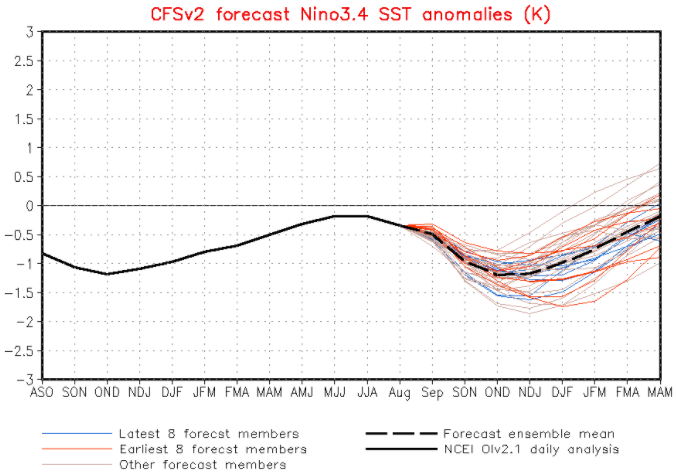
Climate models support this idea as well, showing negative anomalies across ENSO region 3.4 over the next several months, all the way through the winter season.
Latest CFS ENSO Projection
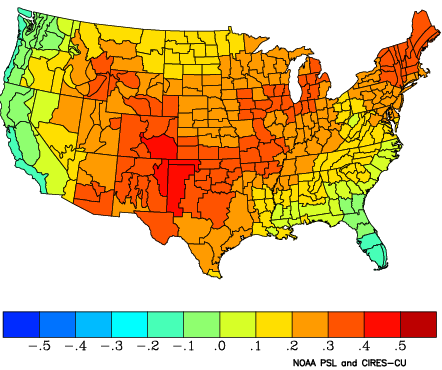
What does this mean in terms of temperatures across the U.S, and therefore, natural gas demand? Typically, a La Niña state increases warmer risks across much of the nation in the Fall season. This has been especially true over the last 30 years.
La Niña Correlation With Fall Temperature Anomalies (1991-2020)
This implies that the current cooler pattern we are seeing here for the first part of September will not stick around. That can still be mildly bullish (speaking strictly from the weather perspective) into the back half of September, pushing CDDs back above normal, though warmth sticking around into October and November would quickly turn the demand picture bearish. Given the current state of the natural gas market, weather will carry even more importance over the next few months, so we will be watching the trends very closely. We stray away from looking too much at the upcoming winter at this early stage, preferring to take one step at a time. We will offer a mention that La Niña winters typically favor a colder north / warmer south regime, but, for now, will leave it at that. The October-November pattern will have a large impact on price action, regardless of what ultimately happens as we move into the winter months.
Fundamentals for the week ending Sept 3: This past week the EIA reported a +20 Bcf storage injection for week ending Aug 27. The report was bullish by 3-4 Bcf and continues to show the market being tight versus the last few years. This bullish report added fuel to an already charged-up market post Hurricane Ida. We estimate that this report was 3.2 Bcf/d tighter (wx adjusted) than the 3-year average injection. Interestingly, this report covered a strong wind (average wind output of 41.8 GWh) and typically we see loose balance conditions during such weeks.
For the week ending Sept 3rd, our early view is +44 Bcf. The 5Yr average is also a +65 Bcf injection. Our projected injection would take the L48 storage level to 2915 Bcf (-600 vs LY, -243 vs. 5Yr). This past week was a messy one with Hurricane Ida disturbing both the supply and demand. We were told this was going to be an active hurricane season, and we are still leading up to the peak. We expect the range of estimates to be quite wide this week.
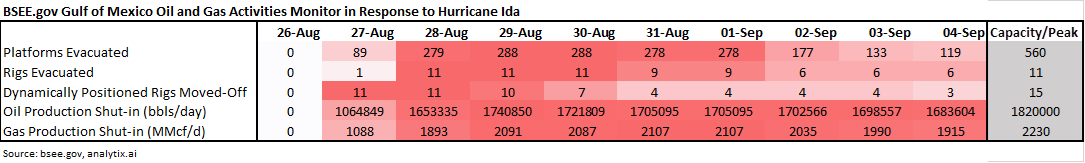
Domestic production was hit hard last week with Hurricane Ida ripping through the Gulf of Mexico and slamming into the Louisiana coast. Starting Aug 27th, production was lost from offshore (and some onshore locations) as a result of platform evacuations and damage/flood/power outage to pipeline/processing infrastructure. Here is some data from the Bureau of Safety and Environmental Enforcement that we have been tracking that shows nearly 100% of offshore gas production lost – and still no sign of coming back.
The impact of the Hurricane is still being assessed and power is still being returned to the Entergy system on the Louisiana coast. This was a note from Entergy on Friday:
“Distribution system damage in Louisiana and Mississippi at 1 p.m. Sept. 4 included 24,471 poles, 29,836 spans of wire and 5,787 transformers damaged or destroyed. The number of poles damaged or destroyed is already more than Katrina, Zeta and Delta combined. As restoration continues, these numbers could continue to rise.
Of the 225 affected transmission substations, 171 have returned to service as of 8 a.m., Sept. 4 as well as 130 of 211 affected transmission lines. More than 1,000 miles of transmission lines remain out of service.”
See this link for the last news from Entergy: https://www.entergynewsroom.com/storm-center/
Entergy also posts an outage map:
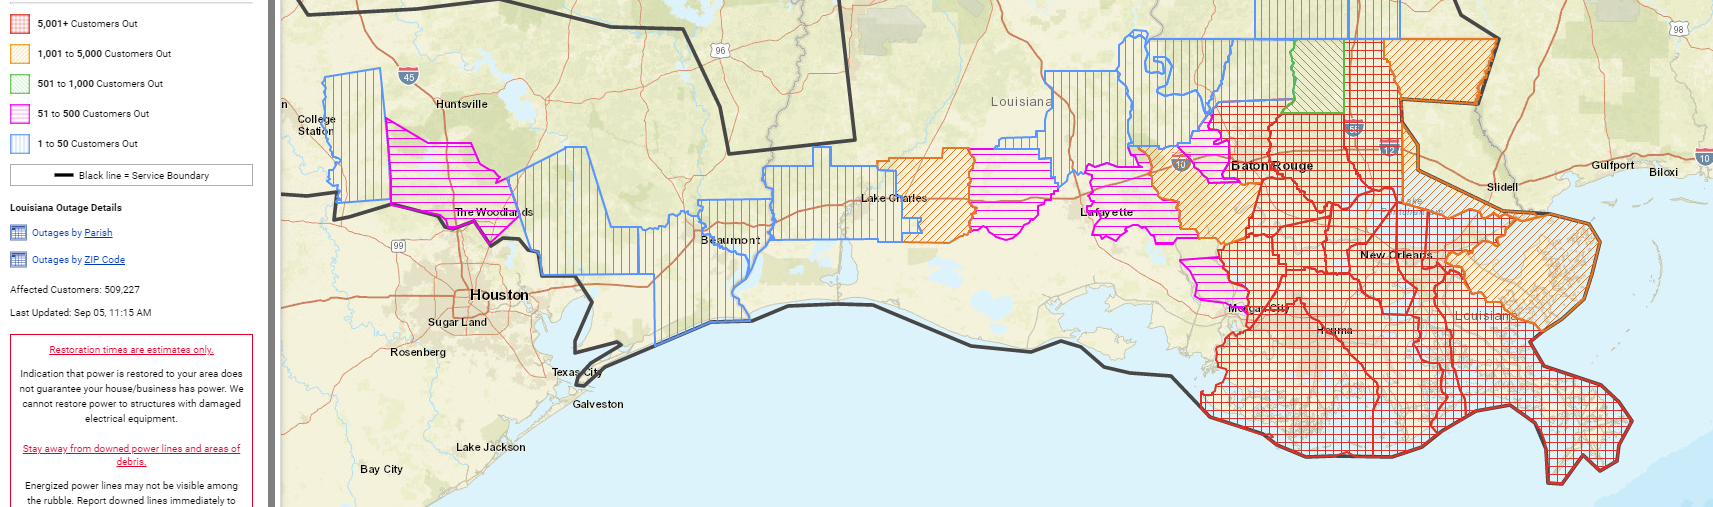
See this link for the last outage maps by state: https://www.etrviewoutage.com/map?state=LA
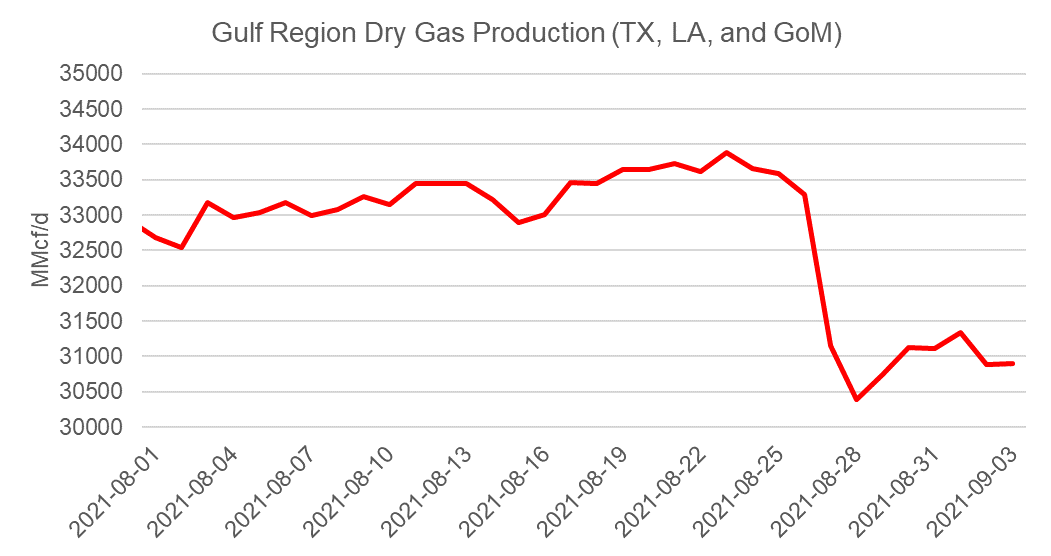
Overall, US dry gas production was lower by 2.7 Bcf/d to average 90.8 Bcf/d. All the shut-in production is expected to take up to a month to return.
Total consumption was also lower this week, primarily driven by fewer pwCDDs and impacts from the fast-moving Ida making it all the way to the Northeast coast. Total national temps were lower by 2.0F week-on-week which impacted power burns, but Ida also hit industrial and commercial demand. The heavy rain and flooding impacted Gulf Coast refineries/plants and Northeast commercial demand. The full damage is yet to be assessed, and this could have a lingering demand impact.
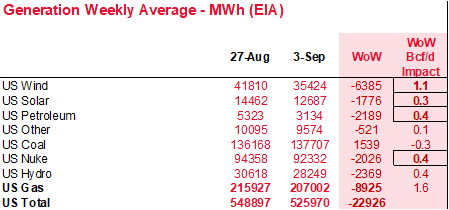
Total national power generation was lower by 4.2% from the previous week, and wind generation off considerably by 15%. The drop in wind helped boost natgas demand by 1.1 Bcf/d.
Deliveries to LNG facilities averaged 10.5Bcf/d, which was -0.1 Bcf/d lower than the previous week. Surprisingly LNG feedgas levels stayed strong through most of Hurricane Ida but started to fall on Aug 30th with Sabine Pass leading the way. Ida likely disturbed tanker traffic and as a result, Sabine’s onsite storage could be near capacity, which has pushed them to reduce feedgas levels. Freeport also reduced feedgas volumes on Aug 31st.
The net balance is looser by 3.2 Bcf/d week-on-week. This upcoming report is likely to be volatile with so many moving pieces due to the storm.
Expiration and rolls: UNG ETF roll starts on Sept 14th and ends on Sept 17th.
Oct futures expire on Sept 28th, and Oct options expire on Sept 27th.
This email, any information contained herein and any files transmitted with it (collectively, the Material) are the sole property of OTC Global Holdings LP and its affiliates (OTCGH); are confidential, may be legally privileged and are intended solely for the use of the individual or entity to whom they are addressed. Unauthorized disclosure, copying or distribution of the Material, is strictly prohibited and the recipient shall not redistribute the Material in any form to a third party. Please notify the sender immediately by email if you have received this email by mistake, delete this email from your system and destroy any hard copies. OTCGH waives no privilege or confidentiality due to any mistaken transmission of this email.