PDF Attached
OPEC+ meeting this morning put a bid back into crude after the cartel decided to cut production by 2 million bpd. The driver for the cut was the reduced global oil price since June on weaker demand. USD reversed to the upside as the bullish trend remains in place as the market sees the Fed continuing to raise rates and moving the “Fed pivot” higher. Equities rallied to erase early losses as the market is trying to decide if “bad news is good news”.
![]()
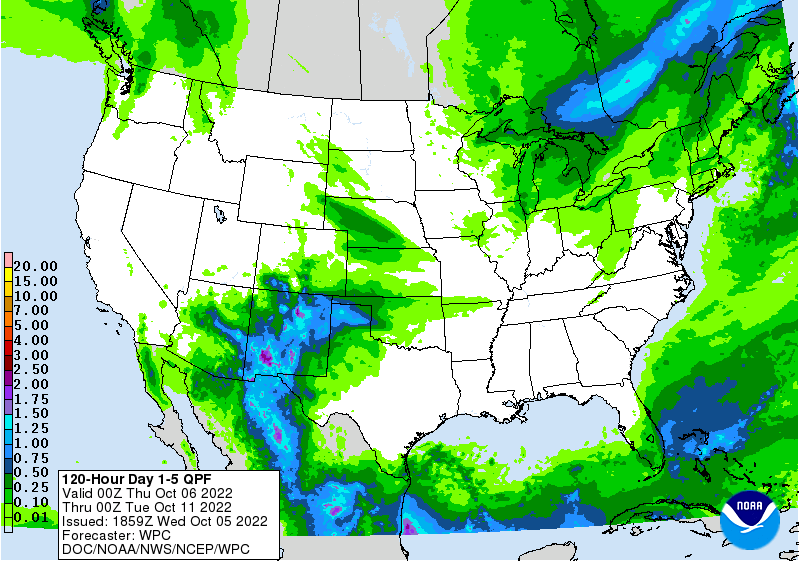
US weather remains favorable for harvest and unfavorable for Midwest river levels. US Midwest weather conditions will remain drier than normal. The southern Great Plains will remain on the drier side over the next week. Argentina planting progress improved but more rain is needed. Brazil is in good shape.
Bloomberg Ag Calendar
- US Trade Data for August
- EIA weekly US ethanol inventories, production, 10:30am
- Malaysia’s Oct. 1-5 palm oil export data
- HOLIDAY: China, India, Bangladesh
Thursday, Oct. 6:
- USDA weekly net-export sales for corn, soybeans, wheat, cotton, pork and beef, 8:30am
- New Zealand commodity price
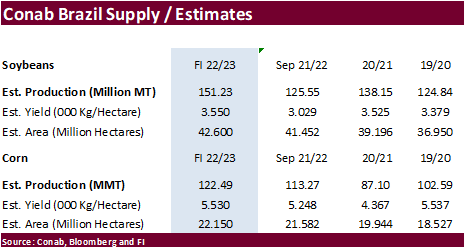
- Brazil’s Conab releases data on area, yield and output of corn and soybeans
- HOLIDAY: China
Friday, Oct. 7:
- FAO World Food Price Index
- ICE Futures Europe weekly commitments of traders report
- CFTC commitments of traders weekly report on positions for various US futures and options, 3:30pm
- FranceAgriMer weekly update on crop conditions
- Vietnam customs data on September coffee, rice and rubber exports
- HOLIDAY: China, Argentina
Macros
OPEC+ JMMC Agrees Oil Output Cuts Of 2 Mln BPD – RTRS Sources
US ISM Non-Mfg PMI Aug: 56.7 (est 56.0; prev 56.9)
– Biz. Activity: 59.1 (prev 60.9)
– Employment: 53.0 (prev 50.2)
– New Orders: 60.6 (prev 61.8)
– Prices Paid: 68.7 (prev 71.5)
US Trade Balance Aug: -$67.4B (est -$67.7B; prev -$70.7B)
US Crude Oil Exports Fell To 3.65 Million BPD In August (3.80 Million BPD In July) – Census
Canadian Trade Balance Aug: C$1.52B (est C$3.50B; prev C$4.05B; prevR C$2.37B)
Canadian Building Permits (M/M) Aug: 11.9% (est -0.5%; prev -6.6%; prevR -7.3%)
Due out October 6
Corn
· Corn futures finished higher on bullish EIA data despite a firmer USD and harvest pressure.
· WTI crude oil turned higher after OPEC confirmed they aim to cut mineral oil production.
· US corn for ethanol use improved last week per EIA ethanol production data. US stocks of ethanol and finished motor gasoline tightened.
· Trade estimates for the USDA October report will be released over the next two days. We hear StoneX is at 51.3 for the US soybean yield (4.442 billion) and 173.9 bu/yield for US corn (14.056 billion). FI is using 49.8 and 170.1 bu/acre for soybean and corn, respectively.
· Memphis-Cairo Barge Freight (offer) for the October position increased to 3,000 percentage points for the nearby position, up from 2,000 late last week. Low water levels are causing reduced barge drafts and therefore requiring more barges to move less grain.
· Anec looks for Brazil October corn exports at 4.208 million tons, up from 1.873 million tons October 2021.
Weekly US ethanol production increased 34,000 barrels per day to 889 thousand, above a Bloomberg trade average of 874. Stocks decreased a large 1.006 million barrels to 21.685 million. Traders were looking for stocks to be down only 50,000 barrels. US gasoline stocks fell 4.7 million barrels to 207.45 million barrels, lowest since November 2014. US gasoline demand increased 640,000 barrels to 9.46 million barrels. EIA suggested the total ethanol blended into finished motor gasoline was running at 92.6%, up from 90.9% previous week.
Soybeans
· CBOT soybean closed lower today on the firmer USD and harvest pressure.
· Palm oil futures were up for the fifth consecutive day.
· Soybean oil rose on firmer global vegoils and higher crude markets. Spreading vs meal was also noted.
· The low river levels on the Mississippi will back up the physical soymeal barge cargoes causing more logistical problems and could weigh on price.
· Anec expects Brazil to export 1.804 million tons of soybean meal during the month of October, up from 1.337 million October 2021. Soybeans were seen reaching 3.110 million versus 2.985 million year ago.
· ITS reported Malaysian 1-5 palm oil exports at 155,170 tons, down 37.7 percent from Aug 1-5 period.
· US wheat prices settled mixed today with SRW lower on the firmer USD and HRW firmer on the drier Great Plains were the newly sown crop in emerging ahead of winter.
· StoneX estimated Brazil wheat production at 10 million tons and imports at 6.2 million tons for 2022-23. USDA is at 8.70 million tons for Brazil wheat production and 6.4 million tons for export. This compares to 7.7 MMT for 2021-22 production and 6.5 MMT imports.
· Paris December wheat was up 3.00 euro earlier at 352.75 per ton.
Trade estimates for USDA weekly grain, soy export sales
All estimates are quoted in tons. Figures in parentheses reflect net cancellations.
|
Trade estimates for 2021-22 |
Trade estimates for 2022-23 |
|
|
Wheat |
N/A |
200,000-450,000 |
|
Corn |
N/A |
350,000-800,000 |
|
Soybeans |
N/A |
500,000-1,200,000 |
|
Soymeal |
(50,000)-100,000 |
100,000-300,000 |
|
Soyoil |
(10,000)-10,000 |
0-20,000 |
Source: Reuters and FI
Terry Reilly
Senior Commodity Analyst – Grain and Oilseeds
Futures International
One Lincoln Center
18 W 140 Butterfield Rd.
Oakbrook Terrace, Il. 60181
W: 312.604.1366
ICE IM: treilly1
Skype: fi.treilly

Trading of futures, options, swaps and other derivatives is risky and is not suitable for all persons. All of these investment products are leveraged, and you can lose more than your initial deposit. Each investment product is offered only to and from jurisdictions where solicitation and sale are lawful, and in accordance with applicable laws and regulations in such jurisdiction. The information provided here should not be relied upon as a substitute for independent research before making your investment decisions. Futures International, LLC is merely providing this information for your general information and the information does not take into account any particular individual’s investment objectives, financial situation, or needs. All investors should obtain advice based on their unique situation before making any investment decision. The contents of this communication and any attachments are for informational purposes only and under no circumstances should they be construed as an offer to buy or sell, or a solicitation to buy or sell any future, option, swap or other derivative. The sources for the information and any opinions in this communication are believed to be reliable, but Futures International, LLC does not warrant or guarantee the accuracy of such information or opinions. Futures International, LLC and its principals and employees may take positions different from any positions described in this communication. Past results are not necessarily indicative of future results.