PDF Attached
USDA report day. We attached our updated US balance sheets. Bullish for all CBOT main agriculture markets with prices ended higher. Grains were lower and soybean complex higher before the report but that all changed after USDA released multiple reports, including the US crop annual that showed a large cut to US corn and soybean production estimates. Old crop wheat was left unchanged. New-crop winter wheat seedings were higher than expected but wheat rallied from higher corn & soybeans. US CPI was mostly in line with expectations at 6.5%, lowest since October 2021. Initial jobless claims were slightly below an average trade guess. WTI traded higher, USD down 91 points as of 2:45 pm CT, and US equities higher. USDA export sales were below average for this time of year. Product sales were poor, meal shipments good, and soybean sales within expectations. Grain sales were poor. Conab updated their soybean production estimate – down 800,000 from the previous month to 152.71 million tons and 200,000 tons below trade expectations. Corn production was 125.06 million tons, also down 800,000 from last month and 2.0 million tons below an average trade guess.
![]()
The US CPC looks for La Nina to transition to a neutral ENSO even during the February through April period. The morning weather forecast improved for parts of the US Midwest, Delta, Brazil while turned slightly unfavorable for Argentina. Argentina will see some light rain across Cordoba and Santa Fe today through early Friday.
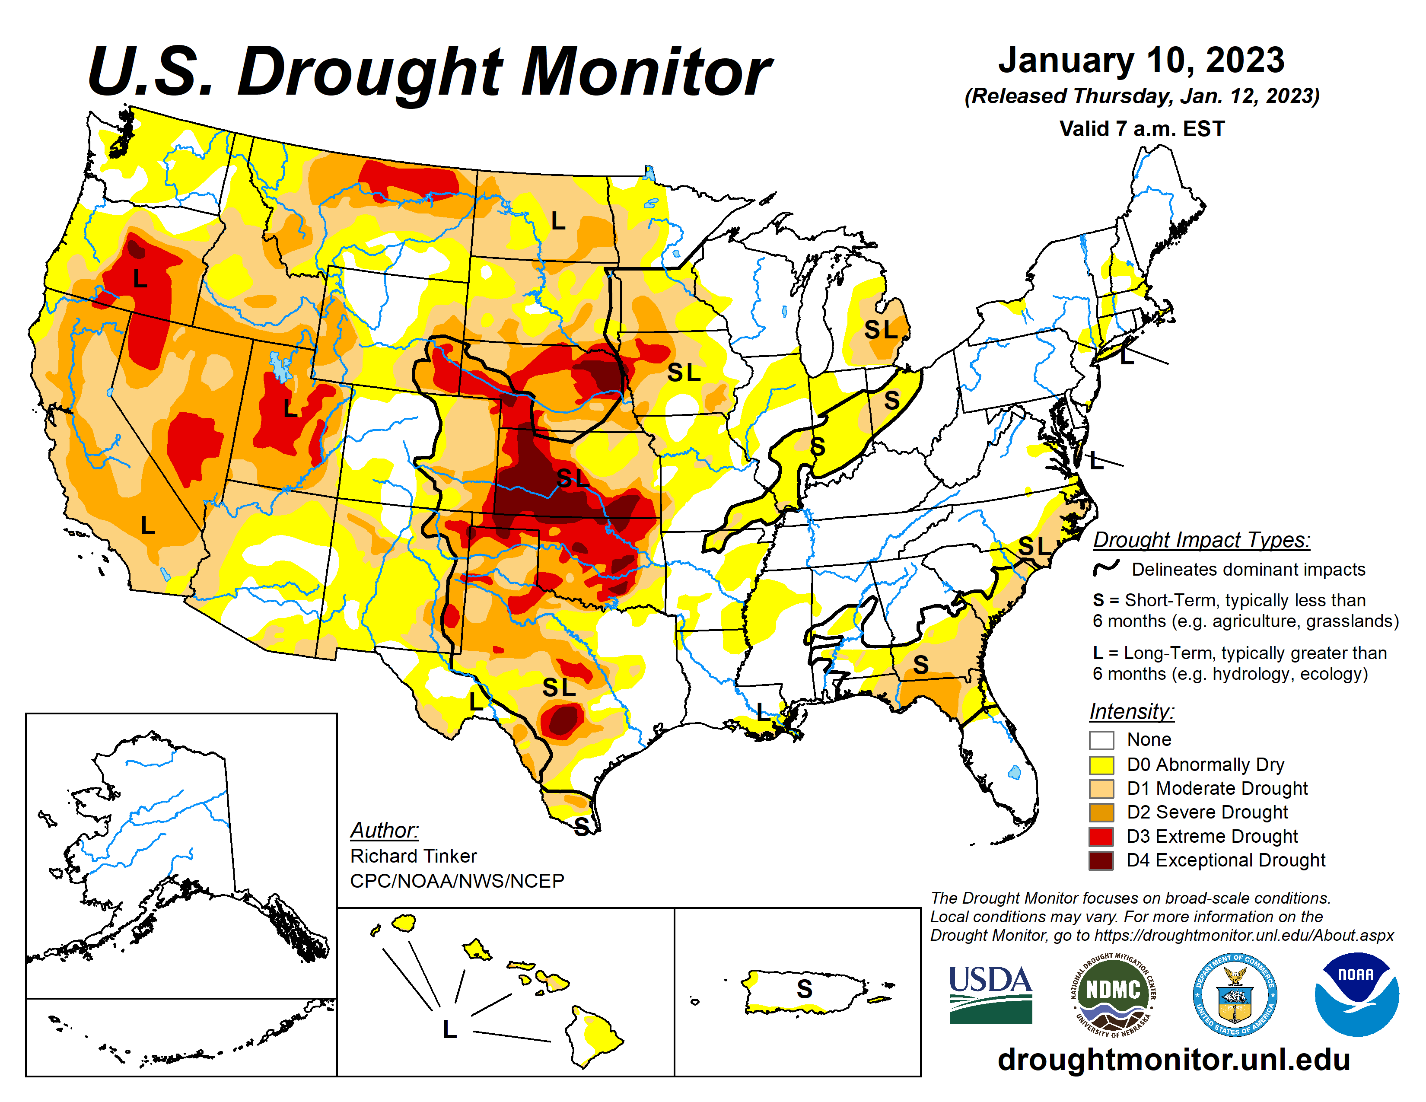
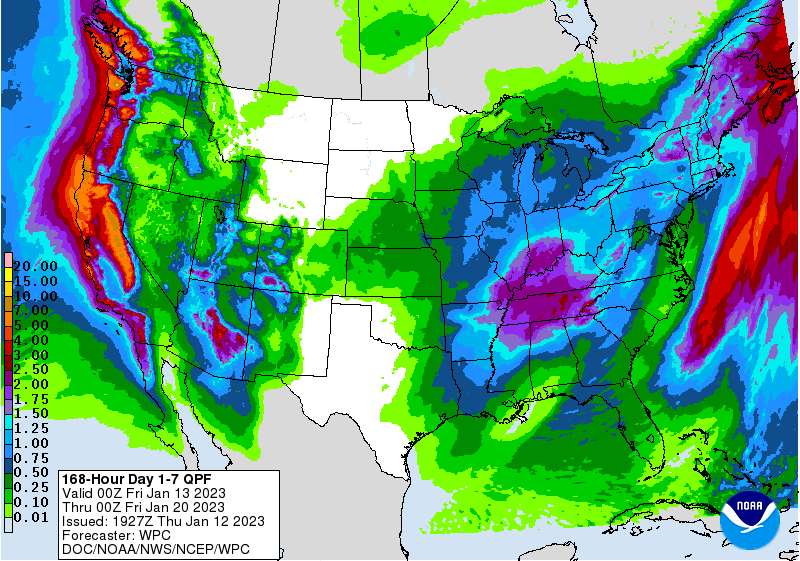
MOST IMPORTANT WEATHER FOR THE COMING WEEK
- Northern portions of U.S. hard red winter wheat areas will have opportunity for dryness relief from a couple of weather systems expected next week and into the following weekend
- The precipitation events will not bring moisture to the southwestern Plains leaving the Texas Panhandle, far western Oklahoma and southwestern Kansas without much meaningful moisture
- Precipitation will be possible in Nebraska, northern and eastern Kansas, eastern Oklahoma and northeastern Colorado
- Changes in the advertised precipitation events will likely occur in future model runs, but the odds do favor at least some precipitation in the areas mentioned
- Today’s forecast model runs may be a little aggressive with precipitation amounts in a part of the central Plains with the first storm next week likely to have a greater impact on the northeastern Plains and upper Midwest than the west-central high Plains
- U.S. northeastern Plains, upper Midwest precipitation will increase during mid- to late week next week favoring the Dakotas and Minnesota with snow and some rain
- The event will be similar to that which occurred in late December
- U.S. eastern Midwest, Delta and southeastern states will experience periodic rainfall during the next two weeks supporting a rise in soil moisture
- Some of the eastern Midwest that has not seen normal rain in recent months will do better during this period of time and a boost in subsoil moisture and runoff potential may evolve gradually over time
- The Tennessee River Basin will be wettest and will have the greatest runoff potential
- U.S. West and South Texas precipitation will be limited over the next two weeks
- Greater precipitation will be needed later this winter and especially during spring to bolster soil moisture for improved planting conditions
- In the meantime, moisture is needed to support wheat development
- California’s stormy weather pattern will continue into early next week, but a high pressure ridge is expected next week that will shut down the precipitation for a while
- California’s Sierra Nevada snow water equivalents have reached 81% of the April 1 norm in the north, 104% of the April 1 norm in central areas and 123% of the norm in the south
- Compared to normal for January 11 the snow water equivalents are varying from 184-269%
- Northwestern U.S. Plains and Canada’s Prairies precipitation will be limited for a while in this coming week to ten days
- North America temperatures will be warmer than usual for another week except in the western U.S. where readings will be near to below average
- Colder weather is expected in central and eastern parts of North America during the final days of January and early February
- This change should also induce below average precipitation in the western and central parts of the nation
- Argentina’s weather outlook changed little in this first ten days of the outlook today
- Rain will fall in northern Argentina today and early Friday with a few showers lingering in central areas early today
- Restricted rainfall is expected across the nation from this weekend through the middle part of next week
- Random showers and thunderstorms are expected favoring the west and northern parts of the nation
- Central and southern Argentina (outside of western Cordoba) will be drier biased during the coming ten days
- Argentina’s late month weather may stimulate a little more rainfall, but a general soaking rain is still not likely to evolve leaving some ongoing crop concerns
- Argentina temperatures will heat up once again next week with above normal readings inducing another round crop moisture stress in areas that fail to get much moisture through the weekend
- Brazil weather will include a good distribution of rain during the next ten days
- Relief from recent dryness is expected in Rio Grande do Sul, but greater precipitation will be needed to ensure dryness does not return at some point later this month
- Central and northern parts of Brazil will see the highest degree of repetition in rainfall during the coming ten days
- Areas that have been too wet in the past week to ten days will see less intensive rainfall and improved soil condition should evolve next week
- Early harvest weather should improve, but periodic rainfall is expected and that may disrupt fieldwork periodically
- Safrinha corn and cotton prospects are very good for center west and center south Brazil this year
- India needs improved rainfall for its winter crops, but not much moisture is expected outside of the far north and extreme south for at least another week to ten days
- Most of the nation’s greatest rain will continue from Uttarakhand northward into Jammu and Kashmir during the next two weeks
- Some light showers will occur briefly from northern Uttar Pradesh to Punjab with two week rain totals no more than 0.50 inch and many areas getting less than 0.25 inch
- Any rain will be welcome, but more is needed
- Western and central Europe will be stormy in this coming week followed by a drier week of weather
- Temperatures will be warmer than usual over the two weeks, although less anomalously warm in the second week
- Soil moisture continues to improve in many areas, although moisture deficits remain in eastern Spain and the lower Danube River Basin
- Eastern China will receive light rain and snow over the next few days and then trend drier again next week.
- The moisture will be great for winter wheat and rapeseed, although crops will remain dormant or semi-dormant for a while
- The moisture should be available in the spring to support early season crop development
- Central Philippines received heavy rain again Wednesday and early today
- Some flooding has occurred recently because of frequent bouts of excessive moisture
- A strong monsoonal flow pattern will promote additional bouts of rainy weather throughout the central and eastern parts of the nation during the next two weeks
- Additional flooding is expected periodically
- North Africa rain potentials are expected to improve during the second week of the forecast resulting in a possible boost in topsoil moisture Jan. 19-25
- The moisture is needed to improve conditions for spring crop development
- Russia’s New Lands will be drier and warmer over the next week to ten days
- Recent bitter cold has had a low impact on winter crops because of adequate snow cover
- Far western Russia, Belarus and the Baltic States will experience waves of snow and rain during the next ten days resulting in a boost in both snow cover and spring runoff potential
- Limited precipitation is expected in other winter crop areas in the western CIS
- Australia summer crop areas in southern Queensland and parts of New South Wales would benefit from greater rain
- Dryland western production areas in Queensland need rain more than any other area today and not much is expected for another week
- Rain has increased recently in central Queensland benefitting some corn, soybean, cotton and other crops along with some sugarcane
- January 19-25 is expected to trend wetter in southern Queensland and New South Wales, although confidence in the details is low today
- South Africa will receive very little rain during the next few days and then some showers will begin late this weekend into early next week in south-central and southeastern parts of the nation
- The precipitation may be a little erratic and light initially raising the need for greater rainfall later this month and into February
- The second week outlook is wetter today than that of Wednesday
- Southeast Asia (Indonesia and Malaysia in particular) rainfall has diminished because of the suppressed phase of Madden Julian Oscillation and that will continue for a little while longer
- Soil moisture will decrease for a while until rainfall increases again which may not occur until late this month
- Totally dry weather is unlikely, and the showers expected will help slow drying rates and key crop conditions very good
- Western Turkey is receiving some rain and snow and more is needed
- Central and eastern parts of the nation are relatively dry
- Most of the wheat and other winter crops are rated favorably due to good autumn precipitation, but there is need for greater precipitation in all of the nation
- Middle East rainfall is expected to be favorably mixed over the next ten days although the resulting precipitation should be mostly light to locally moderate
- Some rain will return to central and eastern Turkey next week ending a ten day period of dry weather
- Iraq and Syria will not get much precipitation for a while and the same may occur in Jordan and few neighboring areas
- East-central Africa precipitation is expected to be abundant in Tanzania over the next ten days to two weeks while that which occurs in Uganda, southwestern Kenya and Ethiopia is more sporadic and light.
- Coffee and cocoa conditions should remain favorable in all production areas, despite the anomalies
- West-central Africa dryness will continue through the next ten days to two weeks
- Dry conditions are normal at this time of year
- No excessive heat is expected in this coming week, although warmer than usual conditions are beginning to evolve and may continue into the latter part of this month
- Vietnam central and lower coastal areas may receive bouts of rain in the coming week with some of it possibly reaching into the Central Highlands
- Light showers were noted in these same areas Tuesday and early today
- Today’s Southern Oscillation Index was +21.44 and the index is expected to begin a steady fall over the next week to ten days
Source: Bloomberg and FI
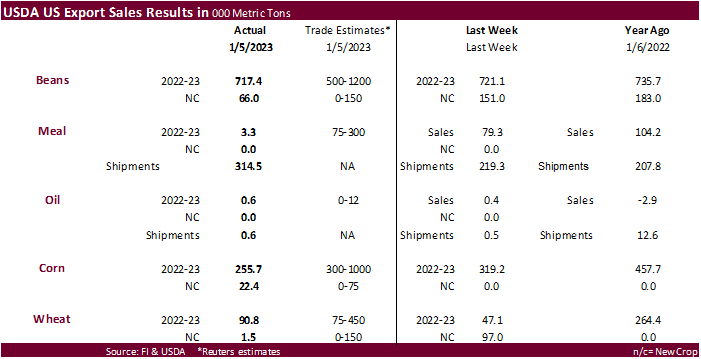
USDA export sales
Soybean sales of 717,400 tons were within expectations. More than half of the 676,600 tons of soybean booked by China were switched from unknown. Soybean meal sales were poor at only 3,300 tons but shipments were good at 314,500 tons. Soybean oil sales were only 600,000 tons and shipments the same amount. Corn export sales were well below expectation at 255,700 tons and all-wheat were a low 90,800 tons. Mexico was active for corn. China switched a cargo of wheat and couple cargoes of corn from unknown destinations.


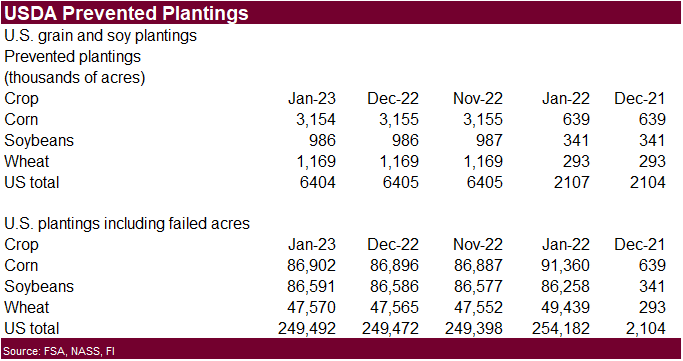
Macros
US EIA NatGas Storage Change (BCF) 06-Jan: +11 (est -9; prev -221)
Spot Gold Tops $1,900 An Ounce For First Time Since May
– Salt Dome Cavern NatGas Stocks (BCF): +25 (prev -53)US CPI (M/M) Dec: -0.1% (exp -0.1%; prev 0.1%)
– CPI Core (M/M) Dec: 0.3% (exp 0.3%; prev 0.2%)
– CPI (Y/Y) Dec: 6.5% (exp 6.5%; prev 7.1%)
– CPI Core (Y/Y) Dec: 5.7% (exp 5.7%; prev 6.0%)
US Initial Jobless Claims Jan-7: 205K (exp 215K; R prev 206K)
– Continuing Claims Dec-31: 1643M (exp 1710K; R prev 1697K)
US Real Average Hourly Earnings (Y/Y) Dec: -1.7% (R prev -2.1%)
– Real Average Weekly Earnings (Y/Y) Dec: -3.1% (R prev -3.3%)
Early Thursday: US Short-Term Interest Rate Futures Now Up On The Day
– Traders See Quarter-Point Rate Hike In February As Overwhelmingly Likely
· CBOT corn futures traded two sided, ending higher from a bullish USDA report that cut 2022 US and Argentina corn production. Prices were higher earlier let by the nearby contracts on Argentina crop concerns and renewed hopes US exports will increase over the medium term as Brazil supplies start to dry up. But before the USDA report grain prices turned lower. USDA estimated lower than expected December 1 corn and soybean stocks, in large part to lower 2022 US production. Our snapshot can be found after the text.
· Funds bought an estimated net 11,000 corn contracts.
· USDA lowered 2022 US corn production by 200 million bushels to 13.730 billion, in large part to a smaller US harvested area. The drought in Nebraska and other southern Great Plains states took its toll on the corn and soybean crops. The US corn carryout was lowered 15 million bushels, a surprise as the trade was looking for a sizable increase. They didn’t see the large cut in supplies coming. US corn exports were lowered 150 million, food by 10 and feed by 25.
· USDA lowered Argentina corn production by 3.0 million tons to 52 million and Brazil output by 1.0 million to 125 million. World corn production was lowered 5.9 million tons to 1.156 billion, 59 million below year ago. We think USDA was too conservative with the Argentina production estimates
· The Rosario grains exchange lower their Argentina corn production estimate by 10 million tons to 45 million tons. The BA Grains Exchange lowered their estimate for the Argentina corn crop to 7.1 million hectares from 7.3 million previous. The BA Grains Exchange said 83 percent of the corn crop had been planted.
· Given that USDA took US corn production down 200 million bushels and quarterly stocks were below the average traded guess, corn for feed was used was still less than expected (140 million below our working estimate), when backing into the smaller supply. USDA responded by lowering corn for feed use by 25 million bushels. They slashed exports to 1.925 billion from 2.075 billion. We thought this was a little too aggressive for the downward revision in exports as the February through early June window for US corn exports is seen improving. We took our feed use down 100 million bushels from previous and exports down 50 million from last month, to 5.300 billion and 2.000 billion, respectively. This still leaves a relative tight 2022-23 US ending carryover to 1.156 billion, below USDA’s January estimate of 1.242 billion.
· We look for corn for feed, ethanol and export use to rebound in 2023-24 if the area expends by more than 2.5 million acres, as we project.


· The trade is looking for a conservative decrease for the Argentina corn production, but many analysts are already well below the USDA trade guess (Reuters) of 52 million tons for final output. USDA December was 55 million tons.
· Brazil’s Conab corn production was reported at 125.06 million tons, down 800,000 from last month and 2.0 million tons below an average trade guess.
· The IGC lowered its forecast for 2022-23 global corn production by five million tons to 1.161 billion tons in large part to a cut to Ukraine’s crop.
· The Baltic Dry Index fell 6.4% to 976 points.
Export developments.
· South Korea’s NOFI group bought 133,000 tons of corn at $338.88/ton for April 15 and April 25 arrival.
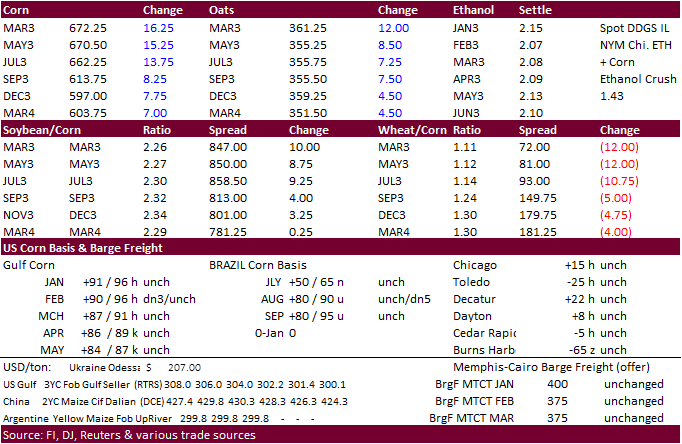
Updated 01/12/23
March corn $6.30-$7.00 range. May $6.25-$7.20
· CBOT soybeans traded and ended sharply higher from a bullish USDA report and Argentina crop concerns, despite poor USDA export sales. Yesterday Brazil soybean premiums were higher on talk of a few cargoes of Brazil soybeans sold to Argentina. Soybean meal and oil ended higher. Soybean meal basis for Decatur, IL, was up $10 short ton to 30 over the March. We heard there might have been some interest in US soybean meal out of the PNW, but we could not verify that.
· Funds bought an estimated net 11,000 soybean contracts, 3,000 meal and 3,000 soybean oil.
· US 2022 soybean production was lowered to 69 million bushels to 4.276 billion, from a 0.7 bu decrease in the yield. The US carryout was lowered 10 million bushels. Like corn, the trade did not see the cut in soybean production coming. USDDA lowered us soybean exports by 55 million bushels and residual by 4 million. USDA made no changes to their soybean meal balance estimates. For soybean oil, they chopped exports by 300 and raised food use by 300, leaving the carryout unchanged.
· We lowered our US 2022-24 US soybean residual by 5 million bushels and exports by 20 million to 2.000 billion bushels, 10 million above USDA. Our crush estimate was left unchanged at 2.231, below USDA’s unchanged 2.245 billion estimate from December. Our 2022-23 nearby rolling price projection was left unchanged at $15.05. We see meal at $420 and SBO at 70 cents (subject to go lower if prices continue to erode for SBO).


· Anec confirmed the purchases, saying 200,000 to 300,000 tons (3-5 cargoes) were sold for February and March delivery. They are calling it “atypical” and mentioned crush margins in Argentina drove the purchases of soybean from Brazil. They said the soybean dollar encouraged a surge in Argentina soybean exports, depleting local stocks.
· USDA lowered Argentina soybean production by 4 million tons to 45.5 million and took Brazil up by 1 million tons to 153 million. World soybean production was lowered 3.2 million tons to 388 million.
· Conab updated their soybean production estimate. It was down 800,000 from the previous month to 152.71 million tons and 200,000 tons below trade expectations.
· The BA Grains Exchange lowered their estimate for the soybean crop by 7 million tons to 41 million. The drought was cited to be the worst in 60 years.
· Late yesterday Argentina’s Rosario Grains exchange drastically lowered their Argentina soybean crop to 37 million tons from a previous forecast of 49 million tons and took corn down to 45 million tons from 55 million previous. Some trade estimates are below the exchange projections. EarthDaily Analytics, a satellite firm, estimated the Argentina soybean crop at 36.9 million tons.
· The BA Grains exchange estimated the Argentina soybean crop at 41 million tons, down from 48 million previously.
· India palm oil imports during December were 1.1 million tons from 565,943 tons year ago and sunflower oil imports were 194,009 tons from 258,449 tons year ago. India soybean oil imports were 252,525 tons, down from 392,471 tons year ago. Note inspection services reported that India imported a much less amount of palm oil from a year ago for the first 10 days of January.

· South Korea bought 12,000 tons of soybean meal from China at $602/ton c&f for arrival by April 30.
· Turkey seeks about 24,000 tons of sunflower oil on January 13 for February 15 to March 20 delivery.
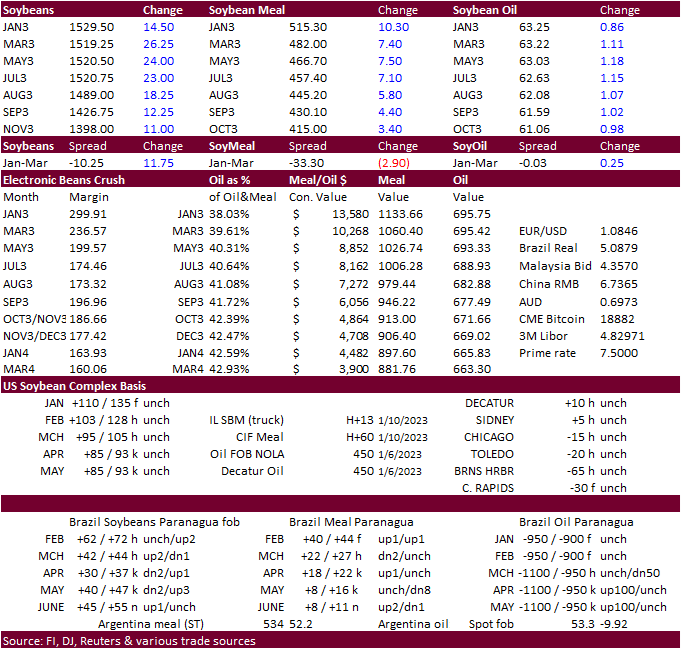
Updated 01/12/23
Soybeans – March $14.75-$15.75, May $14.75-$16.00
Soybean meal – March $460-$525, May $425-$550
Soybean oil – March 60.00-68.00, May 59-70
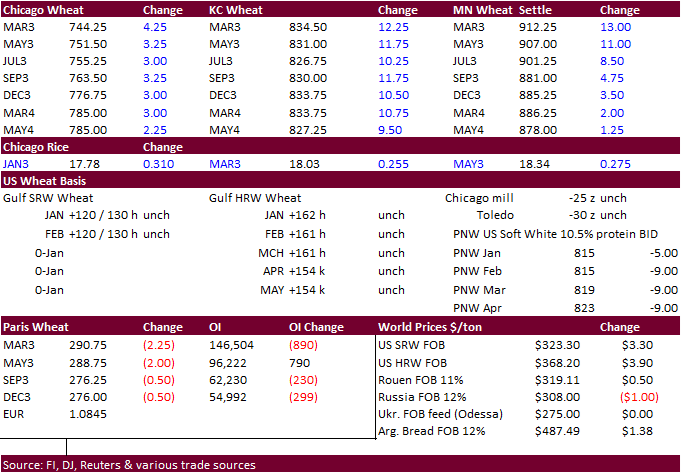
· US wheat futures were mixed to start and ended higher after corn and soybeans rallied. The USDA reports were neutral, in our opinion. Winter wheat seedings were higher than expected at 36.950 million acres (up 11 percent from last year), world wheat production raised a small amount, world stocks up slightly, and US carryout stocks revised lower by 5 million bushels. USDA in an odd move, lowered old crop feed use for US wheat by 29 million bushels, boosting 2022-23 beginning stocks by a like amount. USDA increased feed use by 30 million bushels.
· Funds bought an estimated net 2,000 Chicago wheat contracts.
· USDA increased world wheat production by 700,000 tons to 781.3 million tons and stocks were taken up 1.1 million tons to 268.4 million tons.
· US wheat for feed during the second quarter was much better than expected but left out 60 million bushel estimate unchanged. It’s likely we may see large negative residual figures over the second half of the crop-year.
· The US wheat situation looks bearish over the long run. We look for the Chicago nearby rolling average wheat price to average $8.70 for the entire 2022-23 crop year, down 5 cents from previous month. For next crop-year wheat could average below $7.00 per bushel, depending on where corn and soybeans trade. We look for US 2023-24 all wheat stocks to end up above 650 million bushels, compared to USDA’s 2022-23 carryout of 567 million. Our previous 2023 US winter wheat production estimate was 1.786 billion bushels. Now we look for 1.893 billion.
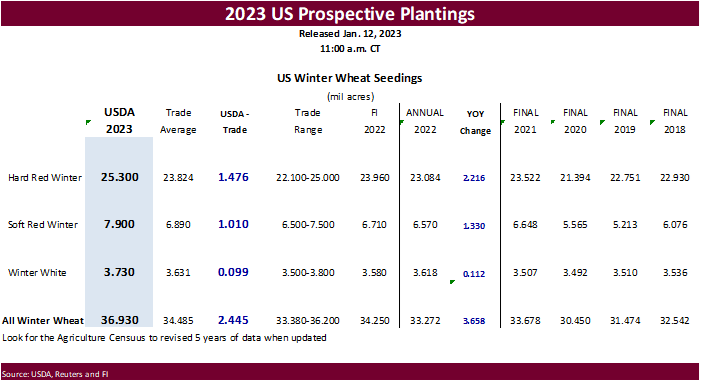
· The US dollar hit its lowest level since June.
· The IGC raised its forecast for 2022-23 global wheat production by five million tons to a record 796 million, and up from 781 million tons year ago. USDA is at 781.31 million tons.
· Paris March wheat was down 2.25 euros at 292.50 per ton.
· Mild weather across Europe caused some of the winter crops to emerge from dormancy, causing concern if a cold snap develops. Nearly all French winter wheat and barley were in good condition ahead of winter. The soft wheat planted area for all of Europe is expected to expand from 2022.
· Conab estimated Brazil’s 2022 wheat crop could end up near 9.77 million tons, up from 9.550 million tons forecast in December.
Export Developments.
· South Korean flour millers bought 80,000 tons of wheat from the US for shipment between March 16 and April 15.
-50,000 tons-soft white wheat of about 9.5% to 11% protein content bought at around $309 a ton, soft white wheat of 8.5% protein bought at around $312 a ton, hard red winter wheat of 11.5% protein bought at around $371 a ton and northern spring/dark northern spring wheat of 14% protein bought around $388 a ton.
-30,000 tons was bought for shipment between April 1 and April 30 – soft white wheat of about 9.5% to 11% protein content bought at around $308 a ton, soft white wheat of 8.5% protein bought at around $310 a ton, hard red winter wheat of 11.5% protein bought at around $371 a ton and northern spring/dark northern spring wheat of 14% protein bought around $387 a ton.
· South Korea’s NOFI group bought 133,000 tons of corn at $338.88/ton for April 15 and April 25 arrival.
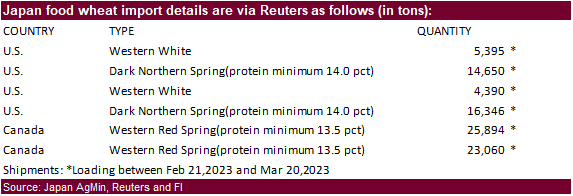
· Japan bought 89,735 tons of food wheat. Original tender details:
· Egypt ended up buying 120,000 tons of wheat at $337/ton c&f for Feb 10-25 shipment.
· Taiwan is in for 45,200 tons of US wheat on January 13 for March shipment. Wheat types sought include dark northern spring, hard red winter and white wheat.
Rice/Other
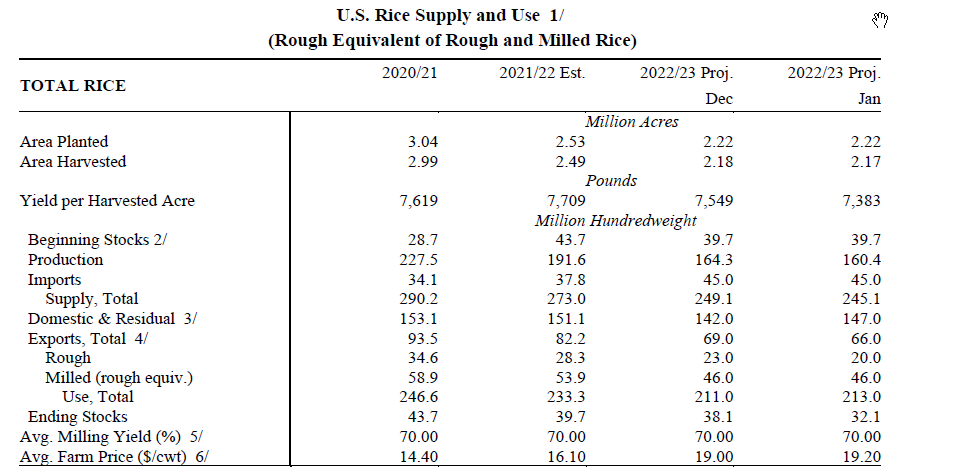
· US rice stocks were cut by USDA by about 20 percent.
Updated 01/12/23
Chicago – March $7.00 to $8.25, May $7.00-$8.50
KC – March $7.75-$9.25, $7.50-$9.50
MN – March $8.75 to $10.00, $8.00-$10.00
U.S. EXPORT SALES FOR WEEK ENDING 1/5/2023
|
|
CURRENT MARKETING YEAR |
NEXT MARKETING YEAR |
||||||
|
COMMODITY |
NET SALES |
OUTSTANDING SALES |
WEEKLY EXPORTS |
ACCUMULATED EXPORTS |
NET SALES |
OUTSTANDING SALES |
||
|
CURRENT YEAR |
YEAR AGO |
CURRENT YEAR |
YEAR AGO |
|||||
|
|
THOUSAND METRIC TONS |
|||||||
|
WHEAT |
|
|
|
|
|
|
|
|
|
HRW |
32.2 |
953.7 |
2,041.2 |
20.2 |
3,194.5 |
4,318.3 |
0.0 |
69.3 |
|
SRW |
10.1 |
626.8 |
679.9 |
15.5 |
1,763.7 |
1,698.0 |
0.0 |
41.6 |
|
HRS |
-0.1 |
1,295.6 |
1,259.6 |
54.2 |
3,227.4 |
3,076.6 |
0.0 |
49.8 |
|
WHITE |
25.2 |
1,207.7 |
805.6 |
84.9 |
2,501.7 |
2,101.3 |
0.0 |
0.3 |
|
DURUM |
23.4 |
121.2 |
54.2 |
18.9 |
168.4 |
112.7 |
1.5 |
1.5 |
|
TOTAL |
90.8 |
4,205.0 |
4,840.5 |
193.6 |
10,855.7 |
11,307.0 |
1.5 |
162.5 |
|
BARLEY |
0.0 |
4.9 |
19.0 |
0.3 |
6.7 |
11.5 |
0.0 |
0.0 |
|
CORN |
255.7 |
11,612.2 |
25,790.0 |
387.1 |
10,384.0 |
15,664.6 |
22.4 |
1,161.4 |
|
SORGHUM |
0.0 |
140.9 |
3,576.3 |
0.2 |
220.0 |
1,752.6 |
0.0 |
0.0 |
|
SOYBEANS |
717.4 |
14,741.4 |
10,803.7 |
1,620.7 |
29,662.1 |
31,633.7 |
66.0 |
397.0 |
|
SOY MEAL |
3.3 |
3,191.1 |
2,880.4 |
314.5 |
3,012.1 |
3,350.0 |
0.0 |
18.3 |
|
SOY OIL |
0.6 |
18.2 |
232.6 |
0.6 |
19.5 |
205.1 |
0.0 |
0.6 |
|
RICE |
|
|
|
|
|
|
|
|
|
L G RGH |
5.1 |
127.1 |
175.4 |
0.5 |
192.0 |
584.0 |
0.0 |
0.0 |
|
M S RGH |
0.0 |
13.4 |
10.5 |
0.3 |
13.5 |
3.2 |
0.0 |
0.0 |
|
L G BRN |
0.0 |
8.1 |
3.7 |
0.3 |
7.8 |
27.3 |
0.0 |
0.0 |
|
M&S BR |
29.2 |
36.8 |
67.7 |
0.1 |
7.1 |
16.5 |
0.0 |
0.0 |
|
L G MLD |
14.0 |
148.8 |
64.7 |
17.2 |
297.9 |
404.6 |
0.0 |
0.0 |
|
M S MLD |
14.5 |
148.3 |
100.7 |
2.1 |
101.6 |
181.6 |
0.0 |
0.0 |
|
TOTAL |
62.7 |
482.4 |
422.7 |
20.5 |
619.9 |
1,217.1 |
0.0 |
0.0 |
|
COTTON |
|
THOUSAND RUNNING BALES |
||||||
|
UPLAND |
72.6 |
4,841.0 |
7,789.8 |
150.5 |
4,018.0 |
3,204.4 |
0.0 |
1,203.1 |
|
PIMA |
3.3 |
62.1 |
225.2 |
6.3 |
61.1 |
154.0 |
0.0 |
1.1 |
This summary is based on reports from exporters for the period December 30, 2022 – January 5, 2023.
Wheat: Net sales of 90,800 metric tons (MT) for 2022/2023 were up 93 percent from the previous week, but down 73 percent from the prior 4-week average. Increases primarily for China (66,000 MT, including 65,000 MT switched from unknown destinations), the Philippines (23,200 MT, including decreases of 22,000 MT), Italy (18,900 MT), South Africa (7,700 MT, including 8,000 MT switched from unknown destinations and decreases of 300 MT), and Panama (6,000 MT), were offset by reductions for unknown destinations (43,000 MT) and Thailand (3,600 MT). Total net sales of 1,500 MT for 2023/2024 were for Panama. Exports of 193,600 MT were up noticeably from the previous week, but down 15 percent from the prior 4-week average. The destinations were primarily to China (66,000 MT), the Philippines (35,200 MT), Japan (26,200 MT), Mexico (24,500 MT), and Italy (18,900 MT).
Corn: Net sales of 255,700 MT for 2022/2023 were down 20 percent from the previous week and 62 percent from the prior 4-week average. Increases primarily for Mexico (223,500 MT, including decreases of 4,800 MT), China (138,600 MT, including 136,000 MT switched from unknown destinations and decreases of 800 MT), Canada (33,400 MT), Nicaragua (6,100 MT), and Taiwan (5,200 MT, including 1,000 MT switched from Hong Kong and decreases of 300 MT), were offset by reductions for unknown destinations (110,600 MT), Honduras (42,500 MT), and Hong Kong (1,000 MT). Total net sales of 22,400 MT for 2023/2024 were for Mexico. Exports of 387,100 MT were down 49 percent from the previous week and 53 percent from the prior 4-week average. The destinations were primarily to Mexico (213,700 MT), China (138,600 MT), Canada (23,100 MT), Jamaica (4,700 MT), and Taiwan (4,200 MT).
Barley: No net sales were reported for the week. Exports of 300 MT were unchanged from the previous week and up 25 percent from the prior 4-week average. The destination was Japan.
Sorghum: No net sales were reported for the week. Exports of 200 MT–a marketing-year low– were down 82 percent from the previous week and 98 percent from the prior 4-week average. The destination was to Mexico.
Rice: Net sales of 62,700 MT for 2022/2023 were up noticeably from the previous week and 29 percent from the prior 4-week average. Increases were primarily for South Korea (34,100 MT), Haiti (13,400 MT, including deceases of 3,600 MT), Jordan (8,000 MT), Honduras (5,100 MT), and Mexico (900 MT). Exports of 20,500 MT were down 59 percent from the previous week and 44 percent from the prior 4-week average. The destinations were primarily to Haiti (15,100 MT), Mexico (2,200 MT), Canada (1,500 MT), Saudi Arabia (500 MT), and South Korea (400 MT).
Soybeans: Net sales of 717,400 MT for 2022/2023 were down 1 percent from the previous week and 41 percent from the prior 4-week average. Increases primarily for China (676,600 MT, including 372,000 MT switched from unknown destinations, 52,000 MT switched from Pakistan, and decreases of 10,800 MT), Germany (142,600 MT), Mexico (100,400 MT, including decreases of 1,800 MT), Bangladesh (57,200 MT, including 55,000 MT switched from unknown destinations), and Spain (46,900 MT, including 41,000 MT switched from unknown destinations), were offset by reductions primarily for unknown destinations (348,800 MT). Total net sales of 66,000 MT for 2023/2024 were for Pakistan. Exports of 1,620,700 MT were up 10 percent from the previous week, but down 7 percent from the prior 4-week average. The destinations were primarily to China (1,134,800 MT), Germany (142,600 MT), Mexico (66,700 MT), Bangladesh (57,200 MT), and Spain (46,900 MT).
Optional Origin Sales: For 2022/2023, the current outstanding balance of 300 MT, all South Korea.
Export for Own Account: For 2022/2023, the current exports for own account outstanding balance is 1,500 MT, all Canada.
Export Adjustments: Accumulated exports of soybeans to the Netherlands were adjusted down 142,556 MT for week ending December 22nd. The correct destination for this shipment is Germany.
Soybean Cake and Meal: Net sales of 3,300 MT for 2022/2023–a marketing-year low–were down 96 percent from the previous week and 99 percent from the prior 4-week average. Increases primarily for France (64,700 MT, including 60,000 MT switched from unknown destinations), Venezuela (11,000 MT switched from unknown destinations), Honduras (7,100 MT), Vietnam (5,000 MT), and the Philippines (4,000 MT, including decreases of 500 MT), were offset by reductions primarily for unknown destinations (80,000 MT), Ecuador (6,800 MT), Costa Rica (6,500 MT), and Morocco (6,000 MT). Exports of 314,500 MT were up 43 percent from the previous week and 34 percent from the prior 4-week average. The destinations were primarily to France (64,700 MT), the Philippines (50,000 MT), Mexico (32,400 MT), Japan (27,700 MT), and Burma (27,500 MT).
Soybean Oil: Net sales of 600 MT for 2022/2023 were up 74 percent from the previous week, but down 61 percent from the prior 4-week average. Increases were reported for Canada (400 MT) and Mexico (200 MT). Exports of 600 MT were up 14 percent from the previous week, but down 66 percent from the prior 4-week average. The destinations were to Canada (400 MT) and Mexico (200 MT).
Cotton: Net sales of 72,600 RB for 2022/2023 were up 83 percent from the previous week and up noticeably from the prior 4-week average. Increases primarily for Turkey (19,600 RB), China (16,400 RB), Vietnam (11,800 RB, including 200 RB switched from Japan and decreases of 400 RB), Pakistan (9,200 RB), Indonesia (6,900 RB, including 100 RB switched from Japan), were offset by reductions for Peru (1,400 RB). Exports of 150,500 RB were up 61 percent from the previous week and 24 percent from the prior 4-week average. The destinations were primarily to Pakistan (45,100 RB), China (44,200 RB), Vietnam (11,400 RB), Mexico (10,900 RB), and Bangladesh (8,600 RB). Net sales of Pima totaling 3,300 RB for 2022/2023 were down noticeably from the previous week, but up 78 percent from the prior 4-week average. Increases were reported for Vietnam (1,800 RB), China (1,100 RB), and India (400 RB). Exports of 6,300 RB were up 85 percent from the previous week and 28 percent from the prior 4-week average. The destinations were primarily to Turkey (2,900 RB), Vietnam (1,300 RB), Egypt (700 RB), India (400 RB), and China (400 RB).
Optional Origin Sales: For 2022/2023, the current outstanding balance of 9,300 RB, all Malaysia.
Export for Own Account: For 2022/2023, new exports for own account totaling 1,800 RB were to China. Exports for own account totaling 700 RB to Vietnam were applied to new or outstanding sales. The current exports for own account outstanding balance of 120,400 RB are for China (90,100 RB), Vietnam (21,900 RB), Pakistan (6,500 RB), India (1,500 RB), and Indonesia (400 RB).
Hides and Skins: Net sales for the 2023 marketing year, which began January 1st, totaled 329,000 pieces, primarily for China (209,300 whole cattle hides, including decreases of 30,600 pieces), South Korea (79,200 whole cattle hides, including decreases of 300 pieces), Mexico (18,900 whole cattle hides, including decreases of 7,500 pieces), and Turkey (18,900 whole cattle hides), were offset by reductions for Italy (1,900 pieces) and Indonesia (100 pieces). Net sales of 400 calf skins resulted in increases for China (1,800 calf skins, including decreases of 2,500 calf skins), were offset by reductions for Italy (1,400 calf skins). In addition, total net sales reductions of 200 kips skins were for China. Net sales reductions of 1,500 pieces, net sales of 5,600 calf skins, and total net sales of 2,300 kip skins were carried over from the 2022 marketing year, which ended December 31st. Exports for the period ending December 31st of 179,500 pieces brought accumulated exports to 22,214,900 pieces, up 11 percent from the prior year’s total of 20,003,400 pieces. The destinations were primarily to China (120,200 pieces), South Korea (25,800 pieces), and Thailand (8,800 pieces). Exports of 7,500 calf skins were to Italy (5,700 calf skins) and China (1,800 calf skins). In addition, total exports of 1,000 kip skins were to China.
Net sales for 2023 marketing year, which began January 1st, totaled 94,900 wet blues primarily for Hong Kong (35,000 unsplit), China (20,800 unsplit), Vietnam (9,600 unsplit), Thailand (9,000 unsplit), and Italy (7,800 unsplit, including decreases of 200 unsplit). Net sales reductions of 100 unsplit were carried over from the 2022 marketing year which ended on December 31st. Exports for the period ending December 31st of 20,200 wet blues brought accumulated exports to 7,125,200 wet blues, up 3 percent prior year total of 6,929,900 wet blues. The primary destinations were primarily to Italy (4,500 unsplit), Hong Kong (4,000 unsplit), India (2,900 unsplit), Vietnam (2,300 unsplit), and Thailand (2,000 unsplit). Net sales of splits totaling 180,500 pounds for 2023 marketing year for Vietnam (187,400 pounds, including decreases of 5,900 pounds), were offset by reductions for Hong Kong (6,900 pounds). Accumulated exports of splits in 2022 totaled 18,600,500 pounds, down 5 percent from the prior year’s total of 19,559,400 pounds. Exports of 36,500 pounds were to Vietnam.
Beef: Net sales for 2023 marketing year, which began January 1st, totaled 13,300 MT primarily for Japan (4,800 MT, including decreases of 600 MT), China (3,400 MT, including decreases of 100 MT), South Korea (1,700 MT, including decreases of 700 MT), Mexico (900 MT, including decreases of 100 MT), and Taiwan (700 MT, including decreases of 100 MT), were offset by reductions for Chile (100 MT). Net sales of 600 MT were carried over from the 2022 marketing year, which ended December 31st. Exports for the period ending December 31st of 4,300 MT brought accumulated exports to 942,000 MT, up 2 percent from the prior year total of 925,100 MT. The primary destinations were to South Korea (1,300 MT), Japan (1,200 MT), China (500 MT), Mexico (400 MT), and Taiwan (200 MT).
Pork: Net sales for 2023 marketing year, which began January 1st, totaled 13,100 MT were primarily for Mexico (4,700 MT, including decreases of 300 MT), Japan (3,500 MT, including decreases of 400 MT), South Korea (1,400 MT, including decreases of 700 MT), Canada (800 MT, including decreases of 400 MT), and the Dominican Republic (600 MT, including decreases of 100 MT). Net sales of 4,000 MT were carried over from the 2022 marketing year, which ended December 31st. Exports of the period ending December 31st of 9,700 MT brought accumulated exports to 1,502,900 MT, down 16 percent from the prior year total of 1,791,700 MT. The primarily destinations were to Mexico (6,000 MT), Japan (1,300 MT), South Korea (600 MT), China (500 MT), and Canada (400 MT).
Terry Reilly
Senior Commodity Analyst – Grain and Oilseeds
Futures International
One Lincoln Center
18 W 140 Butterfield Rd.
Oakbrook Terrace, Il. 60181
W: 312.604.1366
ICE IM: treilly1
Skype: fi.treilly

Trading of futures, options, swaps and other derivatives is risky and is not suitable for all persons. All of these investment products are leveraged, and you can lose more than your initial deposit. Each investment product is offered only to and from jurisdictions where solicitation and sale are lawful, and in accordance with applicable laws and regulations in such jurisdiction. The information provided here should not be relied upon as a substitute for independent research before making your investment decisions. Futures International, LLC is merely providing this information for your general information and the information does not take into account any particular individual’s investment objectives, financial situation, or needs. All investors should obtain advice based on their unique situation before making any investment decision. The contents of this communication and any attachments are for informational purposes only and under no circumstances should they be construed as an offer to buy or sell, or a solicitation to buy or sell any future, option, swap or other derivative. The sources for the information and any opinions in this communication are believed to be reliable, but Futures International, LLC does not warrant or guarantee the accuracy of such information or opinions. Futures International, LLC and its principals and employees may take positions different from any positions described in this communication. Past results are not necessarily indicative of future results.
