PDF Attached
USDA
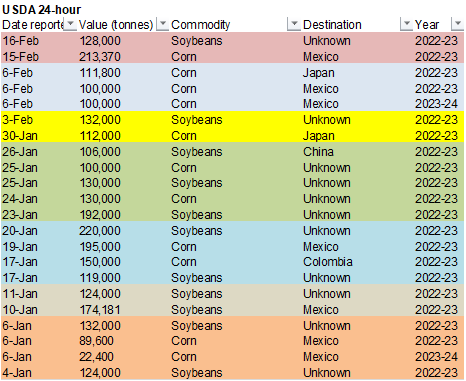
reported private exporters reported sales of 128,000 metric tons of soybeans for delivery to unknown destinations during the 2022-23 marketing year.
Soybeans
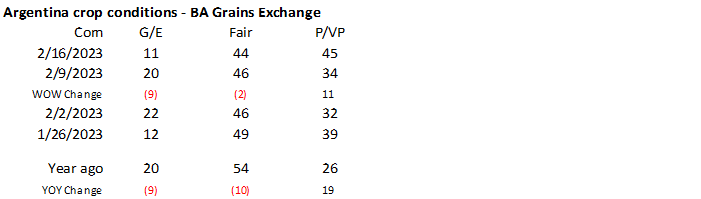
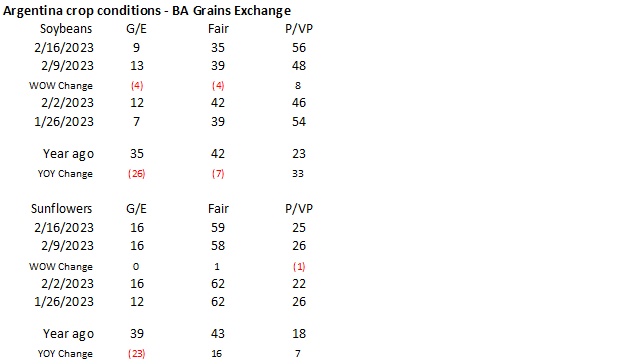
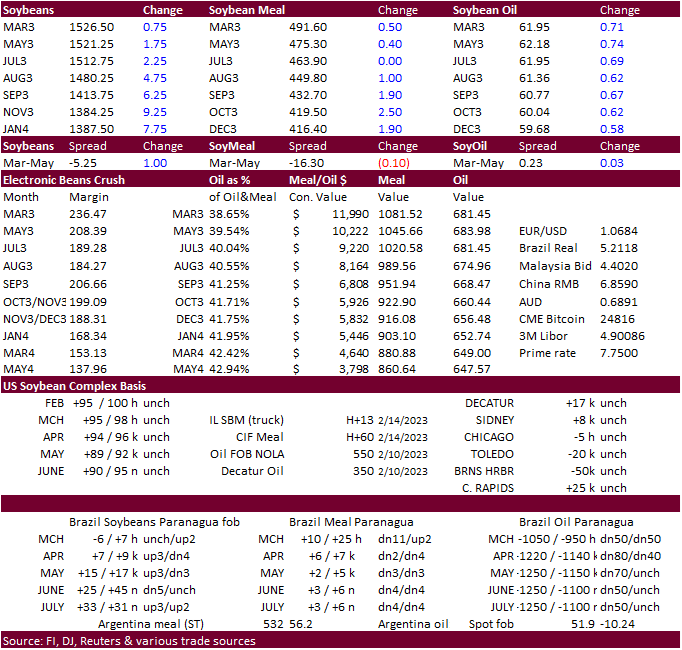
and soybean meal started lower but ended higher after fund selling dried. Lack of direction was noted. Argentina came out with crop conditions during the session and both soybeans and corn declined from the previous week. Soybean oil was strong from higher
WTI crude oil earlier but even after energy prices broke, gains were maintained from oil/meal spreading. Corn traded most of the session lower before settling mixed. Wheat was lower in Chicago and high protein wheat ended higher.
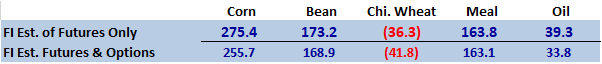
Estimate
of fund positions
Weather
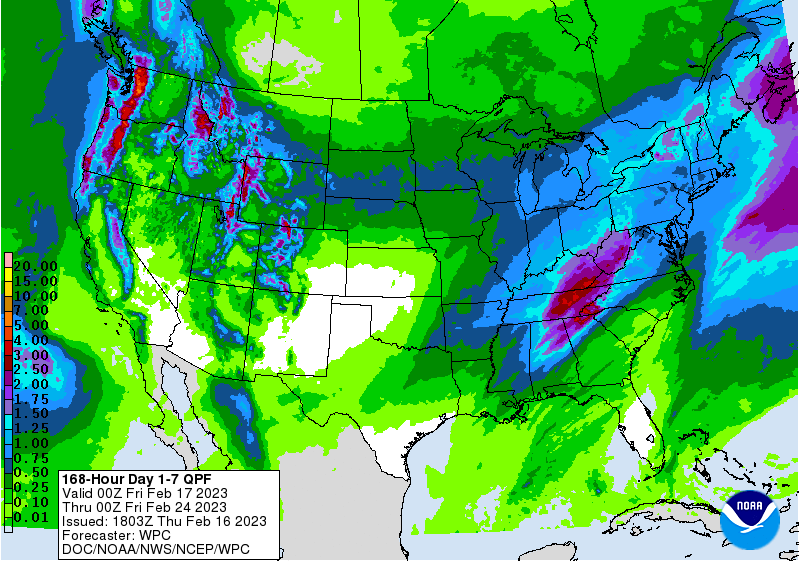
WORLD
WEATHER HIGHLIGHTS FOR FEBRUARY 16, 2023
·
Central Argentina’s best potential rain event is today and early Friday
o
Rain has already evolved in a part of Cordoba and in a few neighboring areas of southern and western Santa Fe overnight and additional rain is expected today
·
Most of Argentina’s greatest rain during the next ten days will be in western and northern crop areas as predicted earlier this week
o
Beneficial rain is expected in the north, but not in Buenos Aires, La Pampa, southern Cordoba, southern Santa Fe or portions of Entre Rios
·
No changes were noted in Brazil’s weather overnight
·
U.S. weather is expected to trend cooler as late February arrives, but the cold will first accumulate in the north-central states and in Canada where readings may be bitterly cold by this time next week
·
Europe and Asia temperatures are still advertised warm during the next ten days
·
High pressure ridge building in the south-central and southeastern United States over the next ten days will heat up those areas while periods of rain lighten up for a while especially in the southeastern states
·
Florida, southern Georgia and South Carolina will be dry for a while
·
West Texas and the Texas Coastal Bend will not get much rain for a while and the planting season is quickly approaching
·
Snow has fallen in the central U.S. Plains overnight with up to 7 inches noted in western Kansas and eastern Colorado
·
Another round of snow is likely in the northern Plains and upper U.S. Midwest during mid-week next week as cold air seeps southward from Canada
·
U.S. Tennessee River Basin will be wettest for the next ten days
·
New waves of rain and mountain snow are expected in California during the last week of this month
·
Portions of Western Europe will trend wetter in the second week of the two week forecast
o
Eastern Europe will be wettest into the weekend while Western Europe is dry
·
No change in the dry India forecast was noted overnight
·
No change for China, Australia or South Africa as well
Source:
World Weather and FI
Thursday,
Feb. 16:
- International
Grains Council’s monthly report - USDA
weekly net- export sales for corn, soybeans, wheat, cotton, pork and beef, 8:30am - Port
of Rouen data on French grain exports - Russia
Grain Conference, Sochi
- Suspended
– CFTC commitments of traders weekly report on positions for various US futures and options
- ICE
Futures Europe weekly commitments of traders report - CFTC
commitments of traders weekly report on positions for various US futures and options, 3:30pm - FranceAgriMer’s
weekly crop conditions reports
Monday,
Feb. 20:
- MARS
monthly report on EU crop conditions - Malaysia’s
Feb. 1-20 palm oil export data - HOLIDAY:
US, Argentina
Tuesday,
Feb. 21:
- National
Farmers’ Union Conference, Birmingham, UK, day 1 - Grain
Forum Dubai 2023, day 1 - New
Zealand global dairy trade auction - USDA
export inspections – corn, soybeans, wheat, 11am - EU
weekly grain, oilseed import and export data - HOLIDAY:
Argentina, Bangladesh
Wednesday,
Feb. 22:
- National
Farmers’ Union Conference, Birmingham, day 2 - Grain
Forum Dubai 2023, day 2 - USDA
total milk production, 3pm - US
poultry slaughter, 3pm
Thursday,
Feb. 23:
- USDA’s
acreage and closing stockpile outlook for corn, soy, wheat and cotton - EIA
weekly US ethanol inventories, production, 10:30am - Port
of Rouen data on French grain exports - Sugar
production and cane crush data from Brazil’s Unica (tentative) - USDA
red meat production, 3pm - HOLIDAY:
Russia
Friday,
Feb. 24:
- USDA
weekly net-export sales for corn, soybeans, wheat, cotton, pork and beef, 8:30am - ICE
Futures Europe weekly commitments of traders report - CFTC
commitments of traders weekly report on positions for various US futures and options, 3:30pm - FranceAgriMer’s
weekly crop conditions reports - US
cattle on feed, 3pm - US
cold storage data for beef, pork and poultry, 3pm
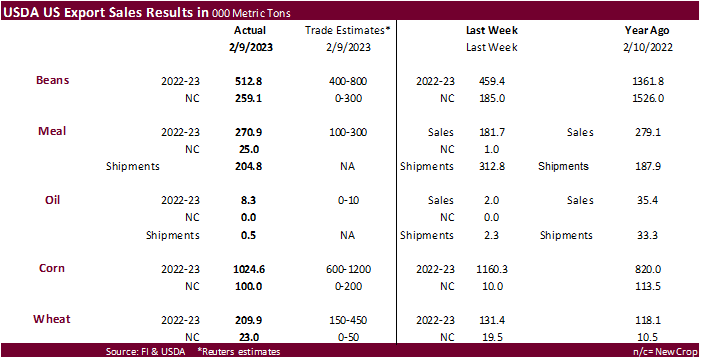
USDA
Export Sales
USDA
export sales improved from the previous week on a combined crop year basis for all the major commodities. Soybean meal shipments slowed from the previous week but were still above 200,000 tons.
Soybean
sales included China for 283,600 MT but 252,000 MT was switched from unknown destinations and 51,300 MT switched from Pakistan. New-crop soybean sales include China for 189,000 MT and unknown destinations of 66,000 MMT. Soybean meal sales of 270,900 tons
were ok. Soybean oil sales of 8,300 tons were highest since October 13 but cumulative crop-year sales are lowest in more than a couple decades. Corn sales slowed to 1.025 million tons old crop but were near the higher end of a range of expectations. China
bought 126,000 tons of corn. Other countries included Mexico and unknown destinations. There were 209,900 tons of 2022-23 of all wheat sales, lower end of expectations but above the previous week.
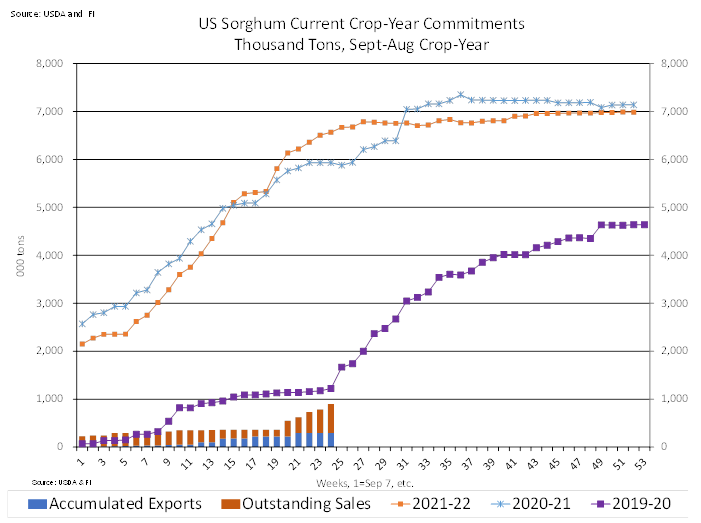
Sorghum
sales were 113,000 tons, all for China.
Pork
sales were a robust 45,000 tons and included Mexico, Japan, South Korea and China as top buyers.
U.S.
GENERATED 522
MLN BIODIESEL (D4) BLENDING CREDITS IN JANUARY, VS 585 MLN IN DECEMBER -EPA
U.S.
GENERATED 1.22 BLN ETHANOL (D6) BLENDING CREDITS IN JANUARY, VS 1.21 BLN IN DECEMBER -EPA
Year
Ago
U.S.
GENERATED 355
MLN BIODIESEL (D4) BLENDING CREDITS IN JANUARY, VS 584 MLN IN DECEMBER -EPA
U.S.
GENERATED 1.21 BLN ETHANOL (D6) BLENDING CREDITS IN JANUARY, VS 1.30 BLN IN DECEMBER -EPA
Macros
US
PPI Final Demand (M/M) Jan: 0.7% (est 0.4%; prevR -0.4%)
US
PPI Ex Food And Energy (M/M) Jan: 0.5% (est 0.3%; prev 0.1%)
US
PPI Final Demand (Y/Y) Jan: 6.0% (est 5.4%; prev 6.2%)
US
PPI Ex Food And Energy (Y/Y) Jan: 5.4% (est 4.9%; prev 5.5%)
US
Housing Starts Jan: 1309K (est 1355K; prevR 1371K)
US
Housing Starts (M/M) Jan: -4.5% (est -2.0%; prevR -3.4%)
US
Building Permits Jan: 1339K (est 1350K; prevR 1337K)
US
Building Permits (M/M) Jan: 0.1% (est 1.0%; prevR -1.0%)
US
Initial Jobless Claims Feb 11: 194K (est 200K; prevR 195K)
US
Continuing Claims Feb 4: 1696K (est 1688K; prevR 1680K)
Philadelphia
Fed Prices Paid Index February 26.5 VS January 24.5
Philadelphia
Fed New Orders Index February -13.6 VS January -10.9
Philadelphia
Fed Employment Index February 5.1 VS January 10.9
Philadelphia
Fed Six-Month Business Conditions February 1.7 VS January 4.9
Philadelphia
Fed Six-Month Capital Expenditures Outlook February 7.5 VS January 10.5
US
Philadelphia Fed Business Outlook Feb: -24.3 (est -7.4; prev -8.9)
US
EIA NatGas Storage Change (BCF) 10-Feb: -100 (est -108; prev -217)
–
Salt Dome Cavern NatGas Stocks (BCF): -9 (prev -26)
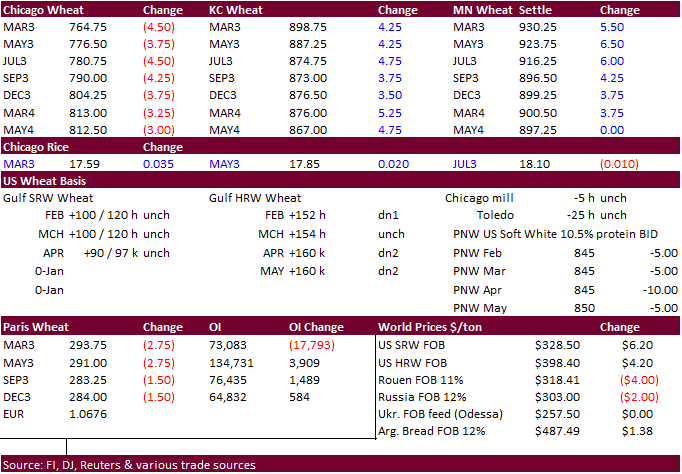
Corn
·
CBOT corn futures
traded lower through much of the day session until prices rallied early afternoon to close mixed. Bull spreading initially limiting losses for the March and May contracts. By close, March was down 0.25 cent, May up 1.0 cent, July up 0.75 and September down
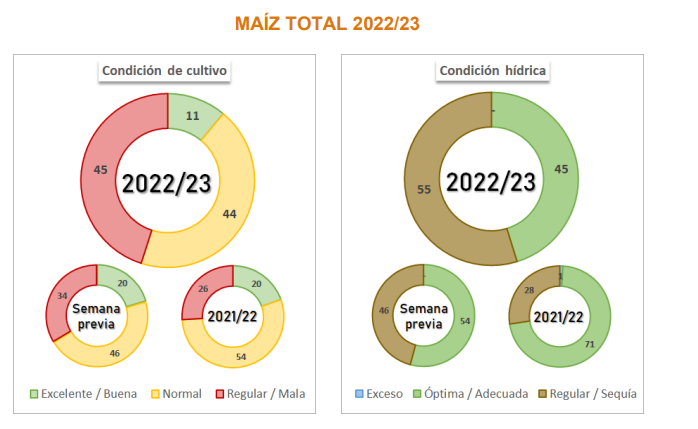
1.50. Argentina corn crop conditions declined from the previous week. Back month soybeans gain on corn. Currently the average “insurance” gage for February to date Nov/Dec futures favors corn plantings over soybeans, in our opinion, looking at the SX/CZ ratio,
against the previous 5-years for this time of year. CH remained above its 200-day MA of $6.7350.
·
Funds sold an estimated net 1,000 corn contracts.
·
Although USDA export sales of sorghum are improving as China buys from the US, crop year commitments are still low. Look for no change in sorghum crop year exports by USDA in its March S&D update.
·
China may scale back on 2023 corn plantings by 1 percent as they switch to soybeans and use higher variety GMO seeds.
·
IGC lowered their estimate for the 2022-23 global corn production by 8 million tons to 1.153 billion tons. They mainly cut Argentina and US output.
·
Yesterday USDA released its February 2023 baseline tables
https://www.usda.gov/oce/commodity-markets/baseline
·
Next week (Feb 24) USDA NASS will issue 2023-24 US S&D and selected world (exports, etc.) projections. This report may have some impact on new-crop futures prices.
https://www.usda.gov/oce/ag-outlook-forum
·
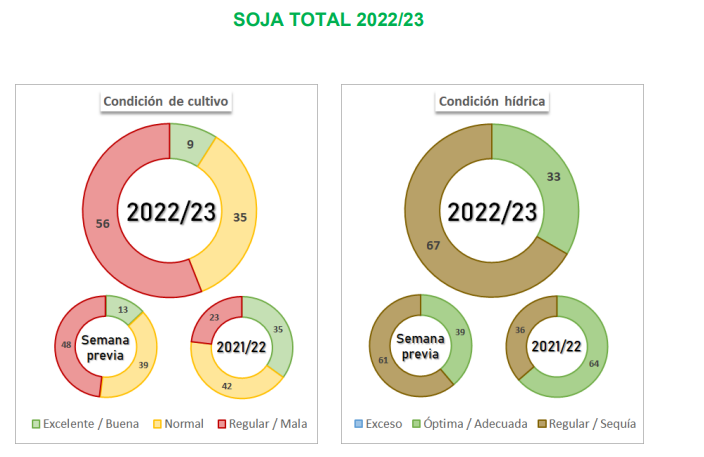
Guatemala reported a H5N1 bird flu outbreak in wild birds. Yesterday Argentina reported they detected its first case of bird flu in wild birds and declared a health emergency.
·
Both Argentina corn and soybean condition slipped from the previous week.
Export
developments.
-
None
reported
Updated
02/13/23
March
corn $6.55-$6.95 range. May
$6.25-$7.00
·
CBOT soybeans and meal started lower from follow through selling until fund selling dried. Lack of direction kicked around both markets during the second half of the session. Argentina came out with crop conditions, lower from
the previous week. This gave some longs an opportunity to reenter the market. Soybean oil was steady to higher earlier and gained over meal on follow through fund buying. Even as WTI crude oil weakened, soybean oil prices held their ground and settled sharply
higher.
·
Funds bought an estimated net 2,000 soybeans, 1,000 soybean oil and 2,000 soybean oil.
·
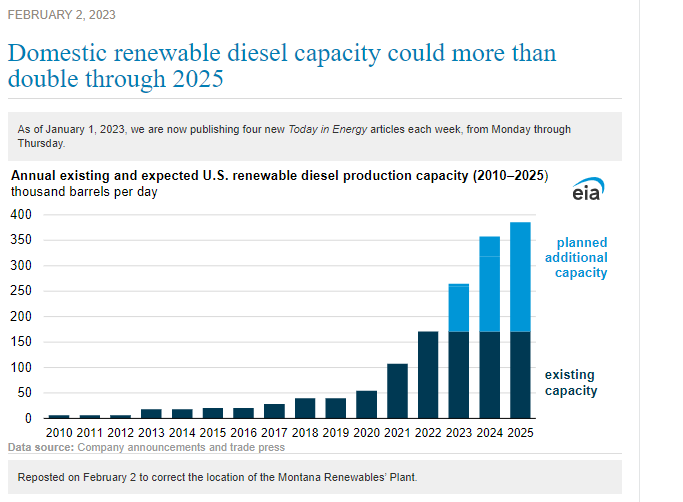
US RIN generation for the month of January for “biodiesel,” which should include renewable production, increased to 522 million from 355 million a year earlier. Note November use of feedstock for renewable fuels was greater than
traditional biodiesel production. Consumption of renewable biodiesel has also been gaining ground on biodiesel since the beginning of LH 2022. This is long term bullish SBO futures as exports declined to multi decade lows in order to meet the rapidly increasing
demand for domestic industrial consumption. https://www.eia.gov/totalenergy/data/monthly/pdf/sec10.pdf
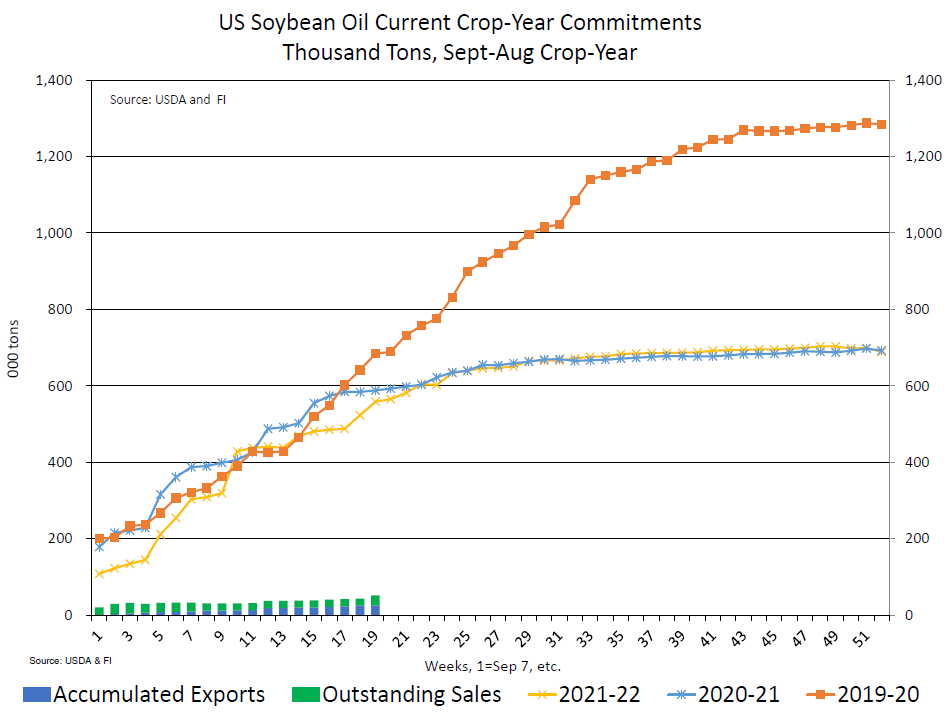
S&D
update on soybean oil. We
lowered our US soybean oil export estimate to 600 million pounds from 800 million pounds previously. It could end up lower than 600. At 115 million pounds of total commitments for this time of year, that is a poor pace to be optimistic about. USDA is
at 700 million pounds for 2022-23 crop year exports. Our import estimate is lowered 100 to 500 and food use increased 100 to 14.250 billion pounds. We are still working on our US soybean S&D balances, and they should be out over the next day or so.
U
of I: Biodiesel and Renewable Diesel: It’s All About the Policy
Gerveni,
M., T. Hubbs and S. Irwin. “Biodiesel and Renewable Diesel: It’s All About the Policy.”
farmdoc
daily
(13):27, Department of Agricultural and Consumer Economics, University of Illinois at Urbana-Champaign, February 15, 2023.
·
CBOT march delivery prospects are dimming after 495 registrations have been cancelled from February 9th through February to just 302 contracts. SBO registrations are 467 and meal zero. Chicago, KC and MN wheat & rice
might be the only two major ag products to see deliveries at the end of this month.
·
Traders are waiting to see if China buys additional new-crop Brazil soybean cargoes as the harvest advances. There is some chatter delays in Brazilian shipments could shift business to the US over the short term.
·
USDA reported 128,000 tons of soybeans were sold to unknown destinations.
·
AgRural estimated the Brazil soybean crop production at 150.9 million tons versus 152.9 million tons previous. RGDS was noted as of the problem areas from persistent drought. That area may see some rain this week.
·
China’s Sinograin seeks 10,875 tons of domestic 2022 crop year soybeans on February 17.
·
India plans to “blacklist” some renewable energy companies from government contracts for 3 to 5 years if they don’t meet project guidelines.
·
Cargo surveyor SGS reported Malaysia February 1-15 palm oil shipments at 449,703 tons, down 0.9% from 453,771 tons during the January 1-15 period. Palm oil prices rallied by most during the regular session in nearly three weeks
from a weaker ringgit and higher outside related markets.
·
The BA Grains exchange warned soybean production of current 38 million tons will likely be soon cut due to the heatwave over the past week. They also mentioned an upcoming cold snap bringing frosts to growing areas in the south
could hurt crops.
Export
Developments
·
USDA reported private exporters reported sales of 128,000 metric tons of soybeans for delivery to unknown destinations during the 2022-23 marketing year.
Updated
02/13/23
Soybeans
– March $14.85-$15.50, May $14.75-$16.00
Soybean
meal – March $450-$515, May $425-$500
Soybean
oil – March
58.50-63.00, May 58-70
·
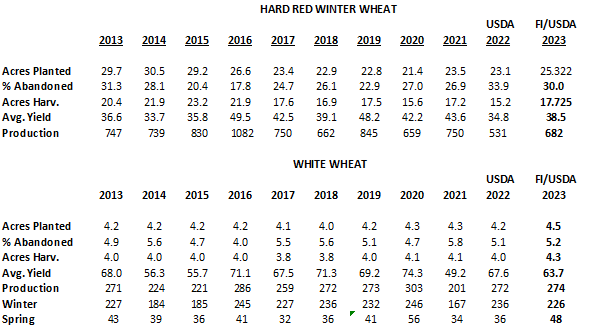
Chicago wheat futures traded and settled lower. KC and MN finished higher after the US drought monitor failed to show a good improvement for Great Plains winter wheat growing areas. We slightly reduced our 2023 winter wheat by
class yield for hard and white type wheat.
·
Funds sold an estimated net 3,000 Chicago wheat contracts.
·
Fighting escalated in eastern Ukraine over the last 24 hours.
·
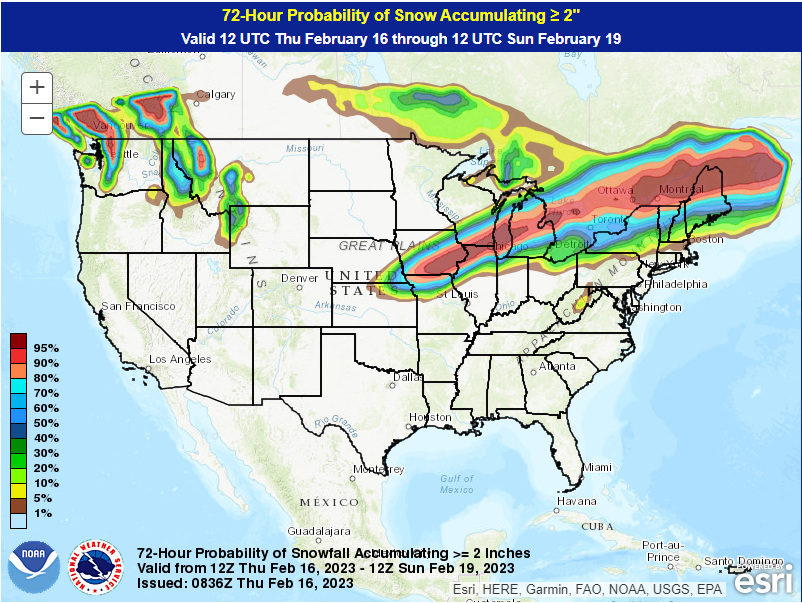
Some snow is expected to fall across the US east-central Great Plains over the next 24 hours.
·
IGC maintained its 2022-23 world wheat crop production at 796 million tons from the previous month.
·
Paris May wheat was down 2.75 euros or 0.9% to 291.00 per ton.
Export
Developments.
·
Thailand bought 60,000 tons of Black Sea feed wheat at around $329/ton c&f for July shipment.
·
Tunisia seeks 100,000 tons of soft wheat and 75,000 tons of feed barley on February 17, optional origin, for March 1-30 shipment.
·
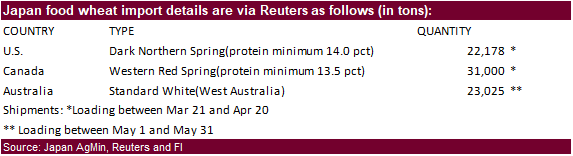
Japan’s AgMin bought 76,203 tons of food wheat from the US, Canada and Australia, later this week for March 21-May 31 loading.
·
Russia donated 25,000 tons of wheat to Cuba. The two countries have been allies for decades.
·
Jordan’s state grain buyer seeks up to 120,000 tons of optional origin milling wheat on Feb. 21 for shipment between June 1-15, June 16-30, July 1-15 and July 16-31.
·
Jordan’s state grain buyer seeks up to 120,000 tons of optional origin feed barley on Feb. 22 for shipment between June 1-15, June 16-30, July 1-15 and July 16-31.
Rice/Other
·
(Reuters) Thailand’s 5% broken rice prices were quoted at $460 – $465 per ton, down from last week’s $480 – $490. Vietnam’s 5% broken rice were offered at $455-$460 per ton on Thursday, unchanged from a week ago.
Updated
02/10/23
Chicago
– March $7.50 to $8.10, May $7.00-$8.25
KC
– March $8.55-$9.20, $7.50-$9.25
MN
– March $9.00 to $9.60,
$8.00-$10.00
USDA
Export Sales Highlights
This
summary is based on reports from exporters for the period February 3-9, 2023.
Wheat:
Net sales of 209,800 metric tons (MT) for 2022/2023 were up 60 percent from the previous week, but down 32 percent from the prior 4-week average. Increases primarily for Taiwan (39,500 MT), Japan (35,600 MT), Nigeria (33,000 MT, including 30,000 MT switched
from unknown destinations), Mexico (22,600 MT, including decreases of 900 MT), and Venezuela (17,000 MT, including 25,000 MT switched from unknown destinations and decreases of 8,000 MT), were offset by reductions for Egypt (500 MT) and Burma (300 MT). Total
net sales of 23,000 MT for 2023/2024 were for Guatemala. Exports of 500,100 MT were down 7 percent from the previous week, but up 25 percent from the prior 4-week average. The destinations were primarily to Japan (117,900 MT), Vietnam (64,000 MT), Mexico (63,800
MT), Egypt (59,500 MT), and the Philippines (58,400 MT).
Corn:
Net sales of 1,024,500 MT for 2022/2023 were down 12 percent from the previous week and 15 percent from the prior 4-week average. Increases were primarily for Mexico (269,000 MT, including decreases of 21,800 MT), unknown destinations (247,300 MT), China (126,000
MT), Colombia (115,400 MT, including decreases of 1,500 MT), and Saudi Arabia (73,500 MT, including 70,000 MT switched from unknown destinations). Total net sales of 100,000 MT for 2023/2024 were for Mexico. Exports of 670,500 MT were up 70 percent from the
previous week and 2 percent from the prior 4-week average. The destinations were primarily to Mexico (386,000 MT), Saudi Arabia (73,500 MT), Guatemala (41,000 MT), El Salvador (35,800 MT), and Japan (35,600 MT). Optional Origin Sales: For 2022/2023, the
current outstanding balance of 100,000 MT, all South Korea.
Barley:
No net sales or exports were reported for the week.
Sorghum:
Net sales of 113,000 MT for 2022/2023 were up noticeably from the previous week and up 7 percent from the prior 4-week average. The destination was for China. Exports of 1,000 MT were up noticeably from the previous week, but down 95 percent from the prior
4-week average. The destination was to Mexico.
Rice:
Net sales of 59,400 MT for 2022/2023 were down 47 percent from the previous week, but up 36 percent from the prior 4-week average. Increases were primarily for Mexico (51,200 MT), Guatemala (5,000 MT), El Salvador (1,500 MT, including 1,200 MT switched from
Guatemala), Saudi Arabia (800 MT), and Canada (300 MT, including decreases of 700 MT). Exports of 61,700 MT were up 82 percent from the previous week and 56 percent from the prior 4-week average. The destinations were primarily to Mexico (25,100 MT), Honduras
(19,200 MT), Guatemala (10,000 MT), Canada (2,800 MT), and El Salvador (2,600 MT).
Soybeans:
Net sales of 512,800 MT for 2022/2023 were up 37 percent from the previous week, but down 35 percent from the prior 4-week average. Increases primarily for China (283,600 MT, including 252,000 MT switched from unknown destinations, 51,300 MT switched from
Pakistan, and decreases of 72,900 MT), Mexico (198,100 MT, including 47,500 MT switched from unknown destinations and decreases of 1,000 MT), Germany (153,500 MT), the Netherlands (131,900 MT, including 134,000 MT switched from unknown destinations and decreases
of 8,300 MT), and Spain (130,000 MT, including 119,000 MT switched from unknown destinations), were offset by reductions for unknown destinations (509,000 MT) and Pakistan (121,000 MT). Net sales of 259,100 MT for 2023/2024 were reported for China (189,000
MT), unknown destinations (66,000 MT), Taiwan (3,000 MT), and Canada (1,100 MT). Exports of 1,903,200 MT were up 9 percent from the previous week, but unchanged from the prior 4-week average. The destinations were primarily to China (1,107,300 MT), Germany
(153,500 MT), the Netherlands (131,900 MT), Spain (130,000 MT), and Mexico (114,000 MT). Optional Origin Sales: For 2022/2023, the current outstanding balance of 300 MT, all South Korea. Export for Own Account: For 2022/2023, new exports for own account
totaling 100 MT were to Taiwan. The current exports for own account outstanding balance of 1,600 MT are for Canada (1,500 MT) and Taiwan (100 MT). Export Adjustments: Accumulated exports of soybeans to the Netherlands were adjusted
down 67,997 MT for week ending January 26th and 85,551 MT for week ending February 2nd. The correct destination for these shipments is Germany.
Soybean
Cake and Meal: Net sales of 270,900 MT for 2022/2023 were up 49 percent from the previous week and 7 percent from the prior 4-week average. Increases primarily for the Philippines (56,200 MT), Vietnam (50,000 MT), Colombia (40,100 MT), Ireland (37,000 MT),
and Ecuador (32,400 MT, including decreases of 23,400 MT), were offset by reductions primarily for Canada (2,000 MT) and unknown destinations (1,900 MT). Total net sales of 25,000 MT for 2023/2024 were for Ireland. Exports of 204,800 MT were down 35 percent
from the previous week and 31 percent from the prior 4-week average. The destinations were primarily to the Philippines (51,400 MT), Ecuador (32,400 MT), Guatemala (27,400 MT), Mexico (18,000 MT), and Canada (12,800 MT).
Soybean
Oil: Net sales of 8,300 MT for 2022/2023 were up noticeably from the previous week and from the prior 4-week average. Increases were reported for Colombia (5,000 MT) and Canada (3,300 MT, including decreases of 100 MT). Exports of 500 MT were down 79 percent
from the previous week and 66 percent from the prior 4-week average. The destinations were to Canada (400 MT) and Mexico (100 MT).
Cotton:
Net sales of 216,900 RB for 2022/2023 were down 18 percent from the previous week, but up 1 percent from the prior 4-week average. Increases primarily for Vietnam (67,700 RB, including 3,100 RB switched for China and 1,100 RB switched from South Korea), China
(61,600 RB, including 8,800 RB switched from Vietnam), Pakistan (23,200 RB), Bangladesh (17,000 RB), and South Korea (15,500 RB, including 4,900 RB switched from Vietnam and decreases of 1,800 RB), were offset by reductions for Peru (1,000 RB) and Ecuador
(200 RB). Net sales of 23,900 RB for 2023/2024 were reported for Portugal (22,000 RB) and Thailand (1,900 RB). Exports of 186,400 RB were down 11 percent from the previous week and 5 percent from the prior 4-week average. The destinations were primarily to
Pakistan (47,900 RB), China (45,900 RB), Vietnam (19,200 RB), Turkey (15,800 RB), and Mexico (11,100 RB). Net sales of Pima totaling 2,000 RB for 2022/2023 were up 54 percent from the previous week, but down 5 percent from the prior 4-week average. Increases
reported for Vietnam (900 RB), China (900 RB), Pakistan (400 RB), and Thailand (400 RB), were offset by reductions for Italy (600 RB). Exports of 6,900 RB were up 19 percent from the previous week and 26 percent from the prior 4-week average. The destinations
were primarily to Vietnam (2,800 RB), India (2,600 RB), Thailand (600 RB), Pakistan (400 RB), and Bangladesh (400 RB). Optional Origin Sales: For 2022/2023, the current outstanding balance of 9,300 RB, all Malaysia.
Export
for Own Account: For 2022/2023, new exports for own account totaling 16,200 RB were to China (13,800 RB) and Vietnam (2,400 RB). Exports for own account totaling 35,800 RB to China (34,000 RB), Vietnam (1,200 RB), and Turkey (600 RB) were applied to new or
outstanding sales. The current exports for own account outstanding balance of 98,000 RB are for China (63,700 RB), Vietnam (20,600 RB), Pakistan (5,000 RB), Turkey (4,800 RB), South Korea (2,400 RB), and India (1,500 RB).
Net
sales of 99,000 wet blues for 2023 were up 8 percent from the previous week, but down 7 percent from the prior 4-week average. Increases were primarily for Thailand (47,200 unsplit), China (18,800 unsplit), Vietnam (9,700 unsplit and 8,000 grain splits), Taiwan
(5,100 unsplit), and Italy (4,600 unsplit, including decreases of 100 pieces). Exports of 148,900 wet blues were up 19 percent from the previous week and 23 percent from the prior 4-week average. The destinations were primarily to Italy (65,100 unsplit and
3,800 grain splits), China (35,100 unsplit), Vietnam (20,700 unsplit), Thailand (12,400 unsplit), and Hong Kong (6,800 unsplit). Net sales of 7,800 splits were reported for Vietnam (4,400 pounds, including decreases of 900 pounds), Hong Kong (2,000 pounds,
including decreases of 300 pounds), South Korea (800 pounds), and Taiwan (600 pounds). Exports of 323,500 pounds were to Vietnam (160,300 pounds), Taiwan (82,600 pounds), and Hong Kong (80,600 pounds).
Beef:
Net sales of 28,100 MT for 2023 were up 72 percent from the previous week and 34 percent from the prior 4-week average. Increases were primarily for Japan (8,600 MT, including decreases of 500 MT), South Korea (6,800 MT, including decreases of 500 MT), China
(6,100 MT, including decreases of 100 MT), Mexico (2,200 MT, including decreases of 100 MT), and Hong Kong (1,000 MT, including decreases of 200 MT). Exports of 16,700 MT were up 8 percent from the previous week and 2 percent from the prior 4-week average.
The destinations were primarily to South Korea (4,300 MT), Japan (4,300 MT), China (3,100 MT), Mexico (1,700 MT), and Taiwan (1,300 MT).
Pork:
Net sales of 45,000 MT for 2023 were up 56 percent from the previous week and 30 percent from the prior 4-week average. Increases primarily for Mexico (18,800 MT, including decreases of 200 MT), Japan (11,500 MT, including decreases of 100 MT), South Korea
(4,400 MT, including decreases of 700 MT), China (4,100 MT, including decreases of 100 MT), and Colombia (1,200 MT), were offset by reductions for Nicaragua (100 MT). Exports of 30,500 MT were unchanged from the previous week, but down 4 percent from the prior
4-week average. The destinations were primarily to Mexico (13,400 MT), China (4,100 MT), Japan (3,500 MT), South Korea (2,600 MT), and Canada (2,300 MT).
U.S.
EXPORT SALES FOR WEEK ENDING 2/9/2023
|
|
CURRENT |
NEXT |
||||||
|
COMMODITY |
NET |
OUTSTANDING |
WEEKLY |
ACCUMULATED |
NET |
OUTSTANDING |
||
|
CURRENT |
YEAR AGO |
CURRENT |
YEAR AGO |
|||||
|
|
THOUSAND |
|||||||
|
WHEAT |
|
|
|
|
|
|
|
|
|
|
21.7 |
747.5 |
1,825.4 |
168.7 |
3,761.0 |
5,140.9 |
0.0 |
101.3 |
|
|
41.2 |
608.4 |
610.9 |
67.3 |
1,984.2 |
1,963.4 |
23.0 |
157.1 |
|
|
72.6 |
1,051.4 |
1,119.6 |
189.0 |
3,897.2 |
3,554.0 |
0.0 |
49.8 |
|
|
73.8 |
1,057.6 |
618.3 |
75.2 |
3,092.2 |
2,464.0 |
0.0 |
23.4 |
|
|
0.5 |
83.7 |
55.6 |
0.0 |
228.8 |
113.1 |
0.0 |
1.9 |
|
|
209.8 |
3,548.5 |
4,229.8 |
500.1 |
12,963.3 |
13,235.3 |
23.0 |
333.5 |
|
BARLEY |
0.0 |
4.4 |
13.8 |
0.0 |
7.2 |
14.7 |
0.0 |
0.0 |
|
CORN |
1,024.5 |
14,140.7 |
24,199.8 |
670.5 |
13,676.0 |
22,332.7 |
100.0 |
1,537.1 |
|
SORGHUM |
113.0 |
602.6 |
4,119.3 |
1.0 |
294.6 |
2,385.7 |
0.0 |
0.0 |
|
SOYBEANS |
512.8 |
8,923.5 |
9,311.7 |
1,903.2 |
39,166.6 |
38,765.3 |
259.1 |
1,162.1 |
|
SOY |
270.9 |
3,084.7 |
3,317.8 |
204.8 |
4,402.9 |
4,683.3 |
25.0 |
78.4 |
|
SOY |
8.3 |
26.0 |
171.5 |
0.5 |
25.6 |
351.5 |
0.0 |
0.6 |
|
RICE |
|
|
|
|
|
|
|
|
|
|
33.7 |
150.8 |
299.3 |
55.4 |
304.9 |
728.0 |
0.0 |
0.0 |
|
|
24.1 |
33.1 |
9.4 |
1.3 |
17.4 |
4.3 |
0.0 |
0.0 |
|
|
-0.1 |
3.8 |
19.9 |
0.7 |
12.4 |
29.1 |
0.0 |
0.0 |
|
|
0.1 |
35.8 |
45.1 |
0.1 |
8.5 |
40.4 |
0.0 |
0.0 |
|
|
0.5 |
142.1 |
76.2 |
2.1 |
352.8 |
483.6 |
0.0 |
0.0 |
|
|
1.0 |
130.2 |
179.2 |
2.0 |
144.3 |
217.8 |
0.0 |
0.0 |
|
|
59.4 |
495.7 |
629.2 |
61.7 |
840.3 |
1,503.2 |
0.0 |
0.0 |
|
COTTON |
|
THOUSAND |
||||||
|
UPLAND |
216.9 |
4,947.3 |
7,861.6 |
186.4 |
4,985.6 |
4,472.8 |
23.9 |
1,285.2 |
|
|
2.0 |
43.6 |
197.6 |
6.9 |
90.0 |
205.3 |
0.0 |
3.5 |
#non-promo