PDF Attached
Some
traders think the inflation story is starting to die down.
Increasing
Covid-19 cases across Europe prompted additional restrictions and warnings this week. This should be monitored over the weekend into the short trading week (Friday CBOT holiday) as it could influence outside commodity and equity markets if the situation worsens
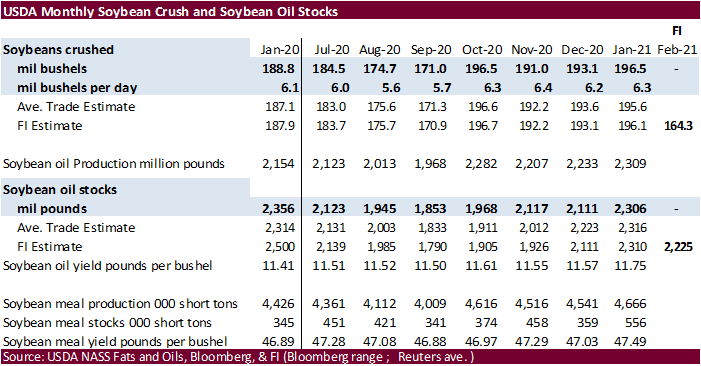
next week. Most EU countries will change clocks this weekend. Wednesday & Thursday will be heavy data driven days with USDA stocks and plantings Wednesday, EIA data that will add renewable fuel data (sometime Wed.), followed by NASS soybean crush on Thursday
and export sales. USDA’s official crop progress report (initial) looks like it will be released April 5 @ 3:00 pm, not this Monday. We will get selected state data this Monday.
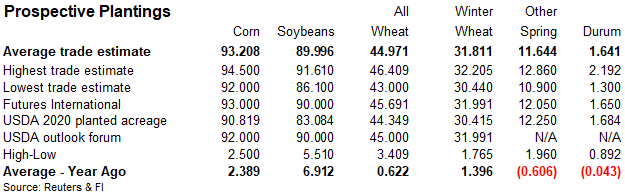
Bloomberg
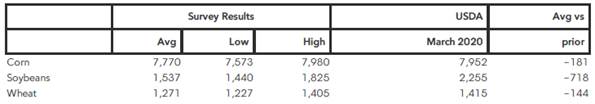
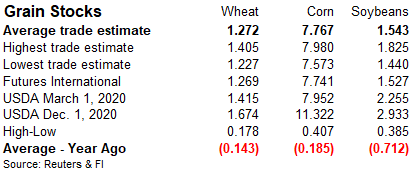
USDA survey results, US stocks & plantings (March 1 corn stocks avg changed to 7.77b from 7.75b due to an analyst correction).
Reuters
trade estimates (with corrections through 3/26 late)

South
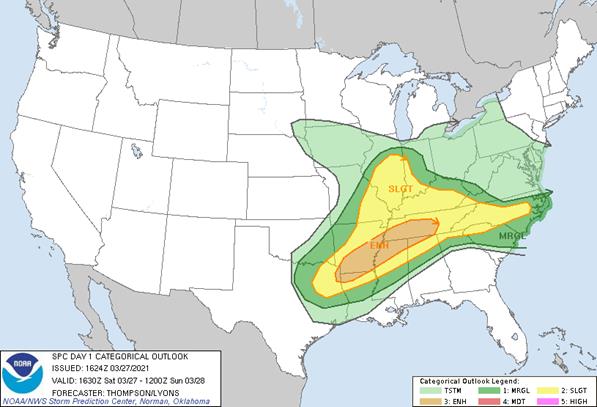
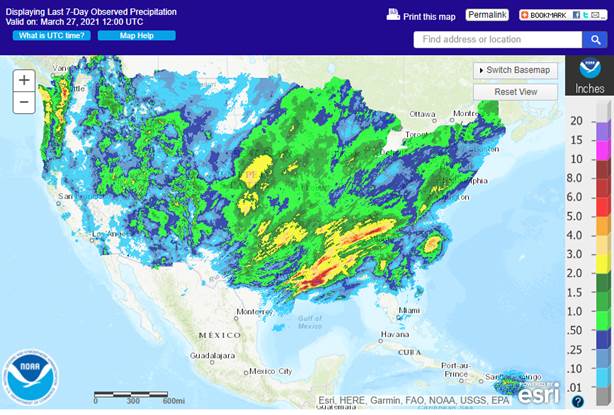
Dakota could see temps in the 80’s this weekend. Too much precipitation for the Delta that will slow fieldwork activity. Midwest will not start planting for a week or two so there is no concern there except for the Ten River Basin where too much rain will
occur. Severe weather for US yesterday and today will yield(ed) local heavy rain.
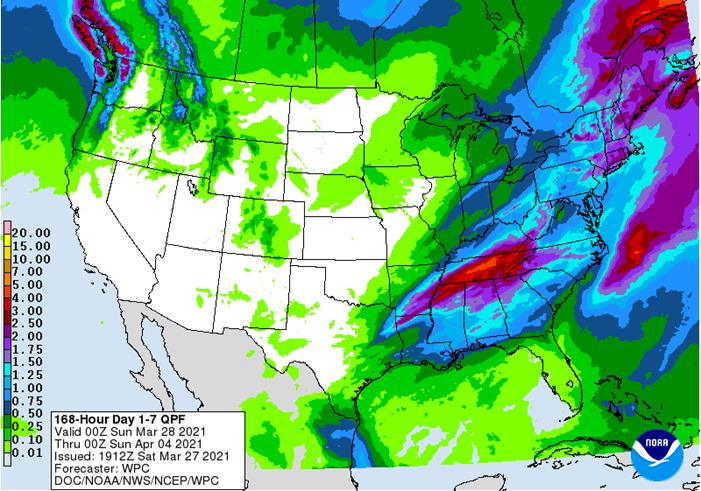
7-day
precipitation
World
Weather Inc.
NOT
MUCH CHANGE OVERNIGHT
- Argentina
rainfall overnight was widespread from northern La Pampa and northern and eastern parts of Buenos Aires into Santiago del Estero, southern Chaco and southern Corrientes
o
Amounts varied greatly with some locations receiving less than 0.25 inch while others reported 1.00 to 2.00 inches
- One
location along the east-central San Luis border with Cordoba reported more than 3.00 inches
o
The past two days of rain was welcome for a large part of the nation and lingering rain into Saturday will be most likely in the far south and east
o
Nearly a week of drying will follow and then scattered showers will resume again
o
The bottom line remains favorable for the majority of Argentina’s grain, oilseed, cotton and other crops, although there will be a few pockets of drier biased conditions
- Brazil’s
biggest issue is weather in the middle and latter part of April
o
Net drying is expected for the coming ten days in the heart of Safrinha corn country
- The
drier bias will be good initially so that harvesting of late soybeans can conclude along with the planting of Safrinha corn.
- Concern
is rising about late April precipitation and soil moisture, although crops will likely have sufficient subsoil moisture to get them through the month if only erratic rain falls - May
would be the more challenging month for late season cotton and corn in Brazil if rainfall in the second half of April is lighter and more sporadic than usual.
- U.S.
weather will trend colder during the early to middle part of the week next week from the northern Plains into the Delta and southeastern states; including most of the Midwest
o
Frost and freezes are expected, but most winter crops are not far enough advanced to be permanently harmed
o
Crops are most advanced in the Delta and southeastern states, but temperatures should stay above the permanent damage threshold relative for their development
o
A little rain will accompany the cold into the eastern United States, but after the precipitation falls and the cold air settles in there may be at least a week’s worth of net drying which should help promote planting progress
in many areas south of the Ohio River
- South
Texas may get some rain in the latter part of next week, but some of the moisture is a little overdone
o
Nevertheless 0.50 to 1.50 inches of moisture could benefit many crops in the region – especially the dryland crop of corn, sorghum and cotton
- West
Texas will receive very little precipitation over the next ten days
o
Showers and thunderstorms may evolve late in the first week of April and more likely in the second week, but confidence over the resulting rain being significant is very low
- Unusually
warm to hot temperatures, strong wind speeds and low humidity will impact the Great Plains briefly late this weekend into Monday just ahead of a colder airmass
o
The colder air will drop high temperatures in the northern Plains from the 70s and lower 80s down to the 30s and 40s and a little rain and snow mix will occur as the colder air arrives
- However,
no drought busting precipitation is expected
o
A second wave of unseasonably warm to hot weather is expected to evolve in the Great Plains and Canada’s Prairies late next week through April 5 before shifting to the east in the following week
o
Each of these shots of hot and dry weather will raise concern over soil moisture and spring planting potentials in the driest areas in the northern Plains and Canada’s Prairies
- U.S.
hard red winter wheat areas will also dry down during the next ten days, despite a little precipitation infrequently
o
Concern about returning dryness may become the market chatter in the first week of April
- Southwestern
U.S. weather will remain dry biased and mild through the next ten days supporting some fieldwork - U.S.
Pacific Northwest needs greater precipitation in the valleys especially the Yakima Valley into central Oregon where the ground is too dry for unirrigated winter crops - Mexico
drought remains serious and unlikely to change prior to the arrival of seasonal rainfall this summer - U.S.
northern Plains and Canada’s Prairies need significant rain and it will not likely come in great enough quantities anytime soon to make much difference
o
Today’s GFS model run suggested greater precipitation Sunday into Tuesday across the Prairies
o
Greater precipitation is expected in the second half of April
- India
weather will be almost ideal for crop maturation and harvesting in the next few weeks’ the nation may have lost a little production this year because of dryness during reproduction, but another big crop is expected - China
weather remains almost ideal for early season fieldwork and winter crop development in the Yellow River Basin, North China Plain and northeastern provinces, although warming is needed - China’s
Yangtze River Basin has been a little wet this month and drier and warmer weather is needed to induce better rapeseed and southern wheat conditions, but no significant loss in production potential has occurred - Yunnan,
China is still too dry and needs significant rain for its rice, corn and sugarcane - Australia’s
Queensland and New South Wales crop areas are moving into a drier biased weather pattern for the next ten days improving crop and field conditions after recent abundant rainfall - Severe
flooding in coastal areas of New South Wales, Australia is abating and the cleanup efforts are under way - Indonesia
and Malaysia weather has been and will continue to be good for all crops, although there is need for rain in northern parts of Peninsular Malaysia - Philippines
weather has been and will continue to be good for most of its crops - Mainland
Southeast Asia crop areas need a boost in precipitation to induce better early season planting conditions for corn and sugarcane development as well - Eastern
Ukraine into Kazakhstan will receive rain additional over the next few days and the moisture boost will be very good for future crop development
o
This precipitation began Wednesday and will linger into Saturday
- Much
of western and northern Russia is still snow bound and needs to experience additional melting and a bout of dry and warm weather to get the remaining snow to melt - Europe
weather is rated mostly very good, although cool conditions have delayed the greening of some crops
o
Warming is expected in this coming week
- Soil
moisture in Europe is rated favorably with some drying in Spain that will need to be eased in April to ensure the best dryland crop conditions
o
additional drying is expected in much of the continent during the coming week to ten days – especially in the west
- North
Africa will be drying down in the coming week to ten days; recent rain has been good for early season wheat and barley development, although northwestern Algeria and southwestern Morocco are still too dry - West-central
Africa coffee and cocoa weather has been very good recently and that is not likely to change much for a while; some rice and sugarcane has benefited from the pattern as well
o
Rain fell from Benin to Ghana Wednesday and early today lifting soil moisture in many coffee and cocoa production areas
- This
event will move to the west into Ivory Coast today - East-central
Africa rainfall has been erratic recently and a boost in precipitation should come to Ethiopia in April while Tanzania begins to dry down - South
Africa weather will continue favorably mixed for early maturing summer crops and the development of late season crops
- New
Zealand weather is expected to turn a little wetter in the coming week, but rain amounts will still be lighter than usual except along the west coast of South Island across portions of North Island where rain will be greatest - Southern
Oscillation Index this morning was -1.69 and the index is expected to rise additionally this weekend
Source:
World Weather inc.
Bloomberg
Ag Calendar
Sunday,
March 28
- Daylight
saving time begins in most of Europe, clocks move forward one hour
Monday,
March 29:
- Ivory
Coast cocoa arrivals - USDA
Export Inspections – corn, soybeans, wheat, 11am - EU
weekly grain, oilseed import and export data - U.S.
winter wheat condition, 4pm (selected states) - HOLIDAY:
India
Tuesday,
March 30:
- EARNINGS:
WH Group
Wednesday,
March 31:
- EIA
weekly U.S. ethanol inventories, production - USDA
stocks and prospective planting – corn, wheat, soy, barley, sorghum - EIA
monthly ethanol and biodiesel / renewable / biodiesel fuel reports - Malaysia’s
March palm oil export data - Unica
report on cane crush and sugar production in Brazil (tentative) - U.S.
agricultural prices paid, received, 3pm
Thursday,
April 1:
- USDA
weekly crop net-export sales for corn, soybeans, wheat, cotton, pork, beef, 8:30am - Port
of Rouen data on French grain exports - Australia
commodity index - U.S.
corn for ethanol, soybean crush, DDGS production, 3pm - HOLIDAY:
Mexico, Argentina and several other Latin American countries
Friday,
April 2:
- CFTC
commitments of traders weekly report on positions for various U.S. futures and options, 3:30pm - HOLIDAY:
Good Friday holiday across most of Europe, Africa, Americas and parts of Asia
Friday
night data
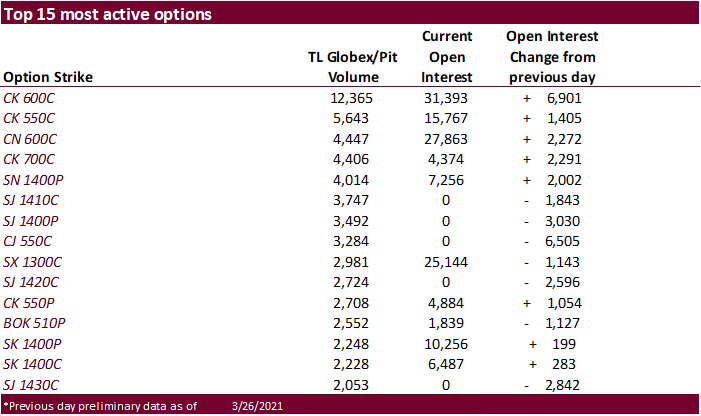
Option
volume – Friday
CFTC
Commitment of Traders
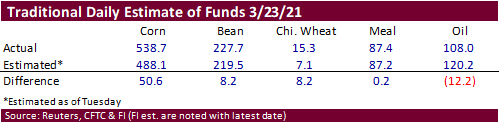
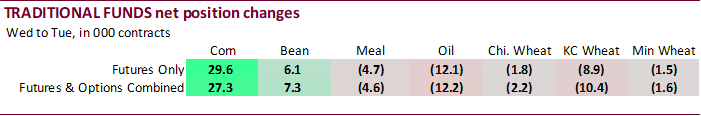
Traders
missed estimating the corn traditional net fund futures only position by a very large 50,600 contracts (509,100 versus 488,100 estimated). Funds were also more long than estimated for soybeans and wheat, and less short for SBO.


SUPPLEMENTAL
Non-Comm Indexes Comm
Net Chg Net Chg Net Chg
Corn
355,482 11,815 418,008 3,825 -749,296 -7,241
Soybeans
126,385 8,071 166,599 -1,686 -284,885 -3,210
Soyoil
61,209 -11,784 122,068 -955 -205,249 14,496
CBOT
wheat -20,773 -8,443 158,591 1,635 -126,703 7,621
KCBT
wheat 5,294 -7,960 66,551 -2,008 -70,341 12,425
=================================================================================
FUTURES
+ OPTS Managed Swaps Producer
Net Chg Net Chg Net Chg
Corn
388,175 17,275 242,955 -18,692 -722,807 -172
Soybeans
162,853 6,813 91,647 -1,090 -272,802 -2,997
Soymeal
57,620 -3,618 71,553 114 -178,996 2,851
Soyoil
93,977 -4,709 93,122 -695 -220,214 14,614
CBOT
wheat 8,160 -9,365 93,530 -3,494 -109,395 6,509
KCBT
wheat 26,242 -12,100 43,381 987 -63,270 11,817
MGEX
wheat 15,224 -659 4,937 311 -25,769 2,128
———- ———- ———- ———- ———- ———-
Total
wheat 49,626 -22,124 141,848 -2,196 -198,434 20,454
Live
cattle 79,555 -4,005 84,435 955 -167,942 5,157
Feeder
cattle 707 -1,720 7,455 197 -2,688 616
Lean
hogs 76,095 262 58,458 62 -141,607 298
Other NonReport Open
Net Chg Net Chg Interest Chg
Corn
115,870 9,987 -24,194 -8,398 2,341,060 -48,603
Soybeans
26,401 447 -8,098 -3,175 1,176,773 -2,738
Soymeal
18,238 -959 31,587 1,612 472,467 -4,600
Soyoil
11,143 -7,456 21,972 -1,756 615,294 10,316
CBOT
wheat 18,821 7,163 -11,116 -813 515,700 2,946
KCBT
wheat -4,849 1,751 -1,504 -2,455 238,843 6,596
MGEX
wheat 1,342 -958 4,266 -823 89,489 2,428
———- ———- ———- ———- ———- ———-
Total
wheat 15,314 7,956 -8,354 -4,091 844,032 11,970
Live
cattle 17,400 -2,815 -13,448 706 388,868 -3,230
Feeder
cattle 4,863 345 -10,337 561 54,837 644
Lean
hogs 15,093 -341 -8,038 -282 341,311 6,875
=================================================================================
FUTURES
ONLY Managed Swaps Producer
Net Chg Net Chg Net Chg
Corn
379,509 18,723 262,143 -20,686 -763,441 -1,947
Soybeans
151,572 6,370 90,775 -2,201 -306,769 -1,742
Soymeal
56,799 -3,657 71,307 -157 -186,067 3,331
Soyoil
92,176 -4,320 90,594 -948 -219,769 15,124
CBOT
wheat 2,718 -9,453 93,794 -3,878 -98,974 6,379
KCBT
wheat 26,071 -12,224 43,406 1,049 -67,032 10,243
MGEX
wheat 15,224 -659 4,937 320 -26,269 2,066
———- ———- ———- ———- ———- ———-
Total
wheat 44,013 -22,336 142,137 -2,509 -192,275 18,688
Live
cattle 75,177 -3,512 85,236 1,109 -154,752 5,383
Feeder
cattle 478 -1,429 7,444 225 -2,955 100
Lean
hogs 74,169 481 58,427 184 -130,875 1,110
Other NonReport Open
Net Chg Net Chg Interest Chg
Corn
159,191 10,893 -37,402 -6,983 1,747,316 -43,465
Soybeans
76,092 -237 -11,670 -2,190 853,452 -2,701
Soymeal
30,642 -1,083 27,319 1,566 408,654 -5,838
Soyoil
15,848 -7,808 21,151 -2,048 498,432 1,706
CBOT
wheat 12,538 7,653 -10,076 -701 420,748 1,627
KCBT
wheat -1,259 3,312 -1,186 -2,380 220,866 4,827
MGEX
wheat 2,174 -865 3,934 -862 85,389 2,368
———- ———- ———- ———- ———- ———-
Total
wheat 13,453 10,100 -7,328 -3,943 727,003 8,822
Live
cattle 3,453 -3,143 -9,114 163 335,893 -3,645
Feeder
cattle 3,175 696 -8,142 408 48,069 264
Lean
hogs 6,622 -957 -8,343 -818 275,026 3,712
Macro
US
Consumption Adjusted Real (M/M) Feb: -1% (est -0.7%, prevr 3.4%)
Personal
Consumption (M/M) Feb: -7.1% (est -7.3%, prevr 10.1%)
Core
PCE Price Index (M/M) Feb: 0.1% (est 0.1%, prevr 0.2%)
Core
PCE Price Index (Y/Y) Feb: 1.4% (est 1.5%, prev 1.5%)
PCE
Price Index (M/M) Feb: -1% (prev 0.3%)
PCE
Price Index (Y/Y) Feb: 1.6% (prevr 1.4%)
US
Adv Gods Trade Balance (Feb): -86.7Bln (prev -84.58Bln)
Wholesale
Inventories Adv (Feb): 0.5% (prevR 1.4%)
Retail
Inventories Ex-Auto Adv (Feb): 1.2% (prevR 0.2%)
University
Of Michigan Sentiment (MarF): 84.9 (est 83.6, prev 83)
Current
Conditions (MarF): 93 (est 93.1, prev 91.5)
Expectations
(MarF): 79.7 (est 78.8, prev 77.5)
1YR
Inflation (MarF): 3.1% (prev 3.1%)
5-10YR
Inflation (MarF): 2.8% (prev 2.7%)
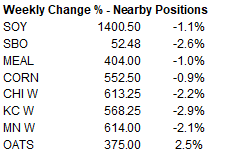
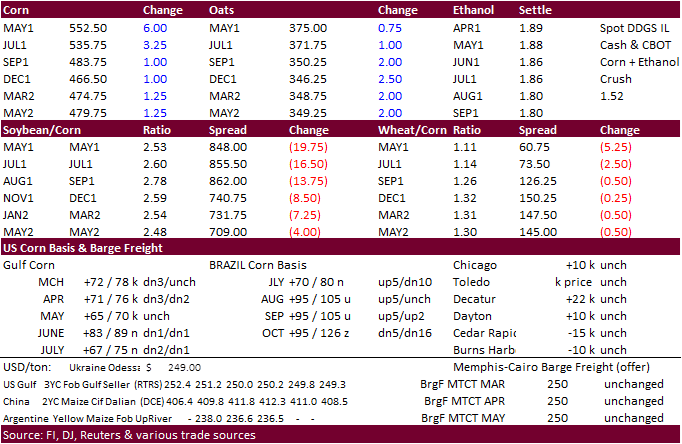
- Corn
ended the week down 0.9%. Oats were 2.5% higher. Funds
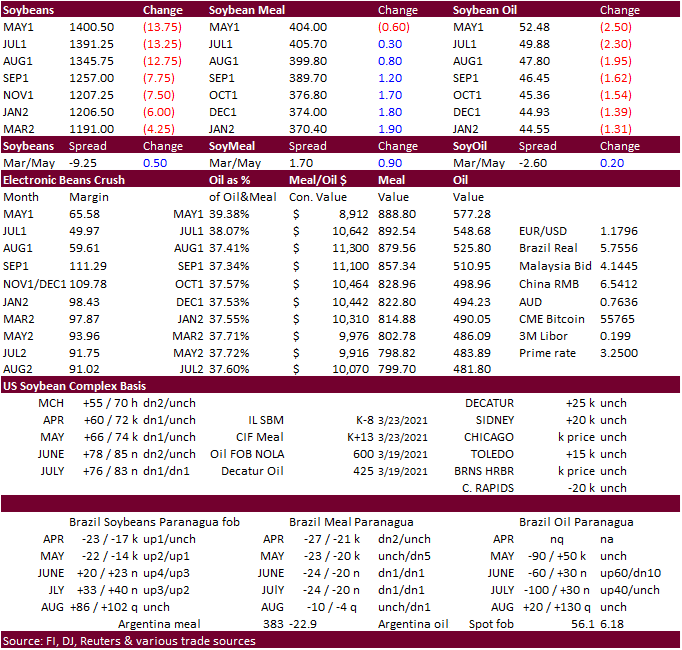
on Friday bought an estimated net 11,000 contracts. May
corn finished 6 cents higher at $5.5250/bu. Higher
WTI and a lower USD was limited early downside risk from a bearish USDA pig report. March 31 is USDA report day so expect traders to increase positioning Monday and Tuesday.
- CBOT
corn started mixed to lower from lack of bullish news but by late morning was up sharply led by the nearby on technical buying and firm basis values (Iowa). The March 1 US corn stocks estimates published by Reuters and Bloomberg yesterday got traders thinking
again about the US carryout for 2020-21. A 185 million decrease in the average trade guess from March 1, 2020 corn stocks, with half of the crop year done, and large US exports expected for the second part of the crop year, may suggest USDA is underestimating
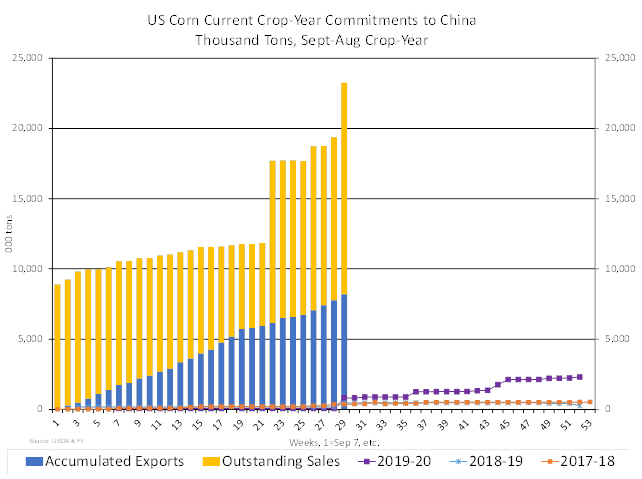
the carryout for 2020-21 by 100 to 150 million bushels. We look for large US corn export inspections on Monday as shipments to China and other countries increase, replacing waning soybean exports. Average weekly corn inspections should be higher during the
month of April based on the Great Lakes reopening shipping. Looking at total US corn commitments versus shipments, US corn exports should be very strong through end of August.
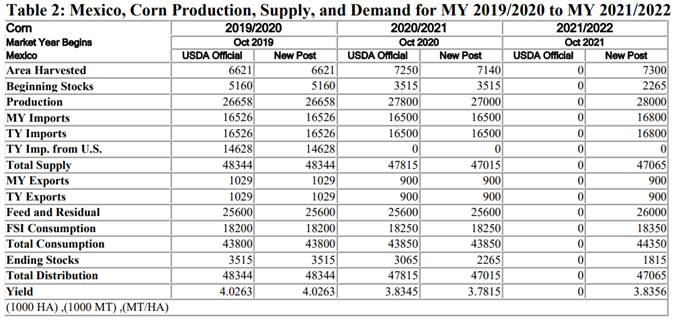
- USDA
Agriculture Secretary Tom Vilsack said Mexico still plans to ban imports of genetically modified (GMO) corn, but only for food consumption, not corn for feed. We are not sure the percentage of US white corn is GMO and need to explore this. Mexico imports
an extremely large amount of US yellow corn for feed. Banning imports of both varieties would have not made any sense as Mexico depends on GMO corn imports to meet consumption requirement. Mexico imported about 16.5 million tons of corn in 2020 with majority
US origin (14.628MMT in 2019-20 crop-year).
- South
Korean importers bought a large amount of wheat this week but on Friday passed on corn due to high prices.
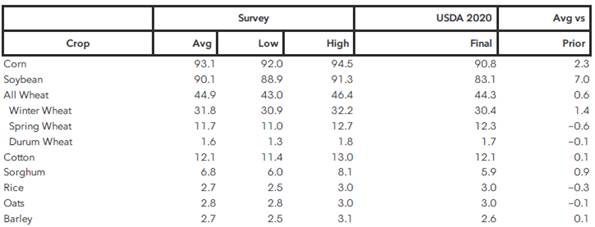
- Reuters
trade estimates for US corn plantings average 92.21 million acres, above USDA’s February estimate of 92.0 million and compares to 90.819 million year ago.
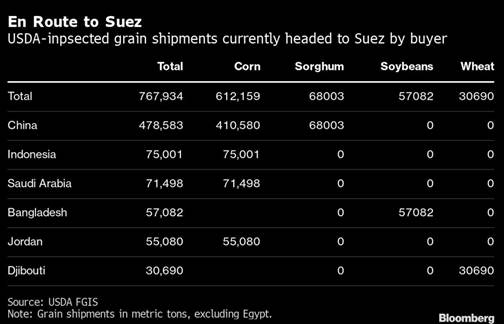
- The
container ship blocking passage in the Suez Canal may not be dislodged until at least Wednesday. A Bloomberg article suggested 7% of US seaborne grain exports could be affected, most of it corn.
Export
developments.
- South
Korea’s KOCOPIA group passed on 55,000 tons of corn due to high prices. Offers ranged from $306 & $313/ton C&F. It was for arrival around July 20.
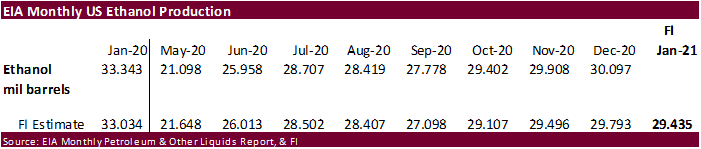
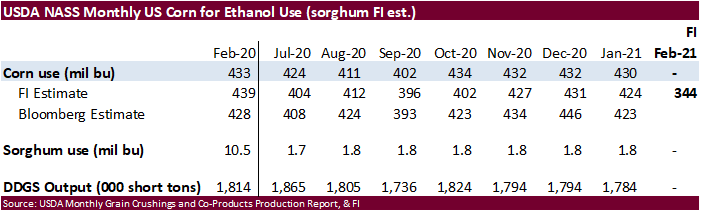
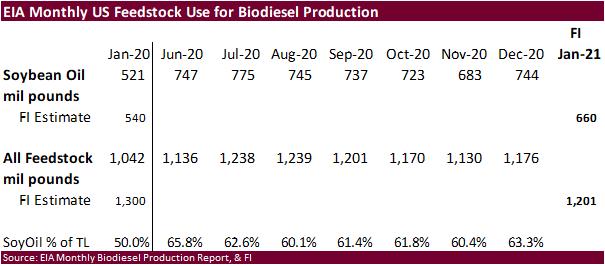
Monthly
Biofuels Capacity and Feedstocks Update (repeat
with link) The EIA (Energy Information Administration) will expand their biofuel data in its monthly report to by adding renewable fuels on March 31, including production capacities for biodiesel and feedstocks used in the production. It will be called Monthly
Biofuels Capacity and Feedstocks Update, replacing Monthly Biodiesel Production Report. USDA will adopt the data. Press release:
https://www.eia.gov/pressroom/releases/press477.php
Updated
3/24/21
May
corn is seen in a $5.35 and $5.55 range.
July
is seen in a $5.10 and $5.75 range.
December
corn is seen in a $3.85-$5.50 range.
- Soybean
futures fell 1.1% for the week, meal down 1.0% and SBO off 2.6%. - CBOT
soybean complex was mixed to start, and eventually nearby SBO touching limit lower for the second consecutive day (May settled 250 lower & July down 230 points). Note total soybean oil futures open interest fell only 806 contracts on Friday. May soybean meal
was off $0.60 and July up $0.30. May soybeans dropped 13.75 cents to $14.0050. Friday morning Gulf soybean oil was around 550 over and another source put US fob Gulf at $1344/ton, up about 2.4% from week earlier.
- Funds
on Friday sold an estimated net 16,000 soybean contracts bought 1,000 soybean meal and sold an estimated 14,000 soybean oil.
- Last
time SBO closed the 250 point limit lower amount prior to this week was 3/15/2011, and last time closed limit down for two consecutive days was 3/28/2008 (down 250) & 3/31/2008 (down 350). Volatility surged this week. Since 1961, there have 11 trading days
nearby SBO closed down 250 points. - Some
speculate the market was SBO overbought. Others noted technical selling and easing concerns over inflation. Regardless, SBO finally managed to divorce itself this week from fluctuations in WTI crude oil. May SBO traded and ended below its 20-day MA, a bearish
signal. The 50-day is at 48.33 (closed at 52.48 Friday). Longer term the renewable diesel story still stands, and the trade will get a glimpse of demand on Wednesday when EIA publishes initial capacity, production and use of the alternative green energy
product. Meal started lower on product spreading and a bearish USDA pigs report but turned around after SBO posted a lower trade. Soybeans followed SBO lower, but not by enough to support crush values that were destroyed by afternoon trading from the weakness
in SBO. CBOT May crush was down 14.75 cents to 66 cents, lowest since March 10th. It traded as high as 87 cents earlier this week.
- Global
cash and selected vegetable oil futures prices were lower from yesterday, but much of that movement was in response to lower SBO on Thursday. China and Malaysian vegetable oil markets will be in focus Sunday night. Rotterdam nearby soybean oil and rapeseed
oil fell about 10 euros per ton from late Thursday. Palm oil traded more than 4% lower and overnight reached a 3-month low on Friday.
China
Dalian’s most-active soyoil contract fell 5.5% and China palm oil fell 6.2%.
- Trade
estimates for US soybean plantings range from 86.1 to 91.6 million acres, wide in our opinion.
Reuters
trade estimates for US soybean plantings average 89.996 million acres, in line with USDA’s February estimate of 90 million and compares to 83.084 million year ago. Regardless of outcome, look for 2021-22 US soybean stocks to end up tight, like this year.
- During
the trade we heard a US animal unit end user company bought a smaller size Brazil soybean cargo this week, a rare move. It is not that uncommon for US companies to take a few corn cargoes from other countries time to time but for soybeans its uncommon and
a reminder stocks are expected to get very tight this summer. - EU
demand for Argentina SME increased this week. - Russia
plans to impose an export tax on sunflower oil for one year from Sept. 1 set at 70% of the difference between its indicative price per ton and $1,000. They will also impose an export tax on sunflower seeds between July 1, 2021 and Sept. 1, 2022 at 50% of
its price, but not less than $320 per ton. The duty for sunseeds is currently set in euro at a lower level, according to Reuters.
- A
Bloomberg survey on 2020-21 India palm oil imports showed traders looking for a 11 percent increase to around 8 million tons from previous season, while total edible vegetable oil consumption may end up unchanged. Higher soybean oil and sunflower oil prices
are thought to deter imports of those commodities, making India more dependent on palm oil.
- China
cash crush margins on our analysis were 168 (167 previous), vs. 175 cents late last week and compares to 184 cents year earlier.
Export
Developments
- None
reported.
Updated
3/25/21
May
soybeans are seen in a $13.75 and $14.75 range.
May
soymeal is seen in a $390 and $420 range.
May
soybean oil is seen in a 53 and 58 cent range
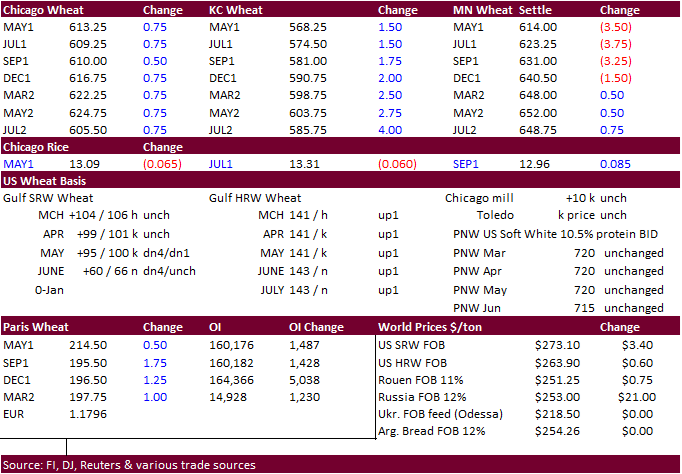
- Wheat
dropped four consecutive weeks. For the week Chicago was down 2.2%, KC 2.9% lower, and MN 2.1% lower for the week. US wheat futures trended lower overnight from ongoing talk of improving US winter wheat conditions and favorable weather for the Black Sea
and Australian crop areas but rebounded from technical buying. - Basis
eased for most US wheat grades from Thursday, - Funds
on Friday
bought
an estimated net 3,000 CBOT SRW wheat contracts. - French
soft wheat conditions as of March 22 were unchanged from the previous week at 87% good and excellent (62% year ago) – FranceAgriMer. Durum was unchanged at 83% form previous week and compares to 63% year ago. Initial spring barley conditions were very good
at 92% compared with 86% a year ago. - EU
May milling wheat was up 0.75 euros at 214.50 after trading a session low of 213.50. Support is seen at 210.50.
- Ukraine
grain exports via Econ Min – down 22.7% to 34.73 million tons so far this season, including 14.22 million tons of wheat, 15.83 million tons of corn and 4.1 million tons of barley.
Ukraine’s
economy ministry has slightly increased its forecast for Ukrainian barley exports to 4 million tons from 3.815 million a month earlier.
- Australian
hay exporters are having a tough time getting China to grant import permits, adding to a list of commodities that is caught up in the trade tensions. China consumes about 1 million tons of hay a year, with nearby a third coming from Australia. China overnight
also mentioned they will impose anti-dumping measures on some Australian wine imports from March 28 for five years. - But
the trade tensions between China and Australia have not impacted China wheat buying during the first two months of 2021. China imports of Australian wheat surged 479 percent from the year earlier period.
- Jordan
will be back in for feed barley on March 30. Possible shipment combinations are Oct. 1-15, Oct. 16-31, Nov. 1-15 and Nov. 16-30, the same periods as sought in the previous two tenders.
- Ethiopia
seeks 400,000 tons of optional origin milling wheat, on April 20, valid for 30 days. In January Ethiopia cancelled 600,000 tons of wheat from a November import tender because of contractual disagreements.
Rice/Other
·
Mauritius seeks 4,000 tons of optional origin long grain white rice on April 16 for delivery between June 1 and July 31.
·
Syria seeks 25,000 tons of white rice on March 29, from China or Egypt.
·
Syria seeks 39,400 tons of white rice on April 19. Origin and type might be White Chinese rice or Egyptian short grain rice.
·
Ethiopia seeks 170,000 tons of parboiled rice on April 20.
Updated
3/25/21
May
Chicago wheat is seen in a $6.00‐$6.60 range
May
KC wheat is seen in a $5.55‐$6.50 range
May
MN wheat is seen in a $6.05‐$6.40 range
Terry Reilly
Senior Commodity Analyst – Grain and Oilseeds
Futures International
One Lincoln Center
18 W 140 Butterfield Rd.
Oakbrook Terrace, Il. 60181
W: 312.604.1366
ICE IM:
treilly1
Skype: fi.treilly

Trading of futures, options, swaps and other derivatives is risky and is not suitable for all persons. All of these investment products are leveraged, and you can lose more than your initial deposit. Each investment product is offered
only to and from jurisdictions where solicitation and sale are lawful, and in accordance with applicable laws and regulations in such jurisdiction. The information provided here should not be relied upon as a substitute for independent research before making
your investment decisions. Futures International, LLC is merely providing this information for your general information and the information does not take into account any particular individual’s investment objectives, financial situation, or needs. All investors
should obtain advice based on their unique situation before making any investment decision. The contents of this communication and any attachments are for informational purposes only and under no circumstances should they be construed as an offer to buy or
sell, or a solicitation to buy or sell any future, option, swap or other derivative. The sources for the information and any opinions in this communication are believed to be reliable, but Futures International, LLC does not warrant or guarantee the accuracy
of such information or opinions. Futures International, LLC and its principals and employees may take positions different from any positions described in this communication. Past results are not necessarily indicative of future results.