PDF Attached
Choppy
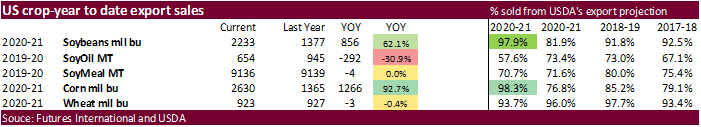
trade for the CBOT ags with most contracts ending higher (nearby cold sold off). NOPA reported a less than expected US soybean crush and a friendly SBO ending stocks given high production. USDA export sales were excellent for sorghum (656,700 tons, most
for China), ok for soybeans, disappointing for products, and below expectations for corn and wheat.
![]()
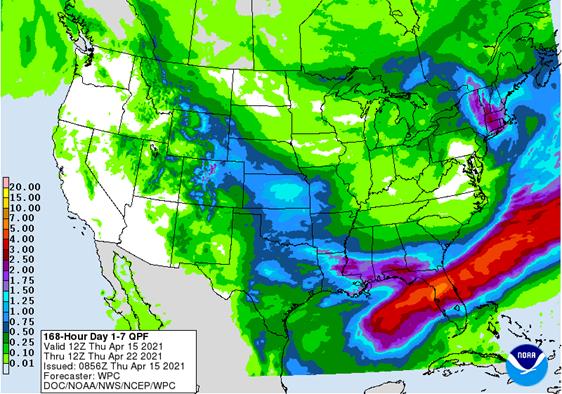
Next
7 days
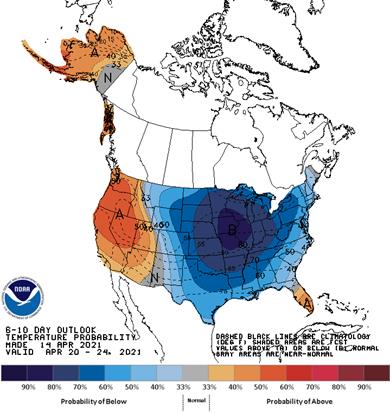
6-10
temps
World
Weather Inc.
MOST
IMPORTANT WEATHER ISSUES OF THE DAY
- Western
Europe will be drying down over the next ten days - Temperatures
will be cooler biased in most of Europe in the coming week, but will trend warmer in the second week leading to faster drying in the west - Eastern
Europe will experience mild temperatures and experience some periodic precipitation to maintain mostly favorable field conditions for a while - Western
CIS soil moisture is adequate to abundant and will increase with anticipated rain expected during the coming week to ten days - Russia’s
Southern Region as well as Ukraine will be favorably moist during the next ten days with a few areas getting a little too wet possibly - The
exception will be near the Caspian Sea where some dryness will linger - World
Weather, Inc. is seeing evidence of withdrawing summer monsoonal moisture from Brazil in the last week of April - Brazil’s
interior south will experience an erratic rainfall pattern for the next ten days leading to some pockets of ongoing net drying while other areas get just enough moisture to support crops favorably - Sugarcane
in Sao Paulo, Brazil has lost tonnage this year, but sucrose is likely higher than usual; the reduced tonnage could make the harvested crop smaller - Mato
Grosso and Goias Safrinha crops are expected to finish out April relatively well with timely rain, seasonable temperatures and mostly good soil conditions - Southern
Mato Grosso and southernmost Goias will be a little drier than areas farther to the north - Argentina
will continue to dry down for the next several days in the heart of the nation’s summer crop production region, but rain next week will reverse the process keeping harvest progress behind normal
- Drier
and warmer weather is needed over a longer period of time to get harvesting back on track - No
serious harm to crop quality is expected due to returning rain next week - U.S.
Midwest, northern Plains and Canada’s Prairies will experience less than usual precipitation in the coming ten days while temperatures are cooler than usual - Spring
planting of corn and other early crops will continue in the lower Midwest, Delta, Tennessee River Basin and interior southeastern states, despite the cooler bias - Soil
moisture is rated well in many areas, but drying down in the interior southeastern states - Recent
rainfall in central and northern Iowa, southern Minnesota and southwestern Wisconsin has been lighter than usual and no change will occur during the next ten days of below average precipitation and cool temperatures - Worry
will rise over this region when warming begins in late April if significant rain does not evolve
- NWS
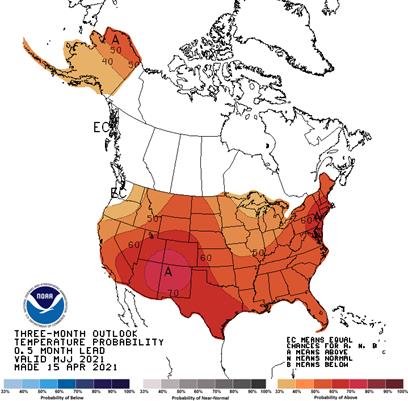
30-Day Outlook for the U.S. suggested warmer than usual weather for much of May except in the north-central states where equal chances for above, below and near normal temperatures were suggested - Precipitation
was advertised to be greater than usual over the majority of the Midwest while the southern Plains and southern Rocky Mountain region was advertised drier than usual - NWS
90-Day Outlook for the U.S. suggested warmer than usual weather for the entire nation’s agricultural region during the May through July period.
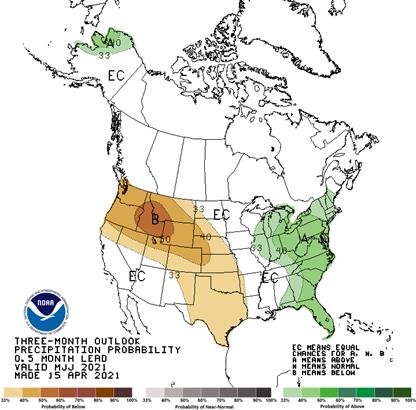
- Precipitation
was suggested to be above average in the Atlantic Coastal States and the eastern Midwest - Precipitation
was advertised below normal from the Pacific Northwest through the northern and central Rocky Mountain region to the western and southern Great Plains - Equal
chances for above, below and near normal precipitation was advertised for all other areas in the nation - U.S.
Pacific Northwest unirrigated small grains still need significant moisture to improve soil conditions and early season crop development - Net
drying will continue over the coming seven days, but “some” rain may evolve in the April 22-28 period - U.S.
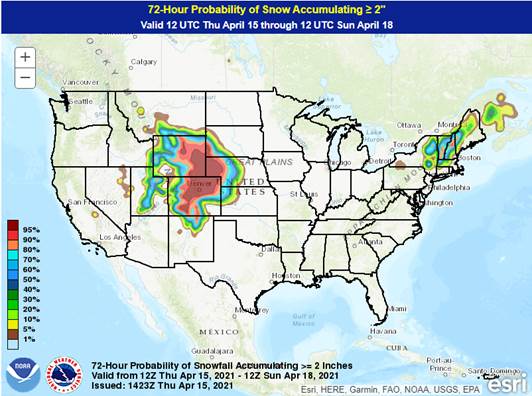
hard red winter wheat production areas will experience significant snow and rain today into Friday with a few lingering showers Saturday - Moisture
totals of 0.40 to 1.50 inches is expected from northeastern Colorado and southwestern Nebraska through the heart of Kansas with lighter rain in Texas and Oklahoma - Snow
accumulations will vary from 4 to 10 inches with northeastern Colorado and southwestern Nebraska getting 10-12 inches
- The
moisture will be ideal in raising topsoil moisture after recent drying conditions.
- U.S.
west-central high Plains livestock stress is expected because of heavy snow, cold rain and colder temperatures Thursday into Saturday morning - West
and South Texas have potential for a little rain today and again during mid- to late-week next week - The
moisture will be welcome, but not nearly enough for a lasting improvement in soil moisture in the areas that need it most - Temperatures
will be a little cooler than usual helping to conserve soil moisture in this first week of the outlook, but will trend warmer April 23-29 - California
and the southwestern states will be left mostly dry for a while - Tropical
Storm Surigae was located 106 miles east northeast of Palau Island in the western Pacific Ocean at 0900 GMT today - The
storm was expected to become a typhoon Friday as it moves over open water east of the Philippines
- The
system will become quite intense during the weekend, but its predicted movement should keep the center of the system east of the Philippines - Some
outer bands of precipitation may impact the eastern islands this weekend into next week
- A
close watch on the storm is warranted since its path has been drifting a little more to the west in recent forecast model runs - Negative
Phase of Pacific Decadal Oscillation (PDO) continues to evolve in the eastern Pacific Ocean with cooling ocean surface water temperatures occurring most significantly in the eastern Gulf of Alaska most recently - Cooler
than usual water is becoming more common in the eastern North Pacific and could influence North America weather this late spring and summer - China
crop weather will remain very good over the next two weeks, although net drying is expected in the North China Plain for a while - India’s
weather will be mostly good, although scattered showers will occur periodically to slow some of the winter harvest progress - Australia
will continue in a net drying mode for the next ten days supporting good harvest progress in the east while raising the need for moisture in most of the south for future winter wheat, barley and canola planting
- Mainland
areas of Southeast Asia will experience a net boost in precipitation over the next few weeks that will improve corn planting conditions and maintain an improving trend in sugarcane, rice and coffee production areas - Some
beneficial rain fell across parts of this region recently, but southern areas are still dry - Philippines
weather is good for most crops, but a boost in rainfall would be welcome - Indonesia
and Malaysia crop weather is expected to be mostly good for the next ten days to two weeks with most areas getting rain - North
Africa will experience a favorable mix of weather over the next ten days - All
of the moisture will be welcome, but resulting amounts may be a little erratic and light leaving need for more moisture in some areas - Northwestern
Algeria and southwestern Morocco need rain most - Temperatures
will be near to above average - West-central
Africa coffee and cocoa weather has been very good recently and that is not likely to change much for a while; some rice and sugarcane has benefited from the pattern as well - Rainfall
will be a little lighter and less frequent than usual over for a while longer, but improved rainfall should occur later this week and into the coming weekend
- Temperatures
have been and will continue to be warmer than usual keeping evaporation rates very strong until greater rain evolves - East-central
Africa rainfall has been erratic recently and a boost in precipitation should come to Ethiopia this month while Tanzania slowly begins to dry down - South
Africa weather will continue favorably for early maturing summer crops and the development of late season crops - Net
drying is expected for except in the southeast where some periodic showers will occur - Good
field progress is expected for early maturing crops - Temperatures
will be warmer than usual and that will dry out the soil relatively quickly - New
Zealand rainfall will be a little lighter than usual during the coming ten days, but still beneficial - Many
areas are still drier biased and need the increased rainfall - Temperatures
will be seasonable - Southeastern
Canada will see below average precipitation and warmer than usual temperatures over the next ten days
- Mexico
precipitation will continue limited to a few eastern and far southern locations during the next week to ten days - Rain
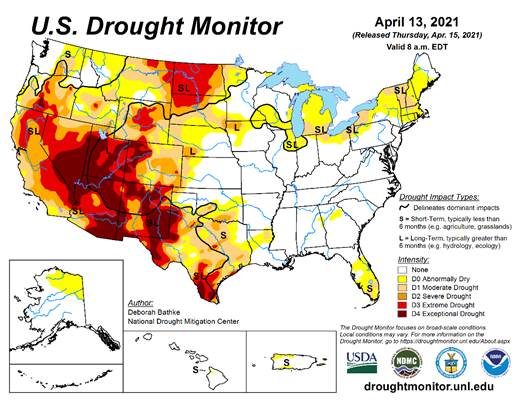
is needed in many areas - Drought
is prevailing across most of the nation - Southern
Oscillation Index this morning was +0.26 and the index will move lower over the next several days
Source:
World Weather Inc. & FI
Thursday,
April 15:
- USDA
weekly crop net-export sales for corn, soybeans, wheat, cotton, pork, beef, 8:30am - Malaysia’s
April 1-15 palm oil export data - The
U.S. National Confectionery Association releases first quarter cocoa grinding data for North America - USDA
updates monthly North American sugar and sweeteners outlook - White
sugar May contract expires - New
Zealand food prices - HOLIDAY:
Thailand
Friday,
April 16:
- ICE
Futures Europe weekly commitments of traders report (6:30pm London) - CFTC
commitments of traders weekly report on positions for various U.S. futures and options, 3:30pm - Cocoa
Association of Asia releases 1Q 2021 cocoa grinding data - FranceAgriMer
weekly update on crop conditions
Source:
Bloomberg and FI
USDA
Export Sales
US
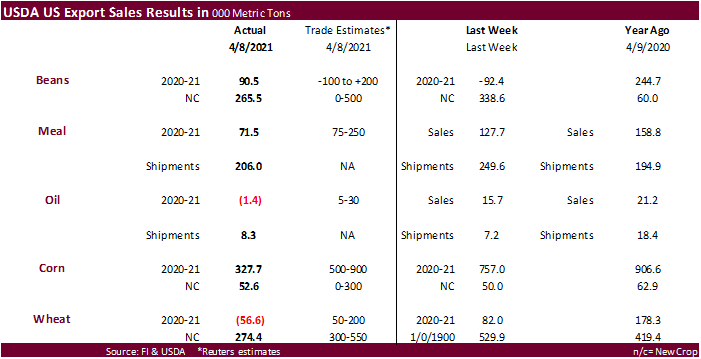
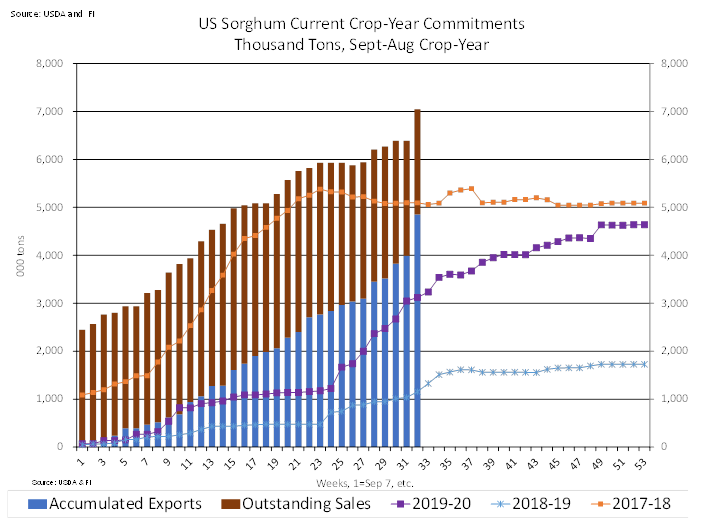
weekly export sales of sorghum knocked it out of the ballpark at 656,700 tons, a marketing year high, and included China taking 601,700 tons (including decreases of 65,300 MT). Sorghum exports of 860,400 MT, also a marketing-year high.
Soybean
sales for old crop were above water at 90,500 tons and new-crop within expectations at 265,500 tons. Meal and soybean oil sales were at the low end and below expectations, respectively.
Old
crop corn sales slowed to 327,700 tons, below expectations, and all-wheat sales were negative 56,600 tons for this crop year and positive 274,400 tons for new-crop. New-crop sales for wheat were below expectations.
US
Retail Sales (M/M) Mar 9.8% (est 5.9%; prevR -2.7%; prev -3.0%)
–
US Retail Sales Ex. Auto (M/M) Mar 8.4% (est 5.0%; prevR -2.5%; prev -2.7%)
–
US Retail Sales Ex. Auto & Gas (M/M) Mar 8.2% (est 6.4%; prevR -3.1%; prev -3.3%)
–
US Retail Sales Control Group (M/M) Mar 6.9% (est 6.3%; prevR -3.4%; prev -3.5%)
US
Initial Jobless Claims Apr 10 576K (est 700K; prevR 769K; prev 744K)
–
US Continuing Claims Apr 3 3.731M (est 3.700M; prevR 3.727M; prev 3.734M)
US
Empire Manufacturing Apr 26.3 (est 19.5; prev 17.4)
US
Philadelphia Fed Business Outlook Apr 50.2 (est 42.0; prev 51.8)
US
Industrial Production (M/M) Mar 1.4% (est 2.5%; prevR -2.6%; prev -2.2%)
–
US Capacity Utilization Mar 74.4% (est 75.6%; prevR 73.4%; prev 73.8%)
–
US Manufacturing Production (M/M) Mar 2.7% (est 3.6%; prevR -3.7%; prev -3.1%
The
US imposed broad sanctions against Russia for their interference in the 2020 U.S. election, cyber-hacking, bullying Ukraine and other “malign” acts. (Reuters)
Corn
- CBOT
corn
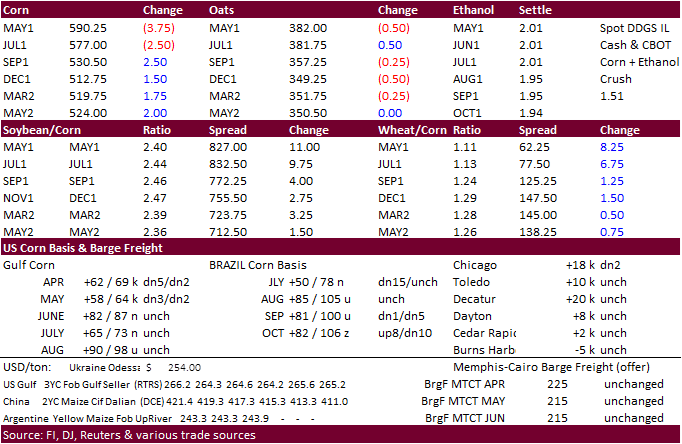
hit an 8-year high as it traded above $6.00 basis the May contract, before trending lower late in day to close lower. The higher trade in the May contract earlier was on fund buying amid US weather concerns and USD sitting near a 3-week low. South Korea
bought a cargo of US corn. Bear spreading pulled May corn 4 cents lower for it to end at $5.90. July finished 2.75 cents lower while the back months held gains to end higher. Soybean/corn spreading could have influenced nearby corn.
- Argentina’s
BA Grains Exchange increased their Argentina corn production estimate by 1 million tons to 46 million.
- Funds
on sold an estimated net 2,000 corn contracts. - USDA
announced they will look at their methodology to collect data for their quarterly grains stocks.
- The
US generated 1.19 billion ethanol D6 RINs in March, up from 903 million in February.
- The
EPA is seeking comments from various oil, biofuel, producers, and other groups for input on how the US should move forward with clean energy initiatives. RFS policy will start to phase out in 2022, and the government is looking for consultation/input/studies
on how to reform or revamp the program. In our opinion, the US needs to adopt a program that adjusts to current economic conditions, say on a quarterly basis, using but not limited to supply & demand and prices – from farm to finished product. As we saw
over the past year, certain biofuel sectors were less impacted by others during the pandemic. And with renewable biodiesel industry growing at a rapid pace, the biofuel blending landscape will ultimately change. Setting hard yearly blending targets for each
specific biofuel sector over a long period could leave some companies/groups or end users at an economic disadvantage over others. Rolling out some type of flex plan could reduce economic risk for some groups by still achieving long term domestic use goals
set by the EPA. - Rain
and snow in parts of China’s northeast this week may delay planting of corn, according to the country’s National Meteorological Center. (Bloomberg)
Export
developments.
- South
Korea’s KFA bought 65,000 tons of US corn at $293.79/ton c&f for March 20-April 30 loading.
Updated
4/15/21
May
corn is seen in a $5.70 and $6.10 range (up 10, up 15)
July
is seen in a $5.25 and $5.90 range
December
corn is seen in a $3.85-$5.50 range.
- CBOT
soybeans
were higher on follow through buying and concerns rationing of US soybeans are starting to emerge. NOPA March US crush was slightly bearish for soybeans and a little friendly for the products. Soybeans finished 8.25 cents higher basis the May, $3.70 higher
(bull spreading) for May soybean meal and May soybean oil was up 67 points.
- Funds
on Thursday bought an estimated net 2,000 soybean contracts, bought 2,000 soybean meal and bought an estimated 4,000 soybean oil.
- The
US generated 406 million biodiesel D4 RINs in March, up from 306 million in February.
- AmSpec
reported Malaysian palm 1-15 April shipments up 13% from the previous month to 585,510 tons. ITS reported a 15.4% increase at 585,280 tons. SGS reported at 6.3% increase at 583,875 tons from the previous month.
- Malaysia
kept their crude palm oil export tax unchanged at 8% for May.
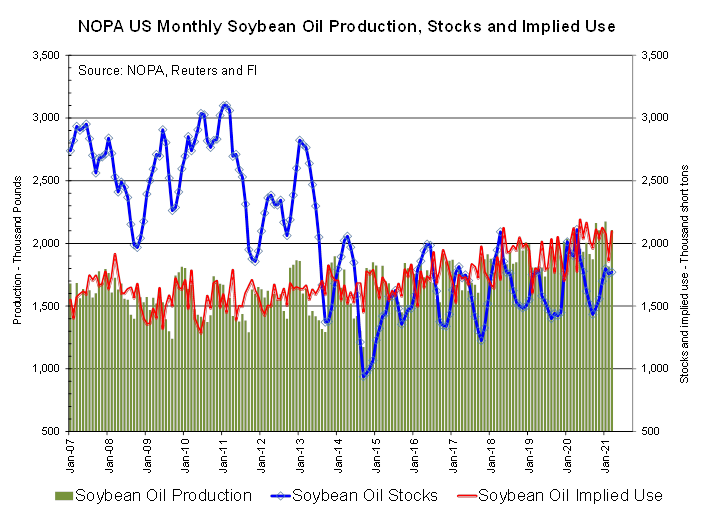
NOPA
March US crush
report was slightly bearish for soybeans and a little friendly for the products. NOPA reported a March crush at 178.0 million bushels, 1.2 million below a Reuters trade average but below 181.4 million reported a year ago. Daily adjusted the crush increased
only 3.6% from February and was down 1.9% from March 2020. The daily crush also ranks 6th largest in our working history. US soybean oil stocks came in at 1.771 billion pounds, 51 million below an average trade guess and well up from 11.70 pounds
per bushel from February and below 1.899 billion reported a year earlier.
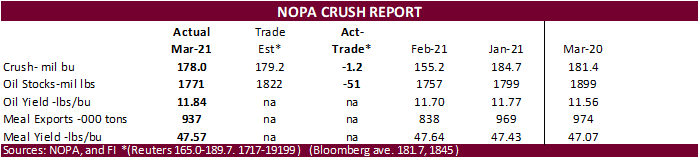
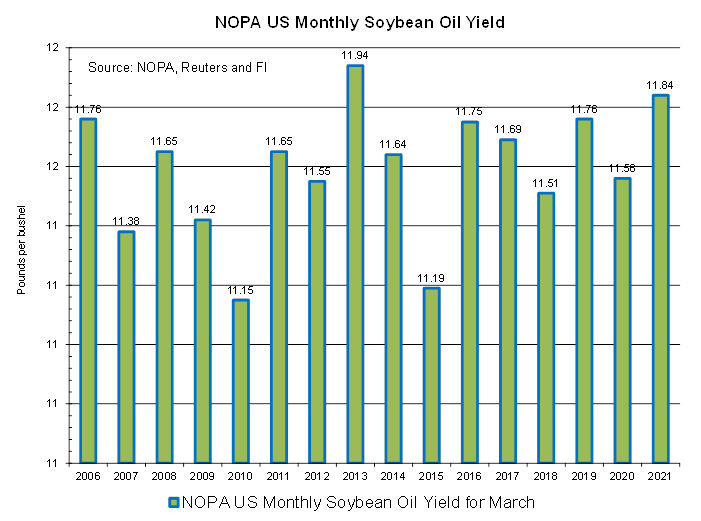
It
is not that uncommon to see a large March soybean oil yield when looking back at history, but month over month it’s a little unusual to see such a large jump. The US March soybean oil yield of 11.84 is the second highest for month of March. September 2019
was last highest for any month at 11.86. Soybean oil production was 2.107 billion pounds, fourth largest for any month in our working history, and implied soybean oil use rebounded a good amount from February. Soybean meal exports were about 50,000 short
tons above our expectations. Coming in at 937,000 short tons, they are below 974,000 short tons exported during March 2020. The soybean meal yield declined from the previous month to 47.57 from 47.64 and compares to 47.07 year ago. Soybean meal production
for March 2021 was the 6th largest in our working history. Looking forward, with CBOT August crush trading at 70 cents earlier in the day (highest since April 1), we see no reason for crushers to slow down this summer unless they have a hard time
sourcing soybeans, which will be inevitable for some areas.
Soybean
oil implied use was better than expected.
- Egypt’s
GASC bought a combined 81,000 tons of soybean oil, of that 30,000 tons from the international market. The 30,000 tons was bought at $1,250/ton for arrival June 1-20.
Payment
should be for at sight looking at earlier offers. The
local SBO is for June 5-25 arrival. The passed on sunflower oil. Traders
gave the following breakdown of the purchase: - 30,000
tons of soyoil at $1,250 per ton - 15,000
tons of soyoil at 19,265 EGP - 16,000
tons of soyoil at 19,265 EGP - 15,000
tons of soyoil at 19,265 EGP - 5,000
tons of soyoil at 19,265 EGP
Updated
4/13/21
May
soybeans are seen in a $13.65 and $14.50 range
July $13.00-$14.60 November $10.50-$14.50
May
soymeal is seen in a $385 and $410 range
July $380-$4.40 December $325-$460
May
soybean oil is seen in a 50.25 and 55 cent range
July
47.00-56.00 December 42-53 cent wide range (depends on global biodiesel and renewable fuel expansion)
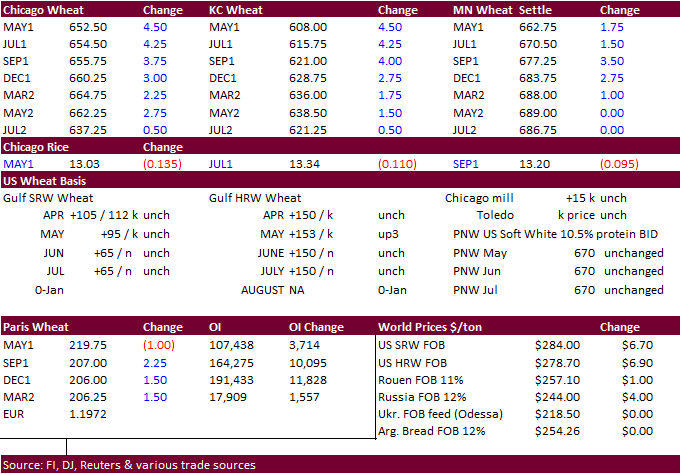
- US
wheat ended higher on US and EU weather concerns and follow through buying from investment funds. Global export developments have been steady this week. Algeria bought around 200,000 tons of wheat. MN wheat lost ground against Chicago and KC wheat after
hitting contract highs on Wednesday due to light profit taking. We remain bullish EU and MN type wheat due to speculation geopolitical and weather problems will support the contracts. Time will tell but fact remains there is a lot of wheat out there. CBOT
rice futures fell as wet weather for the southern Delta recently benefited the US crop.
- September
Paris wheat was up 1.75 euros at 205.50 euros. - Funds
on Thursday bought an estimated net 4,000 CBOT SRW wheat contracts. - Strategie
Grains raised its monthly forecast for 2020-21 soft wheat exports from the European Union and Britain by 200,000 tons to 25.4 million tons. They estimate 2021 soft wheat production in the EU’s 27 member countries at 129.6 million tons, up from 119.4 million
last year. - Ukraine’s
UMG Investments plans to build a grain export terminal at the Black Sea port of Pivdenyi near Odessa with the annual capacity of 9 million tons over the next 2-3 years.
- Algeria’s
OAIC bought around 200,000 tons of durum wheat at (2 boats) $351 to $352 a ton c&f and another of Canada western amber durum (CWAD) at a slightly higher price. Shipment was sought between May 1-15 and May 15-31.
- The
Philippines passed on 165,000 tons of feed wheat due to high prices. - The
Philippines in a separate import tender seeks 240,000 tons of wheat and 140,000 tons of animal feed barley on Friday for June through September shipment. The milling wheat can be sourced from Russia, Ukraine or Australia. The feed wheat can be sourced from
Russia, Ukraine, Romania, Bulgaria, Brazil, Australia, the United States or Canada, traders said.
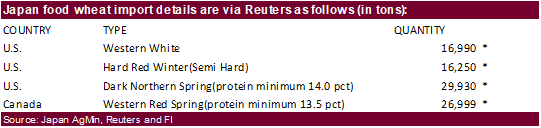
- Japan
bought 90,169 tons of Canadian and US food wheat as expected. Original details as follows.
*no
shipment period was provided.
- Ethiopia
seeks 30,000 tons of wheat on April 16. - Ethiopia
seeks 400,000 tons of optional origin milling wheat, on April 20, valid for 30 days. In January Ethiopia cancelled 600,000 tons of wheat from a November import tender because of contractual disagreements.
- Jordan
seeks 120,000 tons of feed barley on April 21.
Rice/Other
·
Mauritius seeks 4,000 tons of optional origin long grain white rice on April 16 for delivery between June 1 and July 31.
·
Bangladesh seeks 50,000 tons of rice on April 18.
·
Syria seeks 39,400 tons of white rice on April 19. Origin and type might be White Chinese rice or Egyptian short grain rice.
·
Ethiopia seeks 170,000 tons of parboiled rice on April 20.
Updated
4/13/21
May Chicago wheat is seen in a $6.20‐$6.65 range
July $6.00-$6.80
May KC wheat is seen in a $5.60‐$6.10 range (US HRW wheat
conditions are improving)
July $5.40-$6.25
May MN wheat is seen in a $6.30‐$6.80 range
July $6.20-$7.00 (depends on EU crop damage
and US spring wheat seedings/development)
U.S. EXPORT SALES FOR WEEK ENDING 4/8/2021
|
|
CURRENT MARKETING YEAR |
NEXT MARKETING YEAR |
||||||
|
COMMODITY |
NET SALES |
OUTSTANDING SALES |
WEEKLY EXPORTS |
ACCUMULATED EXPORTS |
NET SALES |
OUTSTANDING SALES |
||
|
CURRENT YEAR |
YEAR |
CURRENT YEAR |
YEAR |
|||||
|
|
THOUSAND METRIC TONS |
|||||||
|
WHEAT |
|
|
|
|
|
|
|
|
|
HRW |
-1.3 |
1,146.3 |
1,662.7 |
124.1 |
7,400.3 |
7,933.6 |
95.3 |
482.5 |
|
SRW |
-23.0 |
259.3 |
256.5 |
19.0 |
1,512.5 |
2,108.2 |
6.0 |
477.6 |
|
HRS |
-27.6 |
1,251.1 |
1,345.0 |
129.4 |
6,270.3 |
6,008.8 |
110.9 |
533.0 |
|
WHITE |
-5.2 |
1,606.9 |
858.4 |
192.2 |
5,010.0 |
4,126.3 |
62.2 |
482.4 |
|
DURUM |
0.5 |
78.1 |
221.3 |
2.4 |
594.5 |
699.0 |
0.0 |
5.0 |
|
TOTAL |
-56.6 |
4,341.7 |
4,343.8 |
467.1 |
20,787.6 |
20,876.0 |
274.4 |
1,980.4 |
|
BARLEY |
0.0 |
5.0 |
10.8 |
0.5 |
24.2 |
38.8 |
0.0 |
20.2 |
|
CORN |
327.7 |
29,023.5 |
13,844.0 |
1,816.3 |
37,787.3 |
20,819.0 |
52.6 |
2,102.1 |
|
SORGHUM |
656.7 |
2,193.0 |
1,548.5 |
860.4 |
4,850.7 |
1,572.4 |
201.0 |
1,020.0 |
|
SOYBEANS |
90.4 |
5,264.6 |
4,983.1 |
413.1 |
55,498.0 |
32,494.2 |
265.5 |
5,876.3 |
|
SOY MEAL |
71.5 |
2,220.4 |
2,735.6 |
206.0 |
6,915.2 |
6,403.3 |
26.0 |
280.8 |
|
SOY OIL |
-1.5 |
106.2 |
308.8 |
8.3 |
547.3 |
636.4 |
0.0 |
0.6 |
|
RICE |
|
|
|
|
|
|
|
|
|
L G RGH |
0.0 |
298.3 |
285.9 |
18.9 |
1,125.2 |
1,065.9 |
0.0 |
0.0 |
|
M S RGH |
0.0 |
5.3 |
17.9 |
0.0 |
23.5 |
52.7 |
0.0 |
0.0 |
|
L G BRN |
-14.3 |
3.1 |
16.4 |
0.3 |
34.7 |
41.7 |
0.0 |
0.0 |
|
M&S BR |
0.3 |
68.6 |
60.2 |
0.6 |
85.7 |
48.3 |
0.0 |
0.0 |
|
L G MLD |
17.2 |
65.2 |
41.4 |
1.9 |
458.9 |
706.7 |
0.0 |
0.0 |
|
M S MLD |
4.2 |
252.1 |
254.2 |
10.9 |
392.9 |
431.3 |
0.0 |
0.0 |
|
TOTAL |
7.3 |
692.7 |
675.8 |
32.6 |
2,121.0 |
2,346.4 |
0.0 |
0.0 |
|
COTTON |
|
THOUSAND RUNNING BALES |
||||||
|
UPLAND |
122.3 |
4,812.7 |
5,677.6 |
313.2 |
10,156.5 |
9,425.9 |
22.8 |
1,614.7 |
|
PIMA |
3.1 |
220.1 |
161.0 |
16.4 |
529.8 |
380.4 |
0.0 |
1.1 |
This
summary is based on reports from exporters for the period April 2-8, 2021.
Wheat: Net
sales reductions of 56,600 metric tons (MT) for 2020/2021–a marketing-year low–were down noticeably from the previous week and from the prior 4-week average. Increases primarily for the Philippines (19,200 MT, including 12,500 MT switched from unknown destinations
and decreases of 1,100 MT), the Dominican Republic (17,000 MT), Malaysia (11,500 MT, switched from unknown destinations), Colombia (8,500 MT, including 5,000 MT switched from Honduras), and Singapore (7,000 MT, switched from unknown destinations), were more
than offset by reductions primarily for South Korea (35,600 MT), unknown destinations (31,000 MT), Mexico (28,000 MT), and Japan (26,500 MT). For 2021/2022, net sales of 274,400 MT reported for unknown destinations (199,000 MT), the Philippines (113,500 MT),
Japan (47,900 MT), South Korea (38,000 MT), and Peru (6,000 MT), were offset by reductions for China (130,000 MT). Exports of 467,100 MT were down 26 percent from the previous week and 16 percent from the prior 4-week average. The destinations were primarily
to the Philippines (108,200 MT), Mexico (76,100 MT), China (68,000 MT), South Korea (67,400 MT), and Nigeria (27,500 MT).
Optional
Origin Sales:
For 2020/2021, the current outstanding balance of 29,000 MT is for Spain
Corn:
Net sales of 327,700 MT for 2020/2021 were down 57 percent from the previous week and 81 percent from the prior 4-week average. Increases primarily for Japan (178,000 MT, including 76,800 MT switched from unknown destinations and decreases of 1,800 MT ),
Mexico (138,900 MT, including 34,000 MT switched from unknown destinations and decreases of 14,500 MT), South Korea (125,900 MT, including 66,000 MT switched from unknown destinations and decreases of 9,100 MT), Taiwan (111,500 MT, including 69,000 MT switched
from unknown destinations, 27,200 MT switched from China, and decreases of 500 MT), and Israel (55,200 MT, including 55,000 MT switched from unknown destinations), were offset by reductions primarily for unknown destinations (379,900 MT). For 2021/2022, net
sales of 52,600 MT were reported for Guatemala (25,700 MT), El Salvador (24,400 MT), and Canada (2,500 MT). Exports of 1,816,300 MT were down 12 percent from the previous week and from the prior 4-week average. The destinations were primarily to China (520,300
MT), Mexico (450,100 MT, including 34,100 MT – late), Japan (230,800 MT), South Korea (191,400 MT), and Taiwan (123,800 MT).
Optional
Origin Sales:
For 2020/2021, options were exercised to export 124,000 MT to South Korea (69,000 MT) and unknown destinations (55,000 MT) from the United States. The current outstanding balance of 443,800 MT is for South Korea (213,000 MT), unknown destinations (189,500
MT), the Ukraine (32,400 MT), and China (8,900 MT).
Late
Reporting:
For 2020/2021, exports totaling 34,100 MT of corn was reported late to Mexico.
Barley:
For 2020/2021, no net sales were reported for the week. Exports of 500 MT were down 6 percent from the previous week, but up 19 percent from the prior 4-week average. The destination was primarily to Canada (300 MT).
Sorghum:
Net sales of 656,700 MT for 2020/2021–a marketing-year high–were up noticeably from the previous week and from the prior 4-week average. Increases were reported for China (601,700 MT, including decreases of 65,300 MT and
659,100 MT – late) and unknown destinations (55,000 MT). For 2021/2022, net sales of 201,000 MT were reported for unknown destinations (136,000 MT) and China (65,000 MT). Exports of 860,400 MT–a marketing-year high–were up noticeably from the previous
week and from the prior 4-week average. The destination was China (including 659,100 MT – late).
Late
Reporting:
For 2020/2021, net sales and exports totaling 659,100 MT of sorghum was reported late to China.
Rice:
Net sales of 7,300 MT for 2020/2021 were down 83 percent from the previous week and 89 percent from the prior 4-week average. Increases primarily for Canada (1,800 MT), Jordan (1,700 MT), Saudi Arabia (1,400 MT), the Dominican Republic (1,000 MT), and Honduras
(500 MT), were offset by reductions for Mexico (100 MT). Exports of 32,600 MT were up 6 percent from the previous week, but down 37 percent from the prior 4-week average. The destinations were primarily to Mexico (13,700 MT), Japan (6,200 MT), Honduras (5,500
MT), Canada (2,500 MT), and South Korea (1,400 MT).
Soybeans:
Net sales of 90,400 MT for 2020/2021 were down noticeably from the previous week and down 14 percent from the prior 4-week average. Increases primarily for Indonesia (75,900 MT, including 68,000 MT switched from unknown destinations and decreases of 300 MT),
South Korea (29,600 MT, including 25,000 MT switched from unknown destinations), Vietnam (25,600 MT, including 21,200 MT late), Mexico (15,700 MT, including 16,400 MT switched from unknown destinations and decreases of 2,800 MT), and Japan (12,700 MT, including
9,000 MT switched from unknown destinations), were offset by reductions primarily for China (55,000 MT) and unknown destinations (45,000 MT). For 2021/2022, net sales of 265,500 MT were reported for China (264,000 MT), unknown destinations (1,000 MT), and
Canada (500 MT). Exports of 413,100 MT were up 20 percent from the previous week, but down 10 percent from the prior 4-week average. The destinations were primarily to Mexico (97,100 MT, including 14,800 MT late), China (91,600 MT, including 77,000 MT late),
Indonesia (90,800 MT), Taiwan (38,000 MT), and South Korea (27,500 MT).
Exports
for Own Account:
For 2020/2021, the current exports for own account outstanding balance is 5,800 MT, all Canada.
Export
Adjustments: Accumulated exports of soybeans to China were adjusted down 76,999 MT for week ending December 17th. This shipment was reported in error.
Late
Reporting:
For 2020/2021, net sales totaling 98,900 MT were reported late for China (77,000 MT), Vietnam (21,200 MT), and Panama (700 MT). Exports totaling 119,700 MT were for China (77,000 MT), Vietnam (21,200 MT), Mexico (14,800 MT), and Panama (6,700 MT).
Soybean
Cake and Meal:
Net sales of 71,500 MT for 2020/2021–a marketing-year low–were down 44 percent from the previous week and 57 percent from the prior 4-week average. Increases primarily for the Philippines (22,300 MT, including decreases of 700 MT), Venezuela (13,200 MT,
including 10,000 MT switched from Colombia), Mexico (10,400 MT), Canada (9,200 MT, including decreases of 100 MT), and the Dominican Republic (8,500 MT), were offset by reductions primarily for unknown destinations (8,000 MT), Colombia (5,500 MT), Guatemala
(2,800 MT), and Belgium (1,300 MT). For 2021/2022, net sales of 26,000 MT were reported for Guatemala (14,200 MT) and El Salvador (11,800 MT). Exports of 206,000 MT were down 18 percent from the previous week and 20 percent from the prior 4-week average.
The destinations were primarily to the Philippines (68,000 MT), Mexico (31,000 MT), Morocco (30,000 MT), Canada (17,900 MT), and Venezuela (10,700 MT).
Soybean
Oil:
For 2020/2021, net sales reductions of 1,500 MT–a marketing-year low–were down noticeably from the previous week and from the prior 4-week average. Increases primarily for Canada (500 MT) and the Dominican Republic (500 MT), were more than offset by reductions
for Colombia (2,500 MT). Exports of 8,300 MT were up 14 percent from the previous week, but down 13 percent from the prior 4-week average. The destinations were primarily to South Korea (7,700 MT), Mexico (300 MT), and Canada (200 MT).
Cotton:
Net sales of 122,300 RB for 2020/2021 were down 55 percent from the previous week and 54 percent from the prior 4-week average. Increases primarily for Turkey (29,400 RB), Pakistan (21,800 RB, including 1,500 RB switched from the United Arab Emirates), Vietnam
(20,500 RB, including 5,200 RB switched from China and 600 RB switched from South Korea), Bangladesh (12,300 RB), and Indonesia (9,600 RB), were offset by reductions for the United Arab Emirates (1,500 RB) and South Korea (600 RB). For 2021/2022, net sales
of 22,800 RB were reported for Guatemala (19,300 RB) and Thailand (3,500 RB). Exports of 313,200 RB were down 16 percent from the previous week and 8 percent from the prior 4-week average. Exports were primarily to Vietnam (92,500 RB), Pakistan (61,400 RB),
China (38,800 RB), Turkey (37,100 RB), and Bangladesh (28,500 RB). Net sales of Pima totaling 3,100 RB–a marketing-year low–were down 58 percent from the previous week and 51 percent from the prior 4-week average. Increases were reported for South Korea
(1,400 RB), Peru (1,200 RB), Pakistan (400 RB), and Guatemala (100 RB). Exports of 16,400 RB were down 24 percent from the previous week, but up 18 percent from the prior 4-week average. The destinations were primarily to India (7,600 RB), China (2,700 RB),
Honduras (1,700 RB), Vietnam (1,500 RB), and Egypt (1,300 RB).
Exports
for Own Account:
For 2020/2021, new exports for own account totaling 200 RB were to China. Exports for own account totaling 2,500 RB primarily to Vietnam (1,900 RB) were applied to new or outstanding sales. The current exports for own account outstanding balance of 29,200
RB is for China (22,800 RB), Vietnam (5,800 RB), and Bangladesh (600 RB).
Hides
and Skins:
Net sales of 282,700 pieces for 2021 were down 29 percent from the previous week and 40 percent from the prior 4-week average. Increases primarily for China (164,600 whole cattle hides, including decreases of 5,900 pieces), South Korea (52,900 whole cattle
hides, including decreases of 800 pieces), Mexico (23,800 whole cattle hides, including decreases of 400 pieces), Thailand (18,400 whole cattle hides, including decreases of 1,000 pieces), and Japan (2,200 whole cattle hides), were offset by reductions for
Indonesia (300 MT). Total net sales of 13,500-kip skins were for Belgium.
Exports of 401,800 pieces for 2021 were up 9 percent from the previous week and 6 percent from the prior 4-week average. Whole cattle hides exports were primarily to China (293,500 pieces), South Korea (53,200 pieces), Thailand
(16,600 pieces), Mexico (14,500 pieces), and Vietnam (4,300 pieces). Exports of 6,300-kip skins were to Belgium.
Net
sales of 64,200 wet blues for 2021 were unchanged from the previous week, but down 57 percent from the prior 4-week average. Increases reported for China (34,200 unsplit, including decreases of 200 unsplit), Italy (17,900 unsplit, including decreases of 200
unsplit), Vietnam (8,800 unsplit, including decreases of 100 unsplit), South Korea (3,400 grain splits, including decreases of 100 grain splits), and Taiwan (100 grain splits), were offset by reductions for Thailand (200 unsplit). Exports of 101,000 wet blues
for 2021 were down 16 percent from the previous week and 17 percent from the prior 4-week average. The destinations were primarily to Italy (23,900 unsplit and 7,200 grain splits), Vietnam (23,300 unsplit), China (17,000 unsplit and 2,200 grain splits), Thailand
(16,000 unsplit), and Mexico (3,700 grain splits and 900 unsplit). Net sales of 488,400 splits were for China (271,500 pounds, including decreases of 600 pounds), Taiwan (172,300 pounds, including decreases of 86,500 pounds), and Vietnam (44,600 pounds, including
decreases of 1,500 pounds). Exports of 336,700 pounds were to Vietnam (207,4,000 pounds) and China (129,300 pounds).
Beef:
Net
sales of 15,700 MT reported for 2021 were down 14 percent from the previous week and 23 percent from the prior 4-week average. Increases primarily for Japan (6,300 MT, including decreases of 500 MT), China (3,300 MT, including decreases of 100 MT), South
Korea (2,900 MT, including decreases of 400 MT), and Mexico (1,400 MT), were
offset by reductions primarily for the Netherlands (100 MT). For 2022, total net sales of 200 MT were reported for Canada. Exports of 19,000 MT were up 1 percent from the previous week and 3 percent from the prior 4-week
average. The destinations were primarily to South Korea (5,400 MT), Japan (4,900 MT), China (3,500 MT), Mexico (1,400 MT), and Taiwan (1,200 MT).
Pork:
Net
sales of 17,200 MT reported for 2021–a marketing-year low-were down 48 percent from the previous week and 60 percent from the prior 4-week average. Increases were primarily for Mexico (7,800 MT, including decreases of 500 MT), Japan (4,300 MT, including
decreases of 100 MT), South Korea (1,300 MT, including decreases of 900 MT), Colombia (900 MT, including decreases of 100 MT), and the Philippines (800 MT, including decreases of 200 MT). Exports of 38,600 MT were unchanged from the previous week, but down
2 percent from the prior 4-week average. The destinations were primarily to China (12,500 MT), Mexico (9,900 MT), Japan (5,000 MT), South Korea (2,300 MT), and the Philippines (1,900 MT).
Terry Reilly
Senior Commodity Analyst – Grain and Oilseeds
Futures International
One Lincoln Center
18 W 140 Butterfield Rd.
Oakbrook Terrace, Il. 60181
W: 312.604.1366
ICE IM:
treilly1
Skype: fi.treilly

Trading of futures, options, swaps and other derivatives is risky and is not suitable for all persons. All of these investment products are leveraged, and you can lose more than your initial deposit. Each investment product is offered
only to and from jurisdictions where solicitation and sale are lawful, and in accordance with applicable laws and regulations in such jurisdiction. The information provided here should not be relied upon as a substitute for independent research before making
your investment decisions. Futures International, LLC is merely providing this information for your general information and the information does not take into account any particular individual’s investment objectives, financial situation, or needs. All investors
should obtain advice based on their unique situation before making any investment decision. The contents of this communication and any attachments are for informational purposes only and under no circumstances should they be construed as an offer to buy or
sell, or a solicitation to buy or sell any future, option, swap or other derivative. The sources for the information and any opinions in this communication are believed to be reliable, but Futures International, LLC does not warrant or guarantee the accuracy
of such information or opinions. Futures International, LLC and its principals and employees may take positions different from any positions described in this communication. Past results are not necessarily indicative of future results.