PDF Attached
Corn,
wheat and soybean oil traded limit up during the trade today. Only corn limits expand because the front two contracts ended limit higher. Soybean complex limits do not expand.
https://www.cmegroup.com/trading/price-limits.html
Option activity was heavy. Funds
bought an estimated net 73,000 corn contracts, largest single buying day in our working history since 2012. Story over weather, inflation and shrinking stocks has not changed much.
CME
is resetting price limits for grain, oilseed and lumber futures on May 2. For example, corn to 40 cents, soybeans to 1.00, wheat to 45.
https://www.cmegroup.com/content/dam/cmegroup/notices/ser/2021/04/SER-8761.pdf
CME
margin changes via Reuters-
- CME
RAISES CORN FUTURES (C) MAINTENANCE MARGINS BY 13.3% TO $1,700 PER CONTRACT FROM $1,500 FOR MAY 2021 - CME
RAISES CRUDE OIL FUTURE NYMEX (CL) MAINTENANCE MARGINS BY 3.9% TO $5,300 PER CONTRACT FROM $5,100 FOR JUNE 2021 - CME
RAISES SOYBEAN FUTURES (S) MAINTENANCE MARGINS BY 14.2% TO $3,825 PER CONTRACT FROM $3,350 FOR MAY 2021 - SAYS
INITIAL MARGIN RATES ARE 110% OF MAINTENANCE MARGIN RATES - SAYS
RATES WILL BE EFFECTIVE AFTER THE CLOSE OF BUSINESS ON APRIL 23, 2021
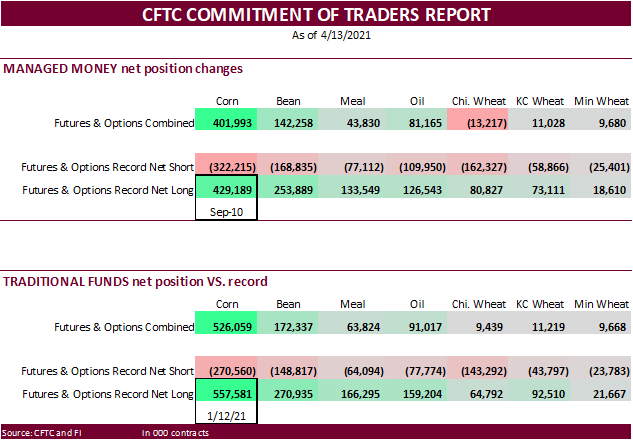
Traditional
and managed money fund long positions are expected to post a record corn position when updated Friday afternoon.
Part of the reason we should see large managed money positions is that the CME on March 1 raised their position limits for ags.
https://www.cmegroup.com/rulebook/files/cme-group-Rule-562-pending.pdf
![]()
Weather
World
Weather Inc.
TODAY’S
HIGHLIGHTS
- Southwestern
Ohio temperatures were 26-30 degrees Fahrenheit this morning - Central
North Carolina and Central Virginia temperatures this morning slipped to 27-30 degrees Fahrenheit - No
significant frost or freeze in U.S. Delta or Tennessee River Basin this morning - Hot
temperatures still advertised for central and southern Plains Sunday into Tuesday with Monday hottest – highs in the 80s to near 90F - Severe
weather potential and heavy rain event possible during mid-week next week in U.S. Delta and parts of Illinois - Less
rain in Iowa/southern Minnesota and southwestern Wisconsin for mid-week next week - Dry
conditions for at least 10 days in west and south Texas - West-central
U.S. high Plains region may not get good rain until early May and that opportunity seems limited - Northern
U.S. Plains and southern Canada will get only brief periods of light precipitation, but at least some moisture is expected periodically in the next ten days – much more rain is still needed - Brazil
Safrinha corn areas are still advertised to be dry biased over the next ten days in Sao Paulo, SW Minas Gerais, southern Goias and neighboring areas - Less
rain was suggested in Mato Grosso do Sul and southern Mato Grosso during the coming two weeks - 06z
GFS model was not very generous with rain for the first week of May and was drier than the 00z model run - A
compromise between the two model runs is most likely to verify - Argentina
weather will remain well mixed over the next two weeks with today and Friday’s rain greatest for a while
- Europe’s
North Sea region is still advertised lighter than usual in precipitation until after day ten when some moisture is possible - Western
CIS is still advertised to be wet during the coming week and then a little drier - Temperatures
will be cooler biased for a while - No
significant changes noted for India, China, Australia, South Africa, North Africa or southeastern Asia relative to Wednesday
Source:
World Weather Inc. & FI
Wednesday,
April 21:
- EIA
weekly U.S. ethanol inventories, production - China
farm ministry’s CASDE outlook conference, day 2 - Platts
Agriculture Week conference, day 2 - Boao
Forum in Hainan, China, day 4 - USDA
Milk Production, 3pm - HOLIDAY:
Brazil, India
Thursday,
April 22:
- USDA
weekly crop net-export sales for corn, soybeans, wheat, cotton, pork, beef, 8:30am - Port
of Rouen data on French grain exports - Platts
Agriculture Week conference, day 3 - USDA
red meat production - EARNINGS:
Suedzucker, Barry Callebaut
Friday,
April 23:
- ICE
Futures Europe weekly commitments of traders report (6:30pm London) - CFTC
commitments of traders weekly report on positions for various U.S. futures and options, 3:30pm - FranceAgriMer
weekly update on crop conditions - U.S.
Cattle on Feed, Poultry Slaughter 3pm - U.S.
cold storage – pork, beef, poultry
Source:
Bloomberg and FI
USDA
Export Sales
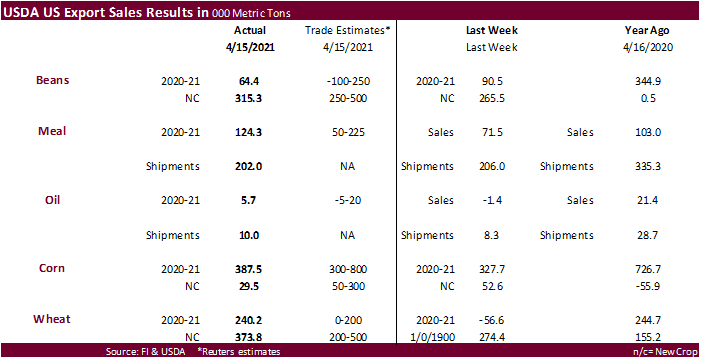
Nearly
all the major commodities for USDA export sales came in within expectations, but not at levels that the trade would like to see export demand. New-crop corn fell short of expectations and old crop wheat was slightly higher than expected. We are looking for
USDA to take 2020-21 US corn exports up in the May USDA S&D by 50-100 million bushels. Sorghum sales were only 7,000 tons after hit a marketing year high on China demand week earlier. Barley sales were only 100 tons. Pork sales were 22,100 tons, a marketing
year low.
Macro
US
Existing Home Sales Change Mar: 6.01M (est 6.11M; prev R 6.24M)
–
Existing Home Sales (M/M) Mar: -3.7% (est -1.8%; prev R -6.3%)
US
Leading Indicator (M/M) Mar: 1.3% (est 1.0%; prev 0.2%)
US
Initial Jobless Claims Apr-17: 547K (exp 610K; R prev 586K)
–
Continuing Claims Apr-10: 3674K (exp 3600K; R prev 3708K)
US
Chicago Fed National Activity Index Mar: 1.71 (exp 1.25; R prev -1.20)
Corn
- CBOT
corn
again was firm today, touching the highest levels seen since July 2013. Front two-month contracts were up limit by mid-session. Nothing has changed with fundamentals. Traders are bullish US corn exports through the remainder of the summer from declining
prospects for Brazil’s second crop. Inflation talk and rising interest rates were noted. We caution this rally as prices at these level should promote producer selling.
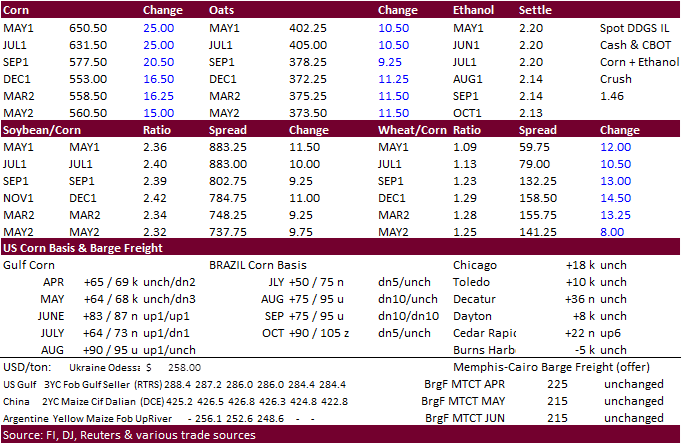
- May
and July closed limit higher and around the close May was quoted around $6.51 and July $6.32, both $0.50 above limit.
- Funds
bought an estimated net 73,000 corn contracts,
largest single buying day in our working history since 2012. Other large days since fall included 48k on Jan 26, 58k on Jan 12, and 57k on November 10, 2020.
- Brazil
corn conditions are deteriorating and many expect the US to pick up the slack for some of the Brazil second corn crop exports. Brazil’s Parana corn conditions as of Monday was rated 62% good condition, down from 76% a week earlier and 92% the prior week.
Rosario exchange estimated Argentina’s 2020-21 corn production at 50 million tons, up from 48.5 million tons previously.
- S&P
Global Platts estimated Ukraine corn production up 6% to 38 million tons.
- We
are hearing US ethanol margins are improving. - The
USDA Chicken and Eggs report showed March egg production down slightly, egg-type chicks hatched up 11 percent and broiler-type chicks hatched down 2 percent.
Export
developments.
-
None
reported -
Yesterday
and today, there was talk China bought US corn.
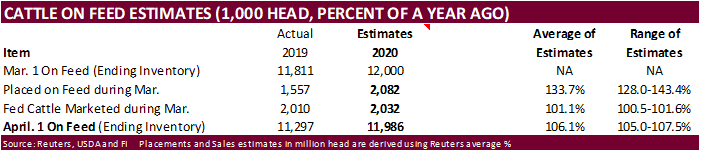
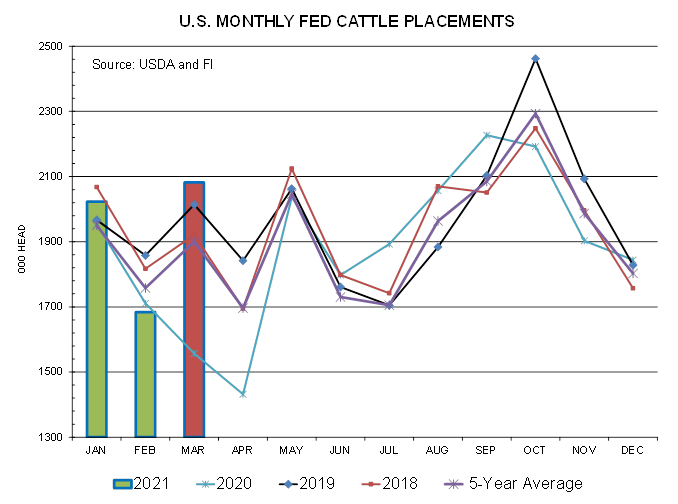
Placements
last month were reported at the bottom of a 5-year range, so expansion to 2.082 million head is not that unusual given seasonal expansion and drought conditions across parts of the US Great Plains. Red March bar below is a Reuters trade guess.
Updated
4/22/21
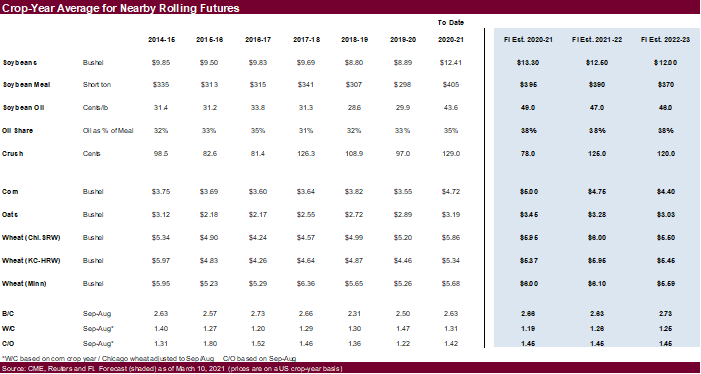
May
corn is seen in a $6.10 and $7.00 range
July
is seen in a $5.75 and $6.75 range
December
corn is seen in a $4.00-$6.50 range.
- CBOT
soybeans basis the May topped $15.40, ending below that level, led by soybean oil and higher soybean meal. May soybean oil was limit higher (+250) before settling 233 higher. July was up 201 points. May meal was up $9.70/short ton. The extended rally was
due in part to follow through buying on the same fundamentals with weather and demand dominating the bullish sentiment. The most impressive market has been soybean oil with nearby rolling futures hitting their highest level since July 2008. Renewable biodiesel
story continues to gain attention. US soybean oil stocks could drop below 1.2 billion pounds by the end of 2021-22. We remain bullish oil share through the summer months. CBOT crush margins were higher today led by May, and current July and August values
suggest there should be no reason to slow US processing through the summer. Finding beans is another story.
- ICE
canola hit a record high. July canola gained $12.60 to $831.70 per ton. August rapeseed prices hit a contract high. Palm futures are at a one-month high.
- Funds
on Thursday bought an estimated net 23,000 soybean contracts, bought 5,000 soybean meal and bought an estimated 11,000 soybean oil.
- US
soybean and corn basis remains very strong, especially for this time of year.
- Argentina’s
soybean production was unchanged by the Rosario exchange at 45 million tons. Buenos Aires Grains Exchange recently cut its 2020-21 Argentina soybean crop estimate to 43 million from 45 million tons. Argentine farmers have sold 14.37 million tons of soybeans,
below 19.23 million tons a year ago.
-
None
reported but yesterday were rumors China bought cargoes from the US.
Updated
4/22/21
May
soybeans are seen in a $14.75-$15.75 range; July $14.25-$16.50; November $12.75-$15.00
May
soymeal is seen in a $400-$430 range; July $400-$450; December $380-$460
May
soybean oil is seen in a 60 and 64 cent range; July 55-65; December 46-55 cent range
- US
wheat traded
limit higher in KC and Chicago but ended off contract highs. Chicago wheat traded above $7.00, first time since May 2014. Higher prices today were related to cold weather this week across in the southern US Great Plains, Black Sea production downgrades to
Russia, contract highs for EU wheat amid China buying about a half million tons of French wheat, and a generally weak USD. There was some talk of spring and winter wheat acreage loss due to producer planting additional soybean and corn acres. We think this
might be the case for spring wheat, but for much of the Midwestern winter wheat we should still see producers plant double crop soybeans following the harvest of winter wheat. We lowered our outlook for durum and spring wheat seedings for the US, and rice.
See attached US acreage table. - Funds
on Thursday bought an estimated net 19,000 CBOT SRW wheat contracts. - WZ
1000c were blocked 2,000x paid 11. - IKAR
lowered their Russia 2021 wheat crop production estimate by 1.5 million tons to 79.5 million tons.
- September
Paris wheat was up 7.50 at 220.75 euros. - We
are hearing rice acres across the southern US could be replaced with corn and soybeans due to high grain/oilseed prices. US could lose 100-200 thousand rice acres, which does not seem much for corn or soybean production but could have a good impact on rice
production.
USDA
Attaché: EU Grain and Feed annual
- China
is back in for French wheat and some traders think they booked about a half million tons new-crop for August shipment. France exported about 1.6 million tons of wheat to China so far for 2020-21.
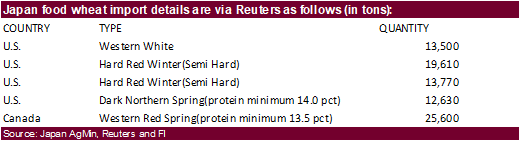
- Japan
bought 85,110 tons of food wheat from the US and Canada. Original details:
- Yesterday
Jordan passed 120,000 tons of feed barley on April 21.
- Ethiopia
saw a few offers for their 430,000-ton wheat import tender. Offers were near $313/ton c&f.
- Results
awaited: Ethiopia seeks 30,000 tons of wheat on April 16. - Results
awaited: Ethiopia
seeks 400,000 tons of optional origin milling wheat, on April 20, valid for 30 days. In January Ethiopia cancelled 600,000 tons of wheat from a November import tender because of contractual disagreements.
Rice/Other
·
Bangladesh delayed their 50,000-ton rice import tender that was set to close April 18, to now April 26.
·
Bangladesh seeks 50,000 tons of rice on May 2.
Updated
4/22/21
May Chicago wheat is seen in
a $6.75‐$7.50 range; July $6.50-$8.00
May KC wheat
is seen in a $6.25‐$7.30 range; July $6.20-$7.50
May MN wheat
is seen in a $6.85‐$7.50 range; July $6.80-$8.00
This
summary is based on reports from exporters for the period April 9-15, 2021.
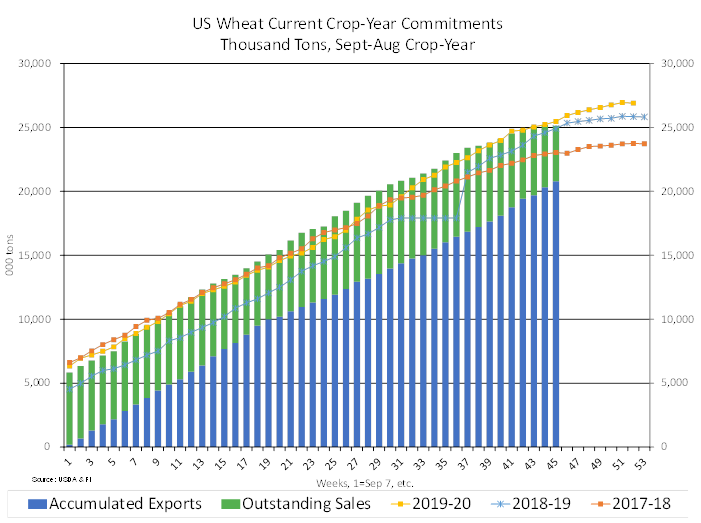
Wheat: Net
sales of 240,200 metric tons (MT) for 2020/2021 were down noticeably from the previous week, but up 55 percent from the prior 4-week average. Increases primarily for Mexico (137,500 MT, including decreases of 800 MT), Taiwan (46,300 MT, including decreases
of 400 MT), Japan (30,300 MT), Italy (11,500 MT, including decreases of 8,000 MT), and the Philippines (11,000 MT), were offset by reductions primarily for Vietnam (9,500 MT), El Salvador (7,000 MT), and Guatemala (3,500 MT). For 2021/2022, net sales of 373,800
MT were primarily for Japan (67,500 MT), unknown destinations (65,500 MT), China (65,000 MT), Mexico (60,200 MT), and Taiwan (51,000 MT). Exports of 561,000 MT were up 20 percent from the previous week and 11 percent from the prior 4-week average. The destinations
were primarily to the Philippines (131,000 MT), Thailand (108,800 MT), China (66,000 MT), South Korea (65,100 MT), and Mexico (57,300 MT).
Optional
Origin Sales:
For 2020/2021, new optional origin sales of 6,500 MT were reported for Spain. The current outstanding balance of 35,500 MT is for Spain.
Corn:
Net sales of 387,500 MT for 2020/2021 were up 18 percent from the previous week, but down 75 percent from the prior 4-week average. Increases primarily for Mexico (366,300 MT, including 36,000 MT switched from unknown destinations and decreases of 1,400 MT
), South Korea (134,600 MT, including 68,000 MT switched from China, 65,000 MT switched from unknown destinations, and decreases of 6,100 MT), Japan (103,500 MT, including 175,700 MT switched from unknown destinations and decreases of 74,800 MT), Colombia
(80,600, including 20,500 MT switched from Panama and decreases of 53,600 MT), and Taiwan (72,800 MT, including 70,000 MT switched from China and decreases of 700 MT), were offset by reductions primarily for unknown destinations (215,800 MT) and China (123,900
MT). For 2021/2022, net sales of 29,500 MT were reported for Mexico (11,200 MT), El Salvador (7,500 MT), Nicaragua (7,500 MT), and Guatemala (3,300 MT). Exports of 1,605,700 MT were down 12 percent from the previous week and 18 percent from the prior 4-week
average. The destinations were primarily to China (560,100 MT), Mexico (321,100 MT), South Korea (265,000 MT – including 69,200 MT – late), Japan (244,800 MT), and Taiwan (83,900 MT).
Optional
Origin Sales:
For 2020/2021, the current outstanding balance of 443,800 MT is for South Korea (213,000 MT), unknown destinations (189,500 MT), the Ukraine (32,400 MT), and China (8,900 MT).
Late
Reporting:
For 2020/2021, exports totaling 69,200 MT of corn were reported late to South Korea.
Barley:
Total net sales of 100 MT for 2020/2021 were up noticeably from the previous week, but down noticeably from the prior 4-week average. Increases were for Canada.
Exports of 500 MT were up 5 percent from the previous week, but down 4 percent from the prior 4-week average. The destinations were Canada (300 MT) and South Korea (200 MT).
Sorghum:
Net sales of 7,000 MT for 2020/2021 were down 99 percent from the previous week and 97 percent from the prior 4-week average. Increases reported for China (130,000 MT, including 68,000 MT switched from unknown destinations
and decreases of 4,800 MT), were offset by reductions for unknown destinations (123,000 MT). For 2021/2022, total net sales of 116,000 MT were for China. Exports of 256,300 MT were down 70 percent from the previous week and 27 percent from the prior 4-week
average. The destination was China.
Rice:
Net sales of 96,900 MT for 2020/2021 were up noticeably from the previous week and from the prior 4-week average. Increases were primarily for Mexico (37,600 MT), Venezuela (28,600 MT, including decreases of 800 MT), the Dominican Republic (11,000 MT), Honduras
(5,400 MT), and Guatemala (5,400 MT). Exports of 93,000 MT were up noticeably from the previous week and from the prior 4-week average. The destinations were primarily to Venezuela (55,600 MT), the Dominican Republic (19,700 MT), Mexico (3,900 MT), Canada
(3,000 MT), and South Korea (3,000 MT).
Exports
for Own Account:
For 2020/2021, new exports for own account totaling 100 MT were for Canada. The current exports for own account outstanding balance is 100 MT, all Canada.
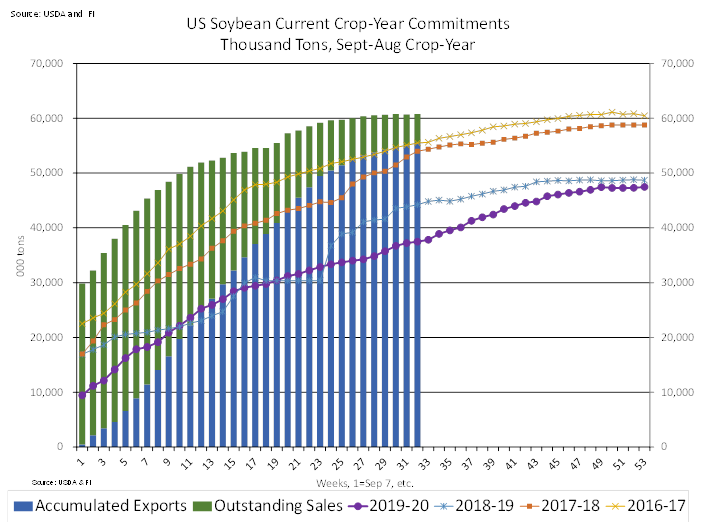
Soybeans:
Net sales of 64,300 MT for 2020/2021 were down 29 percent from the previous week, but up 25 percent from the prior 4-week average. Increases primarily for Japan (58,200 MT, including 37,200 MT switched from unknown destinations and decreases of 1,500 MT),
Bangladesh (55,000 MT), Indonesia (14,800 MT, including decreases of 600 MT), Canada (10,300 MT), and Colombia (8,300 MT), were offset by reductions primarily for China (51,200 MT) and unknown destinations (37,200 MT). For 2021/2022, net sales of 315,300
MT were primarily for Pakistan (130,000 MT), unknown destinations (130,000 MT), and Bangladesh (55,000 MT). Exports of 226,400 MT–a marketing-year low–were down 45 percent from the previous week and 47 percent from the prior 4-week average. The destinations
were primarily to Mexico (74,000 MT), Japan (69,400 MT), China (25,500 MT), Indonesia (19,400 MT), and Taiwan (11,500 MT).
Exports
for Own Account:
For 2020/2021, the current exports for own account outstanding balance is 5,800 MT, all Canada.
Soybean
Cake and Meal:
Net sales of 124,300 MT for 2020/2021 were up 74 percent from the previous week, but down 2 percent from the prior 4-week average. Increases primarily for Mexico (32,500 MT, including decreases of 100 MT), Nicaragua (23,300 MT, including 8,300 MT switched
from Honduras), Ecuador (22,500 MT), Canada (20,400 MT, including decreases of 300 MT), and the Dominican Republic (13,500 MT, including decreases of 2,100 MT), were offset by reductions primarily for El Salvador (4,800 MT), Honduras (3,000 MT), Panama (2,000
MT), and Belgium (1,800 MT). For 2021/2022, net sales of 8,200 MT resulting in increases for Canada (8,300 MT), were offset by reductions for El Salvador (100 MT). Exports of 202,000 MT were down 2 percent from the previous week and 19 percent from the prior
4-week average. The destinations were primarily to the Philippines (51,500 MT), Mexico (42,400 MT), Venezuela (36,500 MT, including 27,500 MT – late), Canada (25,700 MT), and Morocco (18,900 MT).
Late
Reporting:
For 2020/2021, exports totaling 27,500 MT of soybean cake and meal were reported late to Venezuela.
Soybean
Oil:
Net sales of 5,700 MT for 2020/2021 were down noticeably from the previous week and down 28 percent from the prior 4-week average. Increases were primarily for Jamaica (3,500 MT), the Dominican Republic (1,500 MT), Canada (400 MT), and Mexico (200 MT). Exports
of 9,900 MT were up 20 percent from the previous week and 4 percent from the prior 4-week average. The destinations were primarily to the Dominican Republic (4,000 MT), Jamaica (3,500 MT), Canada (1,000 MT), Guatemala (700 MT), and Mexico (600 MT).
Cotton:
Net sales of 103,100 RB for 2020/2021 were down 16 percent from the previous week and 44 percent from the prior 4-week average. Increases primarily for China (38,600 RB), Vietnam (22,600 RB, including 2,200 RB switched from Hong Kong, 300 RB switched from
China, and decreases of 5,400 RB), Turkey (18,600 RB), Indonesia (9,500 RB, including decreases of 100 RB), and Pakistan (7,500 RB, including 3,700 RB switched from Turkey, 800 RB switched from India, and decreases of 200 RB), were offset by reductions for
Hong Kong (2,200 RB) and Thailand (1,800 RB). For 2021/2022, net sales of 42,800 RB were primarily for China (15,400 RB), South Korea (13,200 RB), Vietnam (5,300 RB), Turkey (4,400 RB), and Peru (4,000 RB). Exports of 329,000 RB were up 5 percent from the
previous week, but down 1 percent from the prior 4-week average. Exports were primarily to Vietnam (85,800 RB), China (64,600 RB), Pakistan (43,200 RB), Turkey (36,300 RB), and Mexico (25,000 RB). Net sales of Pima totaling 6,700 RB were up noticeably from
the previous week and up 22 percent from the prior 4-week average. Increases were reported for India (3,800 RB, including decreases of 300 RB), Peru (2,300 RB), Bahrain (400 RB), and Japan (200 RB). Exports of 19,600 RB were up 19 percent from the previous
week and 27 percent from the prior 4-week average. The destinations were primarily to India (4,600 RB), Vietnam (3,700 RB), China (3,500 RB), Peru (3,400 RB), and Bangladesh (1,300 RB).
Exports
for Own Account:
For 2020/2021, exports for own account totaling 3,000 RB to China (1,500 RB), Vietnam (1,300 RB), and Bangladesh (200 RB) were applied to new or outstanding sales. The current exports for own account outstanding balance of 26,200 RB is for China (21,300 RB),
Vietnam (4,500 RB), and Bangladesh (400 RB).
Hides
and Skins:
Net sales of 358,300 pieces for 2021 were up 27 percent from the previous week, but down 10 percent from the prior 4-week average. Increases primarily for China (198,300 whole cattle hides, including decreases of 6,700 pieces), South Korea (70,400 whole cattle
hides, including decreases of 1,600 pieces), Mexico (41,000 whole cattle hides, including decreases of 300 pieces), Thailand (20,700 whole cattle hides, including decreases of 700 pieces), and Japan (11,000 whole cattle hides), were offset by reductions for
Turkey (200 pieces), Vietnam (200 pieces), and Brazil (100 pieces). Total net sales of 500 kip skins (including decreases of 500 kip skins) were for Belgium.
Exports
of 378,100 pieces for 2021 were down 6 percent from the previous week and 3 percent from the prior 4-week average. Whole cattle hides exports were primarily to China (243,600 pieces), South Korea (53,600 pieces), Mexico (34,200 pieces), Thailand (22,500 pieces),
and Taiwan (7,800 pieces). Exports of 1,800 kip skins were to Belgium (1,300 kip skins) and China (500 kip skins).
Net
sales of 72,200 wet blues for 2021 were up 13 percent from the previous week, but down 50 percent from the prior 4-week average. Increases reported for Thailand (32,300 unsplit, including decreases of 300 unsplit), China (22,600 unsplit), Vietnam (10,400
unsplit), Mexico (6,000 unsplit, including decreases of 300 grain splits), and Brazil (1,300 unsplit), were offset by reductions primarily for Taiwan (100 unsplit). Exports of 136,000 wet blues for 2021 were up 35 percent from the previous week and 12 percent
from the prior 4-week average. The destinations were primarily to China (44,800 unsplit), Vietnam (29,400 unsplit), Italy (17,700 unsplit and 6,400 grain split), Mexico (18,000 grain splits and 3,400 unsplit), and Thailand (6,900 unsplit). Net sales of 345,800
splits were for Vietnam (252,200 pounds) and China (93,600 pounds). Exports of 517,900 pounds were to Vietnam (440,000 pounds) and China (77,900 pounds).
Beef:
Net
sales of 24,600 MT reported for 2021 were up 57 percent from the previous week and 38 percent from the prior 4-week average. Increases primarily for South Korea (7,800 MT, including decreases of 500 MT), Japan (6,200 MT, including decreases of 700 MT), China
(3,100 MT, including decreases of 100 MT), Mexico (2,100 MT, including decreases of 100 MT), and Taiwan (1,900 MT, including decreases of 200 MT),
were
offset by reductions primarily for Italy (100 MT).
Exports of 19,500 MT were up 2 percent from the previous week and 4 percent from the prior 4-week average. The destinations were primarily to South Korea (6,100 MT), Japan (4,900 MT), China (3,600 MT), Mexico (1,400 MT), and Taiwan (1,100 MT).
Pork:
Net
sales reductions of 22,100 MT reported for 2021–a marketing-year low–were down noticeably from the previous week and from the prior 4-week average. Increases were primarily for China (13,100 MT, including decreases of 1,700 MT), Japan (2,700 MT, including
decreases of 100 MT), South Korea (1,500 MT, including decreases of 200 MT), Australia (1,500 MT, including decreases of 700 MT), and Canada (1,100 MT, including decreases of 800 MT), were offset by reductions for Mexico (45,100 MT – including 54,476 MT canceled).
Exports of 43,900 MT–a marketing-year high–were up 14 percent from the previous week and 13 percent from the prior 4-week average. The destinations were primarily to Mexico (13,800 MT), China (13,400 MT), Japan (3,900 MT), South Korea (2,900 MT), and the
Philippines (2,000 MT).
Data
Cancelation:
Due to an error in exporter(s) reporting, exports of 54,476 MT of pork were not reported properly in marketing year 2020. To correct marketing year 2021 figures a cancelation of 54,476 MT has been reported this week to remove the portion that should have
been reported in 2020.
April
22, 2021 1 FOREIGN AGRICULTURAL SERVICE/USDA
U.S. EXPORT SALES FOR WEEK ENDING 4/15/2021
|
|
CURRENT MARKETING YEAR |
NEXT MARKETING YEAR |
||||||
|
COMMODITY |
NET SALES |
OUTSTANDING SALES |
WEEKLY EXPORTS |
ACCUMULATED EXPORTS |
NET SALES |
OUTSTANDING SALES |
||
|
CURRENT YEAR |
YEAR |
CURRENT YEAR |
YEAR |
|||||
|
|
THOUSAND METRIC TONS |
|||||||
|
WHEAT |
|
|
|
|
|
|
|
|
|
HRW |
74.1 |
1,102.1 |
1,500.7 |
118.4 |
7,518.7 |
8,134.8 |
162.2 |
644.7 |
|
SRW |
2.6 |
245.6 |
256.9 |
16.4 |
1,528.9 |
2,139.8 |
53.0 |
530.6 |
|
HRS |
158.7 |
1,271.0 |
1,269.1 |
138.8 |
6,409.1 |
6,152.9 |
56.0 |
589.0 |
|
WHITE |
12.7 |
1,332.7 |
840.0 |
286.9 |
5,296.9 |
4,249.8 |
102.6 |
585.0 |
|
DURUM |
-8.0 |
69.7 |
179.0 |
0.4 |
594.9 |
741.2 |
0.0 |
5.0 |
|
TOTAL |
240.2 |
4,021.0 |
4,045.8 |
561.0 |
21,348.6 |
21,418.6 |
373.8 |
2,354.2 |
|
BARLEY |
0.1 |
4.5 |
10.8 |
0.5 |
24.7 |
38.8 |
0.0 |
20.2 |
|
CORN |
387.5 |
27,805.3 |
13,740.0 |
1,605.7 |
39,393.0 |
21,582.4 |
29.5 |
2,131.6 |
|
SORGHUM |
7.0 |
1,943.8 |
1,529.1 |
256.3 |
5,107.0 |
1,705.3 |
116.0 |
1,136.0 |
|
SOYBEANS |
64.3 |
5,102.5 |
4,799.5 |
226.4 |
55,724.4 |
33,022.8 |
315.3 |
6,191.6 |
|
SOY MEAL |
124.3 |
2,142.7 |
2,503.2 |
202.0 |
7,117.2 |
6,738.6 |
8.2 |
289.1 |
|
SOY OIL |
5.7 |
101.9 |
301.5 |
9.9 |
557.2 |
665.1 |
0.0 |
0.6 |
|
RICE |
|
|
|
|
|
|
|
|
|
L G RGH |
79.7 |
319.9 |
291.8 |
58.1 |
1,183.3 |
1,093.8 |
0.0 |
0.0 |
|
M S RGH |
0.0 |
5.3 |
23.5 |
0.0 |
23.5 |
53.0 |
0.0 |
0.0 |
|
L G BRN |
0.3 |
3.0 |
17.3 |
0.5 |
35.2 |
42.5 |
0.0 |
0.0 |
|
M&S BR |
0.3 |
68.5 |
57.6 |
0.4 |
86.1 |
51.8 |
0.0 |
0.0 |
|
L G MLD |
12.3 |
52.7 |
60.8 |
24.9 |
483.7 |
710.4 |
0.0 |
0.0 |
|
M S MLD |
4.3 |
247.2 |
224.9 |
9.2 |
402.1 |
461.9 |
0.0 |
0.0 |
|
TOTAL |
96.9 |
696.5 |
675.9 |
93.0 |
2,214.0 |
2,413.5 |
0.0 |
0.0 |
|
COTTON |
|
THOUSAND RUNNING BALES |
||||||
|
UPLAND |
103.1 |
4,586.8 |
5,427.0 |
329.0 |
10,485.4 |
9,692.1 |
42.8 |
1,657.5 |
|
PIMA |
6.7 |
207.2 |
156.2 |
19.6 |
549.4 |
387.4 |
0.0 |
1.1 |
Terry Reilly
Senior Commodity Analyst – Grain and Oilseeds
Futures International
One Lincoln Center
18 W 140 Butterfield Rd.
Oakbrook Terrace, Il. 60181
W: 312.604.1366
ICE IM:
treilly1
Skype: fi.treilly

Trading of futures, options, swaps and other derivatives is risky and is not suitable for all persons. All of these investment products are leveraged, and you can lose more than your initial deposit. Each investment product is offered
only to and from jurisdictions where solicitation and sale are lawful, and in accordance with applicable laws and regulations in such jurisdiction. The information provided here should not be relied upon as a substitute for independent research before making
your investment decisions. Futures International, LLC is merely providing this information for your general information and the information does not take into account any particular individual’s investment objectives, financial situation, or needs. All investors
should obtain advice based on their unique situation before making any investment decision. The contents of this communication and any attachments are for informational purposes only and under no circumstances should they be construed as an offer to buy or
sell, or a solicitation to buy or sell any future, option, swap or other derivative. The sources for the information and any opinions in this communication are believed to be reliable, but Futures International, LLC does not warrant or guarantee the accuracy
of such information or opinions. Futures International, LLC and its principals and employees may take positions different from any positions described in this communication. Past results are not necessarily indicative of future results.