PDF Attached
US
inflation was reported slightly above expectations. The consumer price index increased 1.0% last month after gaining 0.3% in April, the Labor Department said on Friday. Economists polled by Reuters had forecast the monthly CPI picking up 0.7%.
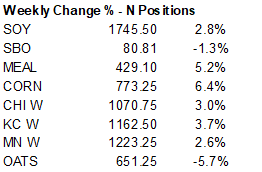

USDA
released their June supply and demand estimates
Reaction:
Slightly
bullish soybeans but the trade had that worked in. Bearish corn and neutral wheat. Bottom picking from longs looking to get back into the market lifted grains higher shortly after the report was released. Soybeans were lower on buy the rumor, sell the fact
over exports. Soybean oil is lower on product spreading and weakness in palm oil.
USDA
NASS briefing
https://www.nass.usda.gov/Newsroom/Executive_Briefings/index.php
USDA
OCE Secretary’s Briefing
https://www.usda.gov/oce/commodity-markets/wasde/secretary-briefing
US
soybean supply was unchanged for new crop. Old crop stocks were trimmed 30 million bushels with an increase in US 2021-22 export by 30 million to 2.170 billion. All other demand categories were unchanged. USDA cited lower Brazil export for the change in US
exports. USDA made no changes in its 2022-23 demand. With a lower carry in, USDA lowered new-crop stocks by 30 million to 280 million. The soybean price is forecast at $14.70 per bushel, up 30 cents from last month. Global oilseed production for 2022-23 was
lowered 0.3 million tons to 646.8 million as lower sunflower seed is partly offset by higher rapeseed and soybean output. Global 2022-23 soybean ending stocks were raised 0.9 million tons to 100.5 million. The took 2021-22 Argentina soybean production up 1.4
million tons to 43.4 million and 2021-22 Brazil soybean production up 1.0 million tons to 126.0 million.
2021-22
US corn ending stocks was perhaps the largest surprise, with a 45 million bushel increase to 1.485 billion. USDA lowered current crop year exports by 50 million bushels based on current inspections and Census data. USDA export sales commitments are also lagging.
USDA increased food, seed, and industrial use (FSI) by 5 million bushels, citing higher use for glucose and dextrose and starch, partially offset by a decline in high fructose corn syrup. USDA also increased its projection for 2022-23 FSI by 5 million. There
was no other changes in new-crop US corn demand. Supply was unchanged. USDA will release its Acreage report on June 30. New crop ending stocks were raised 40 million bushels. World corn production was increased 5.1 million tons. Corn production was up for
Ukraine, reflecting higher area. Global corn ending stocks were estimated at 310.5 million tons, up 5.3 million from May.
2022-23
US wheat production was upward revised 8 million bushels to 1.737 billion with an increase in winter wheat by that amount. USDA reduced Hard Red Winter and raised Winter White and Soft Red Winter. Combined other spring and durum was unchanged. Some of the
trade was looking for a downward revision in other spring. US domestic use and exports were unchanged resulting in higher stocks by 8 million to 627 million. The all-wheat yield was upward revised 0.3 bushel to 46.9 bushels per acre. USDA lowered global wheat
production due to a 2.5 million ton decrease for India, partially offset by an upward revision to Russia by 1 million tons to 81 million tons. World consumption was reduced by 1.5 million tons in large part to less feed use. USDA lowered India’s exports and
raised Russia. Projected 2022-23 world ending stocks were lowered 0.2 million tons to 266.9 million, a six-year low.
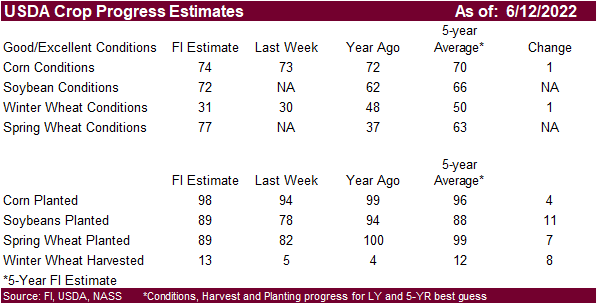
US
temperatures will be above normal starting next week.
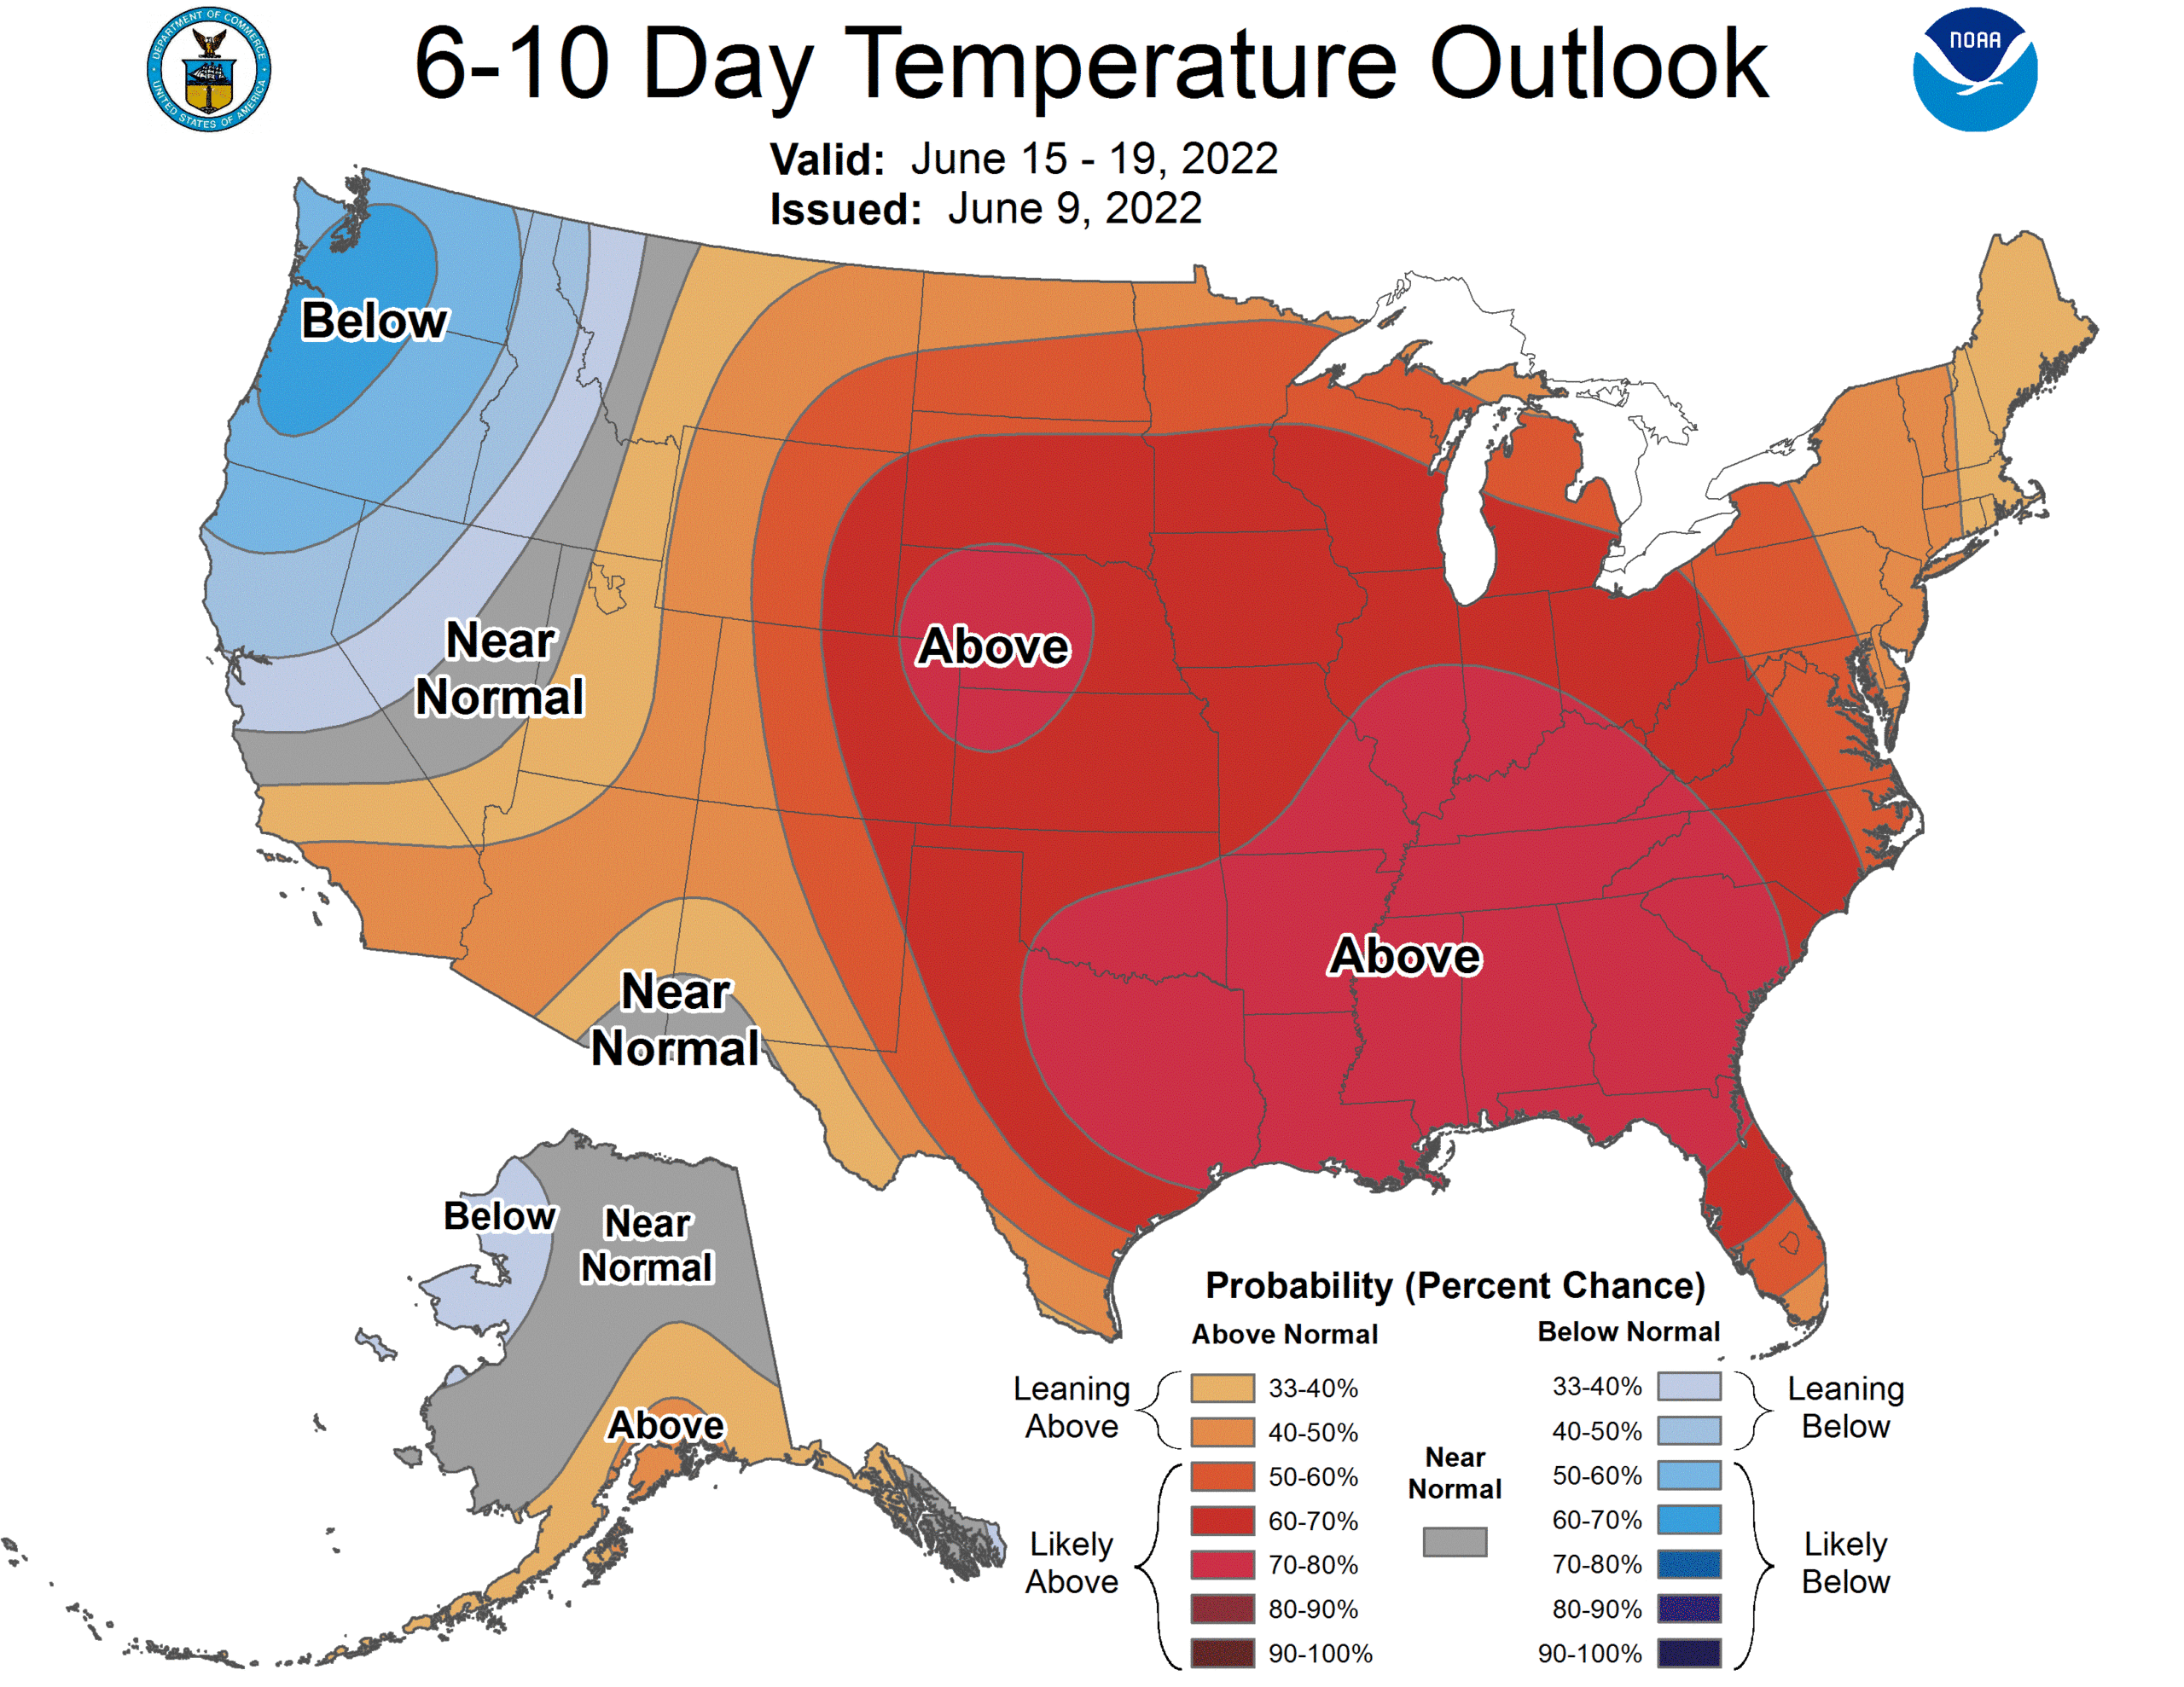
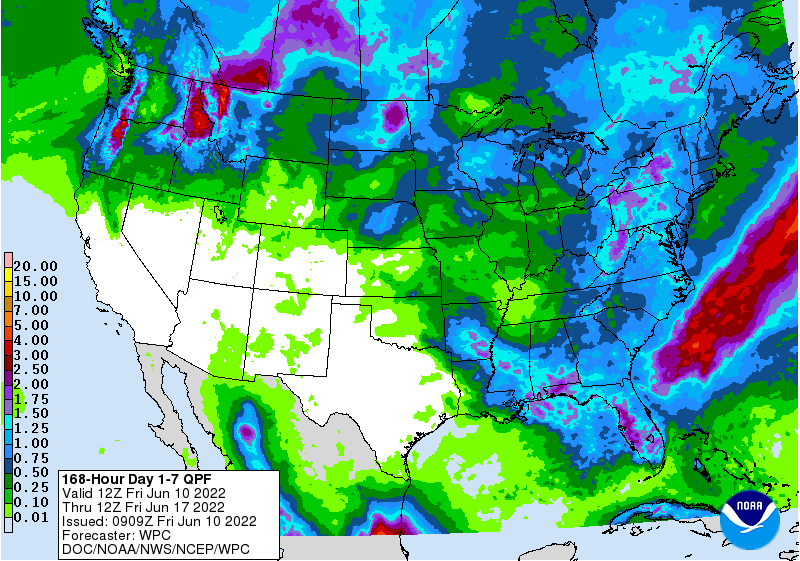
Past
7 days
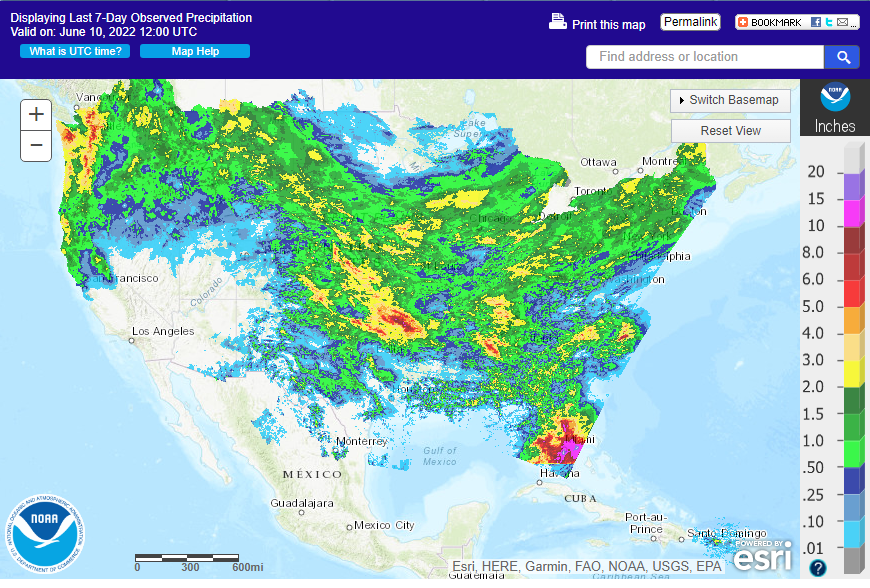
WORLD
WEATHER HIGHLIGHTS FOR JUNE 10, 2022
- Canada’s
Prairies will receive much needed rain in the drought stricken areas early next week and again about a week later - Relief
is expected and improvement in crop conditions will result - Eastern
Canada’s Prairies will experience rain today into Tuesday that will bring fieldwork to a halt - Some
progress may resume later next week, but more rain is expected a few days later which may limit additional progress for late season crops - West
Texas cotton areas will be hot and dry through much of the next ten days with some strong wind speeds at times - This
pattern will reverse the improving trend from earlier this month and in late May - U.S.
Midwest weather will remain favorable for crop development and fieldwork for a while, but the lower half of the region as well as the southern Plains and Delta will experience net drying that will become important in weeks 2 , 3 and 4 - Timely
rain will become very important those later weeks to prevent a more significant bout of drying from occurring - The
tropical cyclone the GFS continues to carry in its second week outlook may not verify, but remember that is presence influences that model in the second week of the forecast and can skew the forecast
- Argentina’s
western wheat areas will continue dry over the next ten days; rain is going to be needed in some eastern areas too soon - Southern
Brazil will remain wet biased for a little while longer and drying will be needed to promote Safrinha crop maturation and harvesting - Europe
will trend drier over the next ten days especially in the west; France, the U.K. and Germany in particular - Portions
of southern Europe are still dry and unlikely to get much relief. - The
lower Danube River Basin will get some rain and that is one of the driest areas - Irrigated
fields will develop normally, but some dryland areas in southern Europe, including southern France, will need significant rain soon to support summer crops - Russia’s
Southern Region, eastern Ukraine and western Kazakhstan are predicted to get a little rain after day 10, but until then net drying will continue raising concern about crop conditions as the soil dries out - Confidence
in the second week rainfall is low, but not out of the realm of possibilities - China’s
North China Plain is still expected to get a little rainfall during the next couple of weeks, but it may prove to be infrequent and light enough to leave some long term worry over unirrigated crops in the region - Northeast
China is quite wet and would benefit from some net drying - Southern
China’s heavy rain will stay near the south coast for a while, but concern over early rice production will continue and sugarcane needs drier weather along with some minor corn, soybeans and groundnuts in the region - Western
Australia will still get some needed rain over the next few days improving topsoil moisture for wheat, barley and canola
Source:
World Weather Inc.
Bloomberg
Ag Calendar
- USDA
export inspections – corn, soybeans, wheat, 11am - US
crop planting data for soybeans and cotton; winter wheat condition and harvesting, 4pm - US
cotton, corn, soybean and spring wheat conditions, 4pm - HOLIDAY:
Australia, Russia
Tuesday,
June 14:
- EU
weekly grain, oilseed import and export data - New
Zealand Food Prices
Wednesday,
June 15:
- EIA
weekly U.S. ethanol inventories, production, 10:30am - Malaysia’s
June 1-15 palm oil export data - St
Petersburg International Economic Forum, June 15-18
Thursday,
June 16:
- USDA
weekly net-export sales for corn, soybeans, wheat, cotton, pork and beef, 8:30am - HOLIDAY:
Brazil, South Africa
Friday,
June 17:
- ICE
Futures Europe weekly commitments of traders report - CFTC
commitments of traders weekly report on positions for various U.S. futures and options, 3:30pm - FranceAgriMer
weekly update on crop conditions
Saturday,
June 18:
- China’s
second batch of May trade data, including corn, pork and wheat imports
Source:
Bloomberg and FI
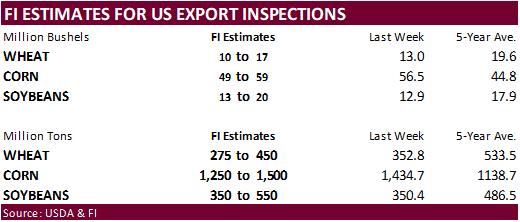
The
Commitment of Traders report showed funds reduced their net long position for soybeans instead of extending it, as expected. Funds were less long than expected for corn and soybean oil and added more contracts than expected for soybean meal.


Reuters
table
SUPPLEMENTAL
Non-Comm Indexes Comm
Net Chg Net Chg Net Chg
Corn
184,445 -8,074 457,765 -9,333 -597,179 19,636
Soybeans
83,586 -6,728 189,903 -858 -244,204 7,556
Soyoil
47,258 3,111 103,970 -4,672 -167,965 2,430
CBOT
wheat -40,555 -6,484 148,365 -1,632 -104,037 8,437
KCBT
wheat 6,750 -2,815 63,770 878 -69,082 3,644
FUTURES
+ OPTS Managed Swaps Producer
Net Chg Net Chg Net Chg
Corn
264,327 -4,638 275,392 -4,264 -594,145 19,555
Soybeans
158,928 -5,702 107,998 -4,247 -242,071 9,600
Soymeal
53,169 5,808 88,293 -2,701 -192,877 -2,074
Soyoil
68,823 4,363 82,228 -3,985 -176,363 1,430
CBOT
wheat 12,675 -2,349 54,902 -4,676 -76,934 7,877
KCBT
wheat 37,498 -3,152 28,272 893 -61,519 3,245
MGEX
wheat 13,922 -1,601 174 -721 -25,238 1,255
———- ———- ———- ———- ———- ———-
Total
wheat 64,095 -7,102 83,348 -4,504 -163,691 12,377
Live
cattle 21,350 9,265 70,339 -671 -107,902 -9,259
Feeder
cattle -4,906 4,108 4,553 -281 4,454 -1,611
Lean
hogs 22,473 3,982 54,281 2,403 -66,278 -3,523
Other NonReport Open
Net Chg Net Chg Interest Chg
Corn
99,459 -8,427 -45,032 -2,228 2,217,675 4,735
Soybeans
4,427 319 -29,283 29 979,103 15,985
Soymeal
22,686 1,801 28,728 -2,834 429,842 10,926
Soyoil
8,574 -939 16,737 -869 471,053 24,532
CBOT
wheat 13,130 -531 -3,773 -320 462,463 8,078
KCBT
wheat -2,812 721 -1,438 -1,707 205,338 130
MGEX
wheat 4,068 -507 7,074 1,574 73,168 -4,170
———- ———- ———- ———- ———- ———-
Total
wheat 14,386 -317 1,863 -453 740,969 4,038
Live
cattle 21,437 898 -5,224 -231 349,418 -21,325
Feeder
cattle 1,022 655 -5,122 -2,871 57,468 -1,154
Lean
hogs -2,145 -2,214 -8,331 -648 264,832 2,851
Macros
US
CPI (Y/Y) SA May: 8.6% (est 8.3%, prev 8.3%)
US
CPI (M/M) SA May: 1% (est 0.7%, prev 0.3%)
CPI
Ex Food And Energy (Y/Y) May: 6% (est 5.9%, prev 6.2%)
CPI
Ex Food And Energy (M/M) May: 0.6% (est 0.5%, prev 0.6%)
Canada
Employment Change May: 39.8K (est 30K, prev 15.3K)
Unemployment
Rate May: 5.1% (est 5.2%, prev 5.2%)
Participation
Rate May: 65.3% (est 65.3%, prev 65.3%)
US
EIA Expects Refinery Utilization To Average 96% In June, 94% In July, And 96% In August
US
Univ. Of Michigan Sentiment Jun P: 50.2 (est 58.1; prev 58.4)
–
Current Conditions: 55.4 (est 62.9; prev 63.3)
–
Expectations: 46.8 (est 55.3; prev 55.2)
–
1-Year Inflation: 5.4% (est 5.3%; prev 5.3%)
–
5-10 Year Inflation: 3.3% (prev 3.0%)
·
US corn futures initially traded lower after hitting a two-week high on Thursday. Post USDA report prices traded two-sided. The dip in corn prices attracted longs to the market. USDA made no changes to their area or yield numbers
in its monthly update for corn and soybeans. 2021-22 US corn ending stocks were upward revised 45 million bushels due in part to a 50 million bushel cut in corn exports. USDA export sales for corn were poor yesterday and US weather looks good, with exception
to hot temperatures expected next week across the heart of the US. Some crop stress is expected.
·
Funds bought an estimated net 1,000 corn contracts.
·
For those following options, there were rumors that the heavy corn call spreads done today was some large weather group hedging.
·
US equity markets were down sharply mainly on a bearish US inflation report. Up 8.6%, US inflation is at another 40-year high.
·
The Baltic Dry Index fell for the third consecutive week on weakness in smaller vessels. The index was down 12% for the week.
·
In China’s month S&D update, there were no changes to supply or demand for corn and soybeans. China mentioned corn for feed demand was increasing while wheat feed was decreasing.
·
Indian state oil retailers have agreed to provide some monetary relief to sugar mills and other producers of ethanol to compensate for high energy costs in support to use more biofuels.
·
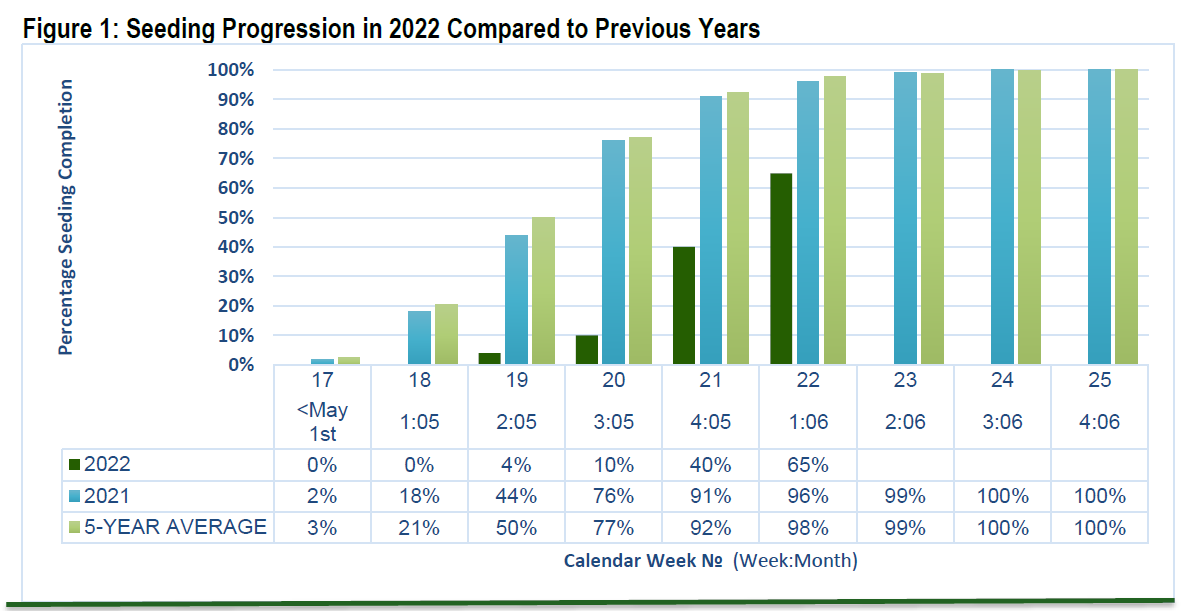
Manitoba, Canada, crop report: Provincial seeding progress sits at 65% completion, behind the 5-year average of 96% for Week 22 remains highly variable within each region, and many wet spots and low-lying areas are left unseeded
in an effort to maximize equipment planting time.
Export
developments.
·
China looks to buy 40,000 tons of frozen pork on June 10.
Updated
6/9/22
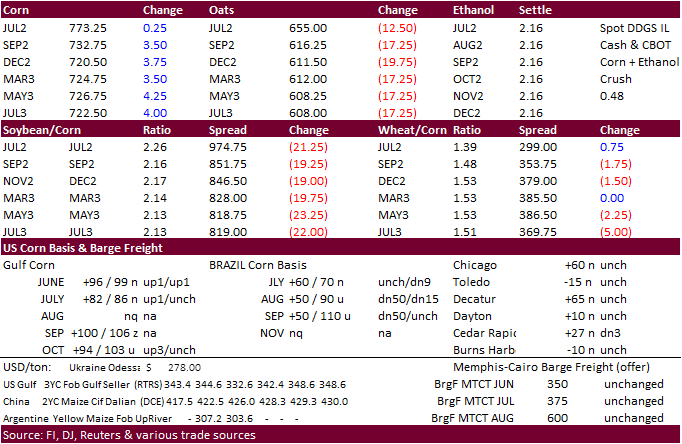
July
corn is seen in a $7.25 and $8.25 range
December
corn is seen in a wide $5.75-$8.50 range
