PDF Attached
USDA
quarterly reports were released. USDA reported a US soybean area well below March Intentions and the average trade guess, largest surprise in USDA’s Acreage and Grain Stocks reports. Soybean futures shot up after the report release and remained in a volatile
two-sided trade thereafter. USDA’s new-crop planted and harvested area indicates a tighter new-crop US soybean carryout, while current crop-year wheat and new-crop corn should yield higher supplies, if USDA leaves their current yield estimates unchanged from
June. On this day a year ago, the markets made their high for the season. The weather outlook is slightly more favorable for the US Midwest & Delta, Canadian Prairies, and northern China. The WCB will see rain July 3-4 and ECB the 5th and 6th. Rain expected
for parts of the Great Plains over the next week.
![]()
USDA
released their June Acreage and Grain Stocks reports
Reaction:
Bullish
soybeans as plantings came in well below expectations, were 2.6 million below March Intentions, and with a reduction in harvested area, implied production using USDA’s current yield would suggest production falls short of the June USDA’s S&D by 133 million
bushels. USDA may reduce new-crop soybean exports in the July S&D but look for stocks to tighten at least 50 million bushels. We believe wheat and corn acreage was slightly negative for new-crop corn and current year wheat futures. Implied corn production
would suggest 43 million additional bushels and all wheat an addition of 27 million bushels. The higher wheat supply is due to a higher-than-expected spring and durum wheat area. The winter wheat area was downward revised. Total acreage for the main 8 crops
(grains/oilseeds, rice, and cotton) were 251.9 million acres, 2.3 million below March Intentions. It appears higher input costs such as fuel and fertilizer, coupled with poor planting weather for selected parts of the country, impacted US producer planting
decisions. We never thought the soybean area would drop as much as it did based on mid-June planting progress. See attached scatter – March to June area change versus planting progress.
Grain
stocks at the beginning of June were near expectations for all three major commodities, which was surprising as the national cash prices for all the major commodities are near multi-year highs. However, looking at corn, March 1 corn stocks were downward revised
a large 94 million bushels, and implies corn use (feed) was better than expected for the second quarter. Feed demand was less than expected for the third quarter. This leaves us to question summer quarter feed demand, which is seen weaker from last quarter
given the amount of feed wheat coming online. USDA could leave unchanged their feed use for 2021-22 US corn balance sheet when updated July 11.
We
like Aug soybean / November bear spreads, and September / December small size bear spreads. With USDA revisiting planted area for some northern states, there is a potential NASS could revise the spring wheat and durum area, and trim corn and to a lessor extend
soybeans.
USDA
NASS briefing
https://www.nass.usda.gov/Newsroom/Executive_Briefings/index.php
WEATHER
EVENTS AND FEATURES TO WATCH
-
U.S.
Midwest rainfall was minimal Wednesday and temperatures were seasonable in the east and warmer than usual in the west -
South
Dakota and Nebraska were hottest with highs in the 90s to 105 degrees Fahrenheit -
Some
of the warmth in the U.S. Plains and western Corn Belt will attempt to shift east today, but cooler air moving south from Canada will squelch the heat by Friday afternoon and temperatures during the holiday weekend will be mostly in a seasonable range
-
Another
bout of warming is expected in the U.S. Midwest and Plains next week, but no excessive heat is expected outside of the central and southern Great Plains where some 90- and lower 100-degree heat is possible infrequently -
Southwestern
parts of the Corn Belt may be hottest for the longest period next week -
Scattered
showers and thunderstorms are still advertised over the next couple of weeks in the Midwest, Delta and southeastern states, but the distribution of meaningful rain may be a little disappointing for some areas -
Concern
over low eastern U.S. Midwest soil moisture will continue through Monday -
This
includes Michigan, Indiana, Ohio, Illinois and parts of western Kentucky and southeastern Missouri as well as the northern Delta -
Most
of these areas are already dry and need significant rain -
The
need for moisture will be enhanced by the start of next week adding pressure on weather changes advertised for next week and the week after -
Southwestern
U.S. Corn Belt gets important rain Friday night through Sunday with 0.50 to 2.00 inches of moisture and possibly a little more -
Net
drying should then occur in those areas through July 15 -
Eastern
U.S. Midwest precipitation will be greatest during the July 5-15 period, although no big, generalized rain is expected -
The
rain will be very important for stopping the decline in crop and field conditions that will occur through this weekend from southern Wisconsin and Michigan into northern and east-central Illinois, Indiana and Michigan -
Northern
U.S. Delta rainfall will be restricted through the weekend and then it may improve for a little while next week -
A
favorable mix of rain and sun will impact the southeastern U.S. over the next couple of weeks -
West
Texas rainfall will continue restricted over the next two weeks leaving a need for greater rain to support both dryland and irrigated fields of cotton, corn and sorghum -
South
Texas and northeastern Mexico will remain in a drought for the next ten days, despite some showers -
Canada’s
Prairies will experience a mix of rain and sunshine with parts of central Alberta staying too wet while southwestern Saskatchewan dries out for a while -
Most
of the Prairies will see favorable crop development, although greater rain will be needed in the south-central and southwestern parts of Saskatchewan as well as a few central locations -
Drought
will intensify in parts of the U.S. Pacific Northwest and in particular the Snake River system, but Yakima Valley, central parts of Oregon and some areas in Wyoming -
Argentina
will continue too dry for winter wheat emergence and establishment mostly in the west for at least the next ten days -
Southern
Brazil, Uruguay, southern Paraguay and far northeastern Argentina will get rain periodically to support winter crops -
Dry
weather in Safrinha corn and cotton areas of Brazil will be good for maturation and harvest progress -
Potential
Tropical Cyclone Two is expected to become a tropical storm today while moving away from northern Colombia -
Venezuela
weather has already begun to improve -
The
storm will produce heavy rain in Central America late Friday through the weekend with the storm impacting Nicaragua and northern Costa Rica most significantly -
Remnants
of this storm will then move parallel to the Pacific Coast of Central America and eventually the lower west coast of South America during the late weekend into early next week -
Rain
in Nicaragua and northern Costa Rica will vary from 5.00 to 15.00 inches with a few amounts to 20.00 inches near the easterly slow of the mountains -
Damage
to personal property and agricultural is expected -
Losses
to corn and rice is most likely with a little negative impact on sugarcane -
Coffee
plantations are not expected to be seriously influenced by the storm except for the heavy rainfall and local flooding nearby -
Europe
weather will include scattered showers for much of the coming week to ten days, but the distribution of rain will not be ideal leaving need for more rain eventually -
Net
drying is expected in the France and other western European nations through the weekend, despite some showers -
Recent
rain in France improved topsoil moisture -
Spain,
Portugal, Peninsular Italy and portions of the Balkan Countries will also experience net drying over the next ten days, despite a few showers -
Temperatures
in eastern Europe remained quite warm Wednesday with many highs in the upper 80s and lower to middle 90s Fahrenheit -
The
heat accelerated drying in parts of the region which raises the need for rain in some areas
-
Areas
from Hungary to the lower Danube River Basin are driest -
Eastern
Europe temperatures will cool down periodically during this first week of the outlook -
Far
western Europe may be just slightly cooler biased -
Second
week temperatures will be warmer than usual in the west and closer to normal in the east -
Europe
rainfall Tuesday was restricted western France and in areas from Austria and southeastern Germany to western Poland where rainfall varied from 0.40 to 1.00 inch -
Local
totals over 2.00 inches were also noted -
Other
areas were mostly dry with accelerated drying in the east -
Western
CIS weather will be favorably mixed with sunshine and rain during the next two weeks -
Temperatures
will be warmer than usual in this first week of the outlook -
The
warmer weather will shift into the New Lands during the second week of the forecast as rain increases and cooling begins in the west -
Russia’s
Southern Region away from the Black Sea coast and the Georgia border will continue to dry out along with eastern Ukraine -
These
areas will need greater rain and sooner rather than later because the ground is already dry -
A
few showers will be possible Friday into the weekend in the lower Volga River Valley and western Kazakhstan, but resulting rainfall may not change the moisture profile
-
Temperatures
will be mild to cool for a little while which will help to conserve soil moisture
-
Warmer
temperatures will occur this weekend into next week that may exacerbate the dryness and raise the need for significant moisture -
Some
greater crop stress will be possible as the region heats up -
The
bottom line for the CIS is mostly good, but dryness will remain in parts of Russia’s Southern Region (away from the Georgia Border and away from the Black Sea coast) as well as eastern Ukraine. These areas will need greater rain -
China’s
North China Plain will experience a good mix of weather during the next two weeks supporting improved crop development after a dry late May and early to mid-June
-
Southern
China’s weather has been improving since torrential rain ended last week, but Tropical Storm Chaba may bring excessive rain to western Guangdong and Guangxi during the weekend and early next week
-
Southern
China weather will resume a more normal distribution of rain and sunshine next week after the tropical cyclone passes
-
Northeastern
China will continue to see frequent rainfall during the next ten days maintaining wet field conditions in some areas -
China’s
Xinjiang province continues to experience relatively good weather -
A
few showers and thunderstorms are expected, but most of the region will be dry with temperatures varying greatly over the week -
Some
cooler biased conditions may briefly evolve later this week and into the weekend -
Queensland
and parts of New South Wales, Australia will get some rain today through the weekend causing a delay to winter planting of wheat, barley and some canola, but the moisture should be good for crops that have already been planted -
Southern
Australia weather will remain favorable for wheat, barley and canola planting and emergence during the next couple of weeks -
India’s
monsoonal rainfall is expected to continue improving over the next couple of weeks
-
Sufficient
rain is expected over the next two weeks to bolster soil moisture in many important summer grain, oilseed and cotton areas throughout the central, north and eastern parts of the nation -
Rain
in the northwest will be slowest in coming, but rain is expected during the weekend and especially next week
-
Ontario
and Quebec, Canada weather should be favorably mixed over the next two weeks
-
A
little drier and warmer bias would be most welcome and that is exactly what is expected -
South
Korea rice areas will get a few periods of rain during the next ten days bringing needed relief after weeks of dryness -
Some
relief has already begun, but much more rain is needed -
Tropical
Storm Chaba was located near 17.3 north, 115.0 east or 359 miles west northwest of Manila moving northerly at 11 mph and producing maximum sustained wind speeds of 46 mph -
The
storm will reach the southwestern Guangdong coast Saturday and then may curve to the north northeast into southern China increasing the potential for new flooding -
A
second tropical cyclone will form well east of Philippines in the next few days that could bring heavy rain to the Korean Peninsula and western Japan during the weekend and early next week
-
Argentina
will remain quite dry in its wheat country during the next two weeks -
Winter
wheat emergence and establishment is not expected to go very well without rain
-
Far
southern Brazil will receive additional waves of light rain over the next couple of weeks -
Drying
farther to the north will support Safrinha crop maturation and harvest progress and is considered to be normal -
There
is no risk of crop threatening cold in Brazil grain, coffee, sugarcane or citrus areas for the next two weeks -
Mexico’s
monsoonal rainfall will be good the west and north-central parts of the nation during the coming two weeks -
Northeastern
Mexico drought relief may not occur without the help of a tropical cyclone -
The
same may be true for far southern Texas -
Southeast
Asia rainfall will continue abundant in many areas through the next two weeks -
Local
flooding is possible -
East-central
Africa rainfall will occur sufficiently to improve crop and soil conditions from Uganda and southwestern Kenya northward into western and southern Ethiopia -
West-central
Africa rainfall has been and will continue sufficient to support coffee, cocoa, sugarcane, rice and cotton development normally -
Some
needed relief to dryness has occurred in parts of Ivory Coast recently and more expected throughout west-central Africa during the next ten days -
South
Africa’s crop moisture situation is favorable for winter crop emergence, although some additional rain might be welcome -
Net
drying is expected for a -
Winter
crops will continue to establish well. -
Central
America rainfall will be abundant during the next ten days -
Torrential
rain will bring flooding to Nicaragua and Costa Rica this weekend into early next week due to an approaching tropical cyclone -
El
Salvador, Honduras and Guatemala might also be impacted, but with lighter rainfall -
Today’s
Southern Oscillation Index was +15.70 and it will move erratically higher during the coming week -
New
Zealand rainfall will be lighter than usual during the balance of this week and then wetter next week
Source:
World Weather INC
Bloomberg
Ag Calendar
- USDA
weekly net-export sales for corn, soybeans, wheat, cotton, pork and beef, 8:30am - USDA’s
quarterly stockpile data for wheat, barley, corn, oat, soy and sorghum, noon - US
acreage for corn, soybeans and wheat - US
agricultural prices paid, received, 3pm - Malaysia’s
June palm oil export data
Friday,
July 1:
- ICE
Futures Europe weekly commitments of traders report - CFTC
commitments of traders weekly report on positions for various U.S. futures and options, 3:30pm - Monthly
coffee exports from Costa Rica and Honduras - International
Cotton Advisory Committee releases monthly world outlook report - USDA
soybean crush, DDGS production, corn for ethanol, 3pm - FranceAgriMer
weekly update on crop conditions - Australia
commodity index - HOLIDAY:
Canada, Hong Kong
Monday,
July 4:
- USDA
export inspections – corn, soybeans, wheat, 11am - HOLIDAY:
US
Tuesday,
July 5:
- US
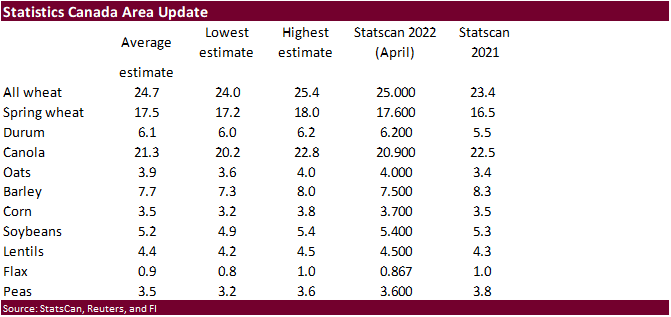
crop condition for spring and winter wheat, corn, soybeans and cotton; crop progress for winter wheat, 4pm - Canada’s
Statcan publishes data on seeded area for wheat, durum, canola, barley and soybeans - New
Zealand commodity price - New
Zealand global dairy trade auction - EU
weekly grain, oilseed import and export data - US
Purdue agriculture sentiment - Malaysia’s
July 1-5 palm oil export data
Wednesday,
July 6:
- UN
annual state of food security report
Thursday,
July 7:
- USDA
weekly net-export sales for corn, soybeans, wheat, cotton, pork and beef, 8:30am - EIA
weekly U.S. ethanol inventories, production, 11am - Vietnam’s
customs department releases coffee, rice and rubber export data for June - Brazil’s
Conab releases data on area, yield and output of corn and soybeans
Friday,
July 8:
- FAO
world food price index, grains supply and demand outlook - ICE
Futures Europe weekly commitments of traders report - CFTC
commitments of traders weekly report on positions for various U.S. futures and options, 3:30pm - FranceAgriMer
weekly update on crop conditions
Source:
Bloomberg and FI

Due
out Tuesday
USDA
export sales
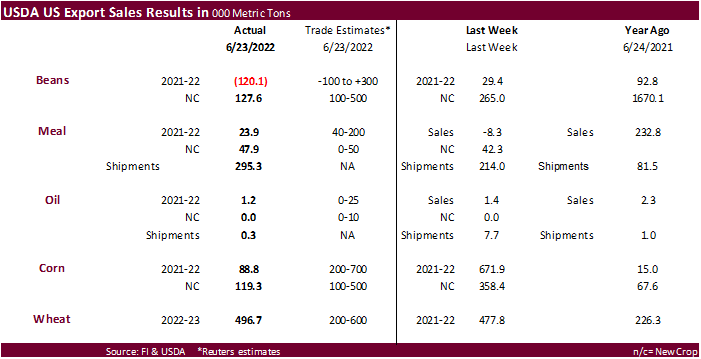
Poor
export sales all around with exception of wheat (496,700 tons) and pork sales (32,300 tons). Corn export sales were only 88,800 tons old crop (marketing year low) and 119,300 tons new-crop. Soybean sales were negative 120,100 tons for old crop. There were
decreases for unknown (288,400 MT), Pakistan (55,000 MT), and Italy (46,000 MT). New-crop sales were 127,600 tons. Meal sales were a low 23,900 tons old crop and 47,900 tons new-crop. Soybean oil sales were a poor 1,200 tons.
Macros
US
Initial Jobless Claims Jun 25: 231K (est 230K; prev 229K)
US
Personal Income May: 0.5% (est 0.5%; prev 0.4%)
US
Personal Spending May: 0.2% (est 0.4%; prev 0.9%)
US
Real Personal Spending May: -0.4% (est -0.3%; prev 0.7%)
US
PCE Core Deflator May: 0.3% (est 0.4%; prev 0.3%)
US
PCE Core Deflator May: 4.7% (est 4.8%; prev 4.9%)
US
PCE Deflator (M/M) May: 0.6% (est 0.7%; prev 0.2%)
US
PCE Deflator (Y/Y) May: 6.3% (est 6.4%; prev 6.3%)
US
Continuing Claims Jun 18: 1328K (est 1318K; prev 1315K)
Canadian
GDP (M/M) Apr: 0.3% (est 0.3%; prev 0.7%)
Canadian
GDP (Y/Y) Apr: 5.0% (est 4.9%; prev 3.5%)
Canadian
GDP Falls 0.2% In May – StatsCan
108
Counterparties Take $2.330 Tln At Fed Reverse Repo Op (prev $2.227 Tln, 98 Bids)
·
Corn futures
ended lower after USDA reported corn plantings near expectations and 431,000 acres above March Intentions. Corn was also pressured weaker energy markets, along with good US weather. The WCB will see rain July 3-4 and ECB the 5th and 6th.
A lower USD did little to cool selling. Sharply lower what added to the negative undertone. Feed demand was better than expected during the second quarter with a revision to March stocks, and less than expected for the third quarter. We look for corn for feed
to be strong during the last quarter with a good amount of feed wheat coming online.
·
Other news was light. Many traders are still trying to pinpoint a timeframe if and when Ukraine grain shipments will start flowing.
·
Funds sold an estimated net 18,000 corn contracts.
·
Greece offered to supply grain ships to help export Ukrainian grain.
Export
developments.
- South
Korea’s NOFI bought 136,000 tons of South American corn at $348.88 c&f for Sep-Oct shipment, depending on origin.
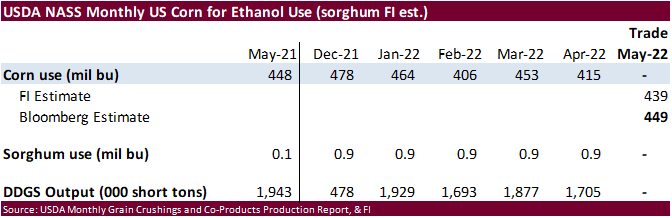
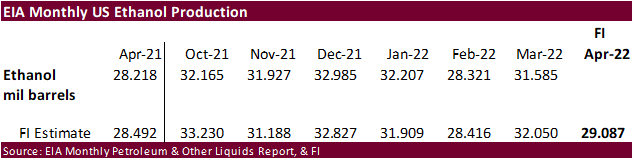
EIA
monthly ethanol report is delayed
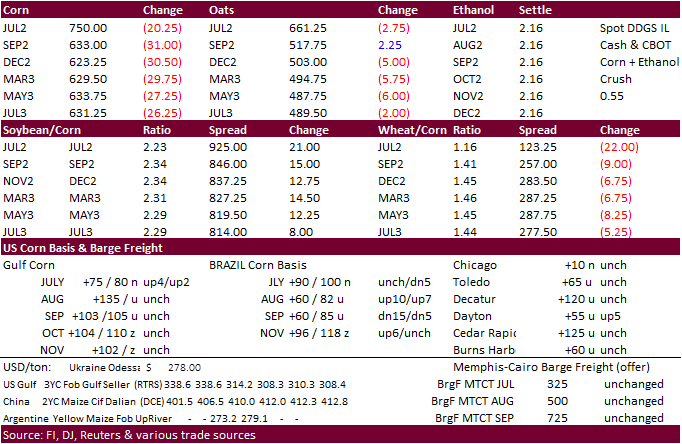
September
corn is seen in a $5.50 and $7.50 range
December
corn is seen in a wide $5.75-$8.25 range
·
CBOT soybeans ended lower in a yo-yo trading session. USDA reported a bullish US soybean planted area estimate but sharply lower grains and end of month/quarter long liquidation pulled non-expiring contracts lower.
·
Biofuel and energy markets took a hit today, in part after the US Supreme Court ruled that federal agencies, such as the EPA, cannot issue sweeping regulations to reduce carbon emissions from power plants. EPA will likely have
to go through Congress, say, to limit coal use, for example.
·
USDA export sales were disappointing. China sales have slowed with combined net 16,402 tons sold.