PDF Attached
US
employment report was better than expected. Grains and soybean complex traded higher on US weather concerns. The USD was slightly lower around 1 pm CT and WTI a little more than $2.00 higher. USDA export sales were poor. Not much has changed with the fundamentals.
Easing recession fears were again noted. We are getting a little concerned for the US demand side for ags. Other than the occasional US grain tenders, major importers have been absent from the US market. Last USDA 24-H announcement was June 17.
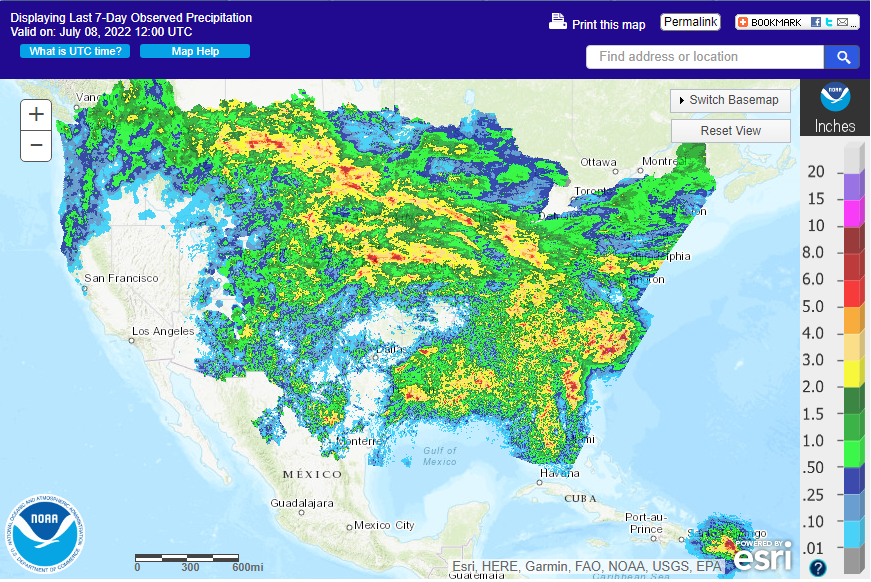
Last
7-days
WEATHER
TO WATCH AROUND THE WORLD
- Portions
of Thailand continue to receive lighter than usual rainfall, although no serious drought has evolved - Greater
rain is needed to improve rice and sugarcane as well as some corn production potential - Western
Europe continues to be threatened by dry and warm to hot weather that will evolve later this weekend and especially next week - Dry
or mostly dry weather is expected for ten days and possibly two weeks - Extreme
high temperatures in the 90s Fahrenheit will impact France, the U.K. and possibly a few areas as far north as southern England and Wales - A
few temperatures near and over 100 will occur in France during the middle to latter part of next week when the heat is most intense
- Spain
and Portugal will also be included in the heat wave along - Crop
stress is expected to evolve and become significant next week and on into the following weekend - Eastern
Europe will continue to experience pockets of dryness that threaten production potential of dryland corn, sunseed and soybeans - It
is still early enough in the summer that a weather change toward wetter weather could improve production potentials, but not much change is likely for a while - Temperatures
in eastern Europe will be milder than usual over the coming week and then hotter than usual in the following week - Russia’s
southern region is advertised to receive a few more showers in today’s forecast relative to that of previous days this week - Any
showers would be welcome due to parts of the region being notably dry - Recent
temperatures have been heating up into the 80s and lower 90s Fahrenheit and this trend will continue until rain begins to evolve later this weekend into early next week - Partial
relief from the heat and dryness is expected, but greater rain will be needed - Argentina’s
outlook has not changed today with a drier than usual bias continuing in western wheat areas through the next ten days; however the European operational model overnight suggested showers early next week and more significantly late next week into the following
weekend would provide some relief - The
European Ensemble and GFS model runs all disagree keeping showers limited to eastern wheat areas and most of that will occur early next week - U.S.
weather outlook has not changed greatly today relative to that of Thursday - Limited
rainfall after Saturday will lead to net drying in most of the Key Midwestern states and in a large part of the Great Plains - Some
showers and thunderstorms will occur briefly in the Delta tonight and again during mid- to late-week and in the following weekend offering a limited amount of relief from recent hot and dry weather - U.S.
southeastern states will see the best mix of rain and sunshine over the next ten days improving crop conditions - Temperatures
will trend milder than usual over the central and eastern Midwest this weekend and especially next week - Western
Corn and Soybean Belt will experience warm weather infrequently during the next week to ten days - Southern
Plains will stay too dry and warm to hot for crops, despite some sporadic showers - Crops
in West Texas, the Texas Blacklands and some areas in South Texas will experience significant moisture stress - Far
western states will continue quite dry and warm - Canada’s
Prairies will heat up and dry out for a while next week after weekend showers and thunderstorms end Monday - High
temperatures in the 90s to near 100 Fahrenheit are expected from southern Alberta through most of Saskatchewan and into a part of western Manitoba - Some
drying would be welcome in the wetter areas, but dryness in central and south-central Saskatchewan may worsen raising concern over crop conditions - Timely
rainfall must resume in the second week of the forecast to protect crop production potentials - Ontario
and Quebec Canada will get some timely rainfall and experience some milder than usual weather over the next ten days - Southwestern
Ontario has become quite dry and need a big boost in rainfall - Northern
China will continue to be abundantly to excessively wet - Crop
conditions vary widely across the region - Some
crops in the northeast need more sunshine - Central
parts of the Yellow River Basin and North China Plain crop have improved with greater rainfall noted earlier this season; however some central China locations have become much too wet recently and flooding has resulted - Rain
is expected to fall abundantly to excessively from the northern Yellow River Basin to Liaoning and the Korean Peninsula during the next ten days - China’s
Xinjiang province continues to experience relatively good weather - A
few showers and thunderstorms are expected, but most of the region will be dry with temperatures varying greatly over the week to ten days - Some
cooler biased conditions may briefly evolve in northern parts of the region - Southern
China will experience some drying over the next ten days and that will be a welcome change after recent weeks of excessive rain - India’s
monsoon will generate waves of rain across the central two-thirds of the nation during the next ten days to two weeks - The
region will be plenty wet - Additional
rain will reach into Gujarat and Rajasthan while being heavy at times in Madhya Pradesh and Maharashtra
- Flooding
is expected in some of these areas resulting in potential crop damage and a need for replanting - Personal
property damage will also result from excessive rainfall - Today’s
forecast is not quite as wet as that of Thursday - Brazil
periodic rainfall will be confined to Atlantic coastal areas and from Rio Grande do Sul to Parana and southern Paraguay during the next ten days - There
is no risk of crop threatening cold in Brazil grain, coffee, sugarcane or citrus areas for the next two weeks - Dry
weather in Safrinha corn and cotton areas of Brazil will be good for maturation and harvest progress - Southern
Australia weather will trend a little wetter in this coming week bringing back some welcome moisture to the region after a brief break - The
precipitation will be great for winter crop establishment - South
Korea rice areas are still dealing with a serious drought, despite some rain that fell recently.
- Some
rain is expected over the next couple of weeks, but the greatest rainfall may be held off for several more days - Significant
drought relief is forthcoming near mid-month - Mexico’s
monsoonal rainfall will be good in the west, south and north-central parts of the nation during the coming two weeks - Northeastern
Mexico drought relief may not occur without the help of a tropical cyclone - The
same may be true for far southern Texas - Southeast
Asia rainfall will continue abundant in many areas through the next two weeks - Local
flooding is possible in the Philippines, New Guinea and Myanmar - Some
western mainland areas of Southeast Asia will continue to get lighter than usual rainfall, but sufficient amounts will occur to support crops - There
is need for greater rain to improve water supply later in the year - Sumatra
rainfall and parts of peninsular Malaysia will experience lighter than usual precipitation in this coming week to ten days - East-central
Africa rainfall will be greatest in central and western Ethiopia and lightest in parts of Uganda.
- Tanzania
is normal dry at this time of year and it should be that way for the next few of weeks - West-central
Africa rainfall has been and will continue sufficient to support coffee, cocoa, sugarcane, rice and cotton development normally - Some
greater rain would still be welcome in the drier areas of Ivory Coast - South
Africa’s crop moisture situation is favorable for winter crop emergence, although some additional rain might be welcome - Some
rain will fall in the southwestern crop areas periodically over the next couple of weeks maintaining good soil moisture for winter crop establishment - Central
America rainfall will continue to be abundant to excessive and drying is needed - Today’s
Southern Oscillation Index was +14.81 and it will lower during the coming week - New
Zealand weather will trend wetter with some flooding rainfall possible in North Island and the north half of South Island
Source:
World Weather INC
Friday,
July 8:
- USDA
weekly net-export sales for corn, soybeans, wheat, cotton, pork and beef, 8:30am
- FAO
world food price index, grains supply and demand outlook - ICE
Futures Europe weekly commitments of traders report - CFTC
commitments of traders weekly report on positions for various U.S. futures and options, 3:30pm - FranceAgriMer
weekly update on crop conditions
Monday,
July 11:
- USDA
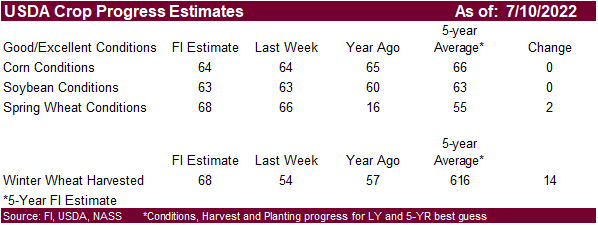
export inspections – corn, soybeans, wheat, 11am - US
crop conditions for spring and winter wheat, corn, soybeans and cotton, 4pm - Brazil’s
Unica to release cane crushing and sugar output data (tentative) - HOLIDAY:
Singapore, Malaysia, Pakistan, Bangladesh
Tuesday,
July 12:
- USDA’s
monthly World Agricultural Supply and Demand Estimates (WASDE), 12pm - China’s
agriculture ministry (CASDE) releases monthly report on supply and demand for corn and soybeans - The
Malaysian Palm Oil Board releases palm oil stockpiles, output and export data for June - World
Coffee Producers Forum (virtual session) - France
agriculture ministry 2022 crop production estimates - EU
weekly grain, oilseed import and export data
Wednesday,
July 13:
- China’s
first batch of June trade data, incl. soybean, edible oil, rubber and meat imports - EIA
weekly U.S. ethanol inventories, production, 10:30am - France
AgriMer monthly grains outlook - New
Zealand food prices - HOLIDAY:
Thailand
Thursday,
July 14:
- USDA
weekly net-export sales for corn, soybeans, wheat, cotton, pork and beef, 8:30am - HOLIDAY:
France
Friday,
July 15:
- ICE
Futures Europe weekly commitments of traders report - CFTC
commitments of traders weekly report on positions for various U.S. futures and options, 3:30pm - China’s
1H pork output and hog inventory - Malaysia’s
July 1-15 palm oil export data - FranceAgriMer
weekly update on crop conditions - The
Cocoa Association of Asia releases 2Q cocoa grind data
Source:
Bloomberg and FI
USDA
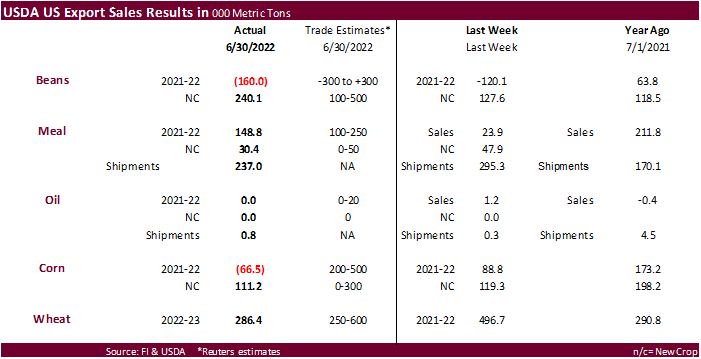
Export Sales
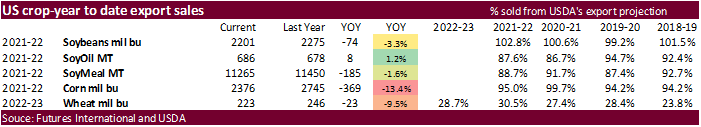
Another
poor week of sales for the books. We are under the impression both corn and soybean exports will fall short of USDA’s 2021-22 export projection, based on Census, inspection, and sales data.
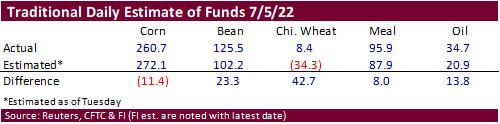
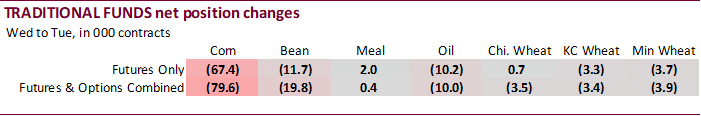
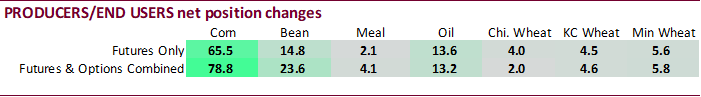
CFTC
Commitment of Traders
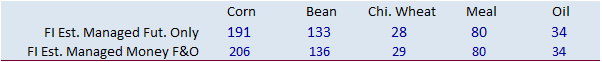
Funds
were heavy sellers for the week ending July 5 in corn, good sellers in soybeans, but were much lighter sellers for Chicago wheat. The funds position was less long for corn, but traders missed soybeans and to a much higher extent the Chicago wheat market. Indexes
continued to liquidate longs for the five major commodities. Meanwhile producers loaded up on positions in corn.


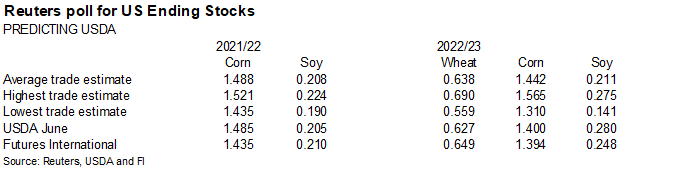
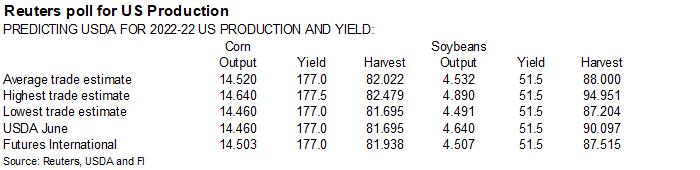
Reuters
Table
SUPPLEMENTAL
Non-Comm Indexes Comm
Net Chg Net Chg Net Chg
Corn
73,449 -64,988 405,599 -19,113 -420,847 89,083
Soybeans
33,564 -12,567 170,183 -11,192 -165,614 27,720
Soyoil
6,306 -8,914 96,629 -2,908 -107,315 15,700
CBOT
wheat -47,436 295 129,439 -6,593 -73,524 9,273
KCBT
wheat -2,982 -2,215 52,763 -2,598 -46,569 5,264
FUTURES
+ OPTS Managed Swaps Producer
Net Chg Net Chg Net Chg
Corn
172,867 -55,748 269,969 5,767 -428,714 78,788
Soybeans
105,048 -19,450 105,056 153 -168,327 23,589
Soymeal
65,777 3,321 82,129 150 -184,276 4,119
Soyoil
24,929 -8,677 80,173 623 -116,805 13,234
CBOT
wheat -42 -1,063 61,498 4,491 -58,738 2,017
KCBT
wheat 22,037 -2,819 25,778 -809 -39,527 4,614
MGEX
wheat 5,131 -2,955 665 283 -6,434 5,760
———- ———- ———- ———- ———- ———-
Total
wheat 27,126 -6,837 87,941 3,965 -104,699 12,391
Live
cattle 14,297 -9,968 61,290 -2,153 -91,910 8,544
Feeder
cattle -7,531 -2,211 3,645 -342 6,547 1,050
Lean
hogs 28,485 -2,155 52,545 -706 -69,029 2,659
Other NonReport Open
Net Chg Net Chg Interest Chg
Corn
44,078 -23,825 -58,201 -4,983 1,854,508 -1,463
Soybeans
-3,644 -331 -38,133 -3,960 805,841 5,375
Soymeal
17,694 -2,881 18,677 -4,709 435,036 4,221
Soyoil
7,324 -1,303 4,380 -3,878 414,025 9,387
CBOT
wheat 5,761 -2,471 -8,479 -2,976 387,076 11,528
KCBT
wheat -5,075 -535 -3,214 -450 170,838 -642
MGEX
wheat 2,157 -902 -1,518 -2,186 65,698 -1,651
———- ———- ———- ———- ———- ———-
Total
wheat 2,843 -3,908 -13,211 -5,612 623,612 9,235
Live
cattle 19,646 2,119 -3,324 1,458 341,485 -258
Feeder
cattle 1,168 872 -3,830 632 54,342 234
Lean
hogs -1,080 303 -10,921 -103 251,545 10,001
Macros
US
Change In Nonfarm Payrolls Jun: 372K (est 268K; prev 390K)
US
Unemployment Rate Jun: 3.6% (est 3.6%; prev 3.6%)
US
Average Hourly Earnings (M/M) Jun: 0.3% (est 0.3%; prev 0.3%)
US
Average Hourly Earnings (Y/Y) Jun: 5.1% (est 5.0%; prev 5.2%)
Revisions***
US Change In Nonfarm Payrolls Jun: 372K (est 268K; prevR 384K)
US
Unemployment Rate Jun: 3.6% (est 3.6%; prev 3.6%)
US
Average Hourly Earnings (M/M) Jun: 0.3% (est 0.3%; prevR 0.4%)
US
Average Hourly Earnings (Y/Y) Jun: 5.1% (est 5.0%; prevR 5.3%)
97
Counterparties Take $2.145 Tln At Fed Reverse Repo Op (prev $2.172 Tln, 102 Bids)
·
CBOT corn was higher on follow through technical buying and US wheat concerns. The midday weather forecast called for a strong high-pressure ridge for the heart of the US later this month. The 6–10-day weather outlook still has
very warm temperatures bias WCB and GP and net drying for the upper Midwest.
·
The central and southern Great Plains are currently seeing hot conditions.
·
USDA export sales were again poor, and slowing demand is leading us to think 2021-22 ending stocks will be higher than what the trade has penciled in. The USD is lower, WTI crude oil turned higher and equities lower.
·
Funds bought an estimated net 20,000 corn contracts.
·
South Korea’s FLC bought 65,000 tons of corn at an estimated $321.29/ton c&f for arrival around October 25.
USDA
Attaché
China
Grain and Feed Update
September
corn is seen in a $5.50 and $7.50 range
December
corn is seen in a wide $5.00-$8.00 range