PDF Attached


US
employment report was better than expected. Grains and soybean complex traded higher on US weather concerns. The USD was slightly lower around 1 pm CT and WTI a little more than $2.00 higher. USDA export sales were poor. Not much has changed with the fundamentals.
Easing recession fears were again noted. We are getting a little concerned for the US demand side for ags. Other than the occasional US grain tenders, major importers have been absent from the US market. Last USDA 24-H announcement was June 17.


For
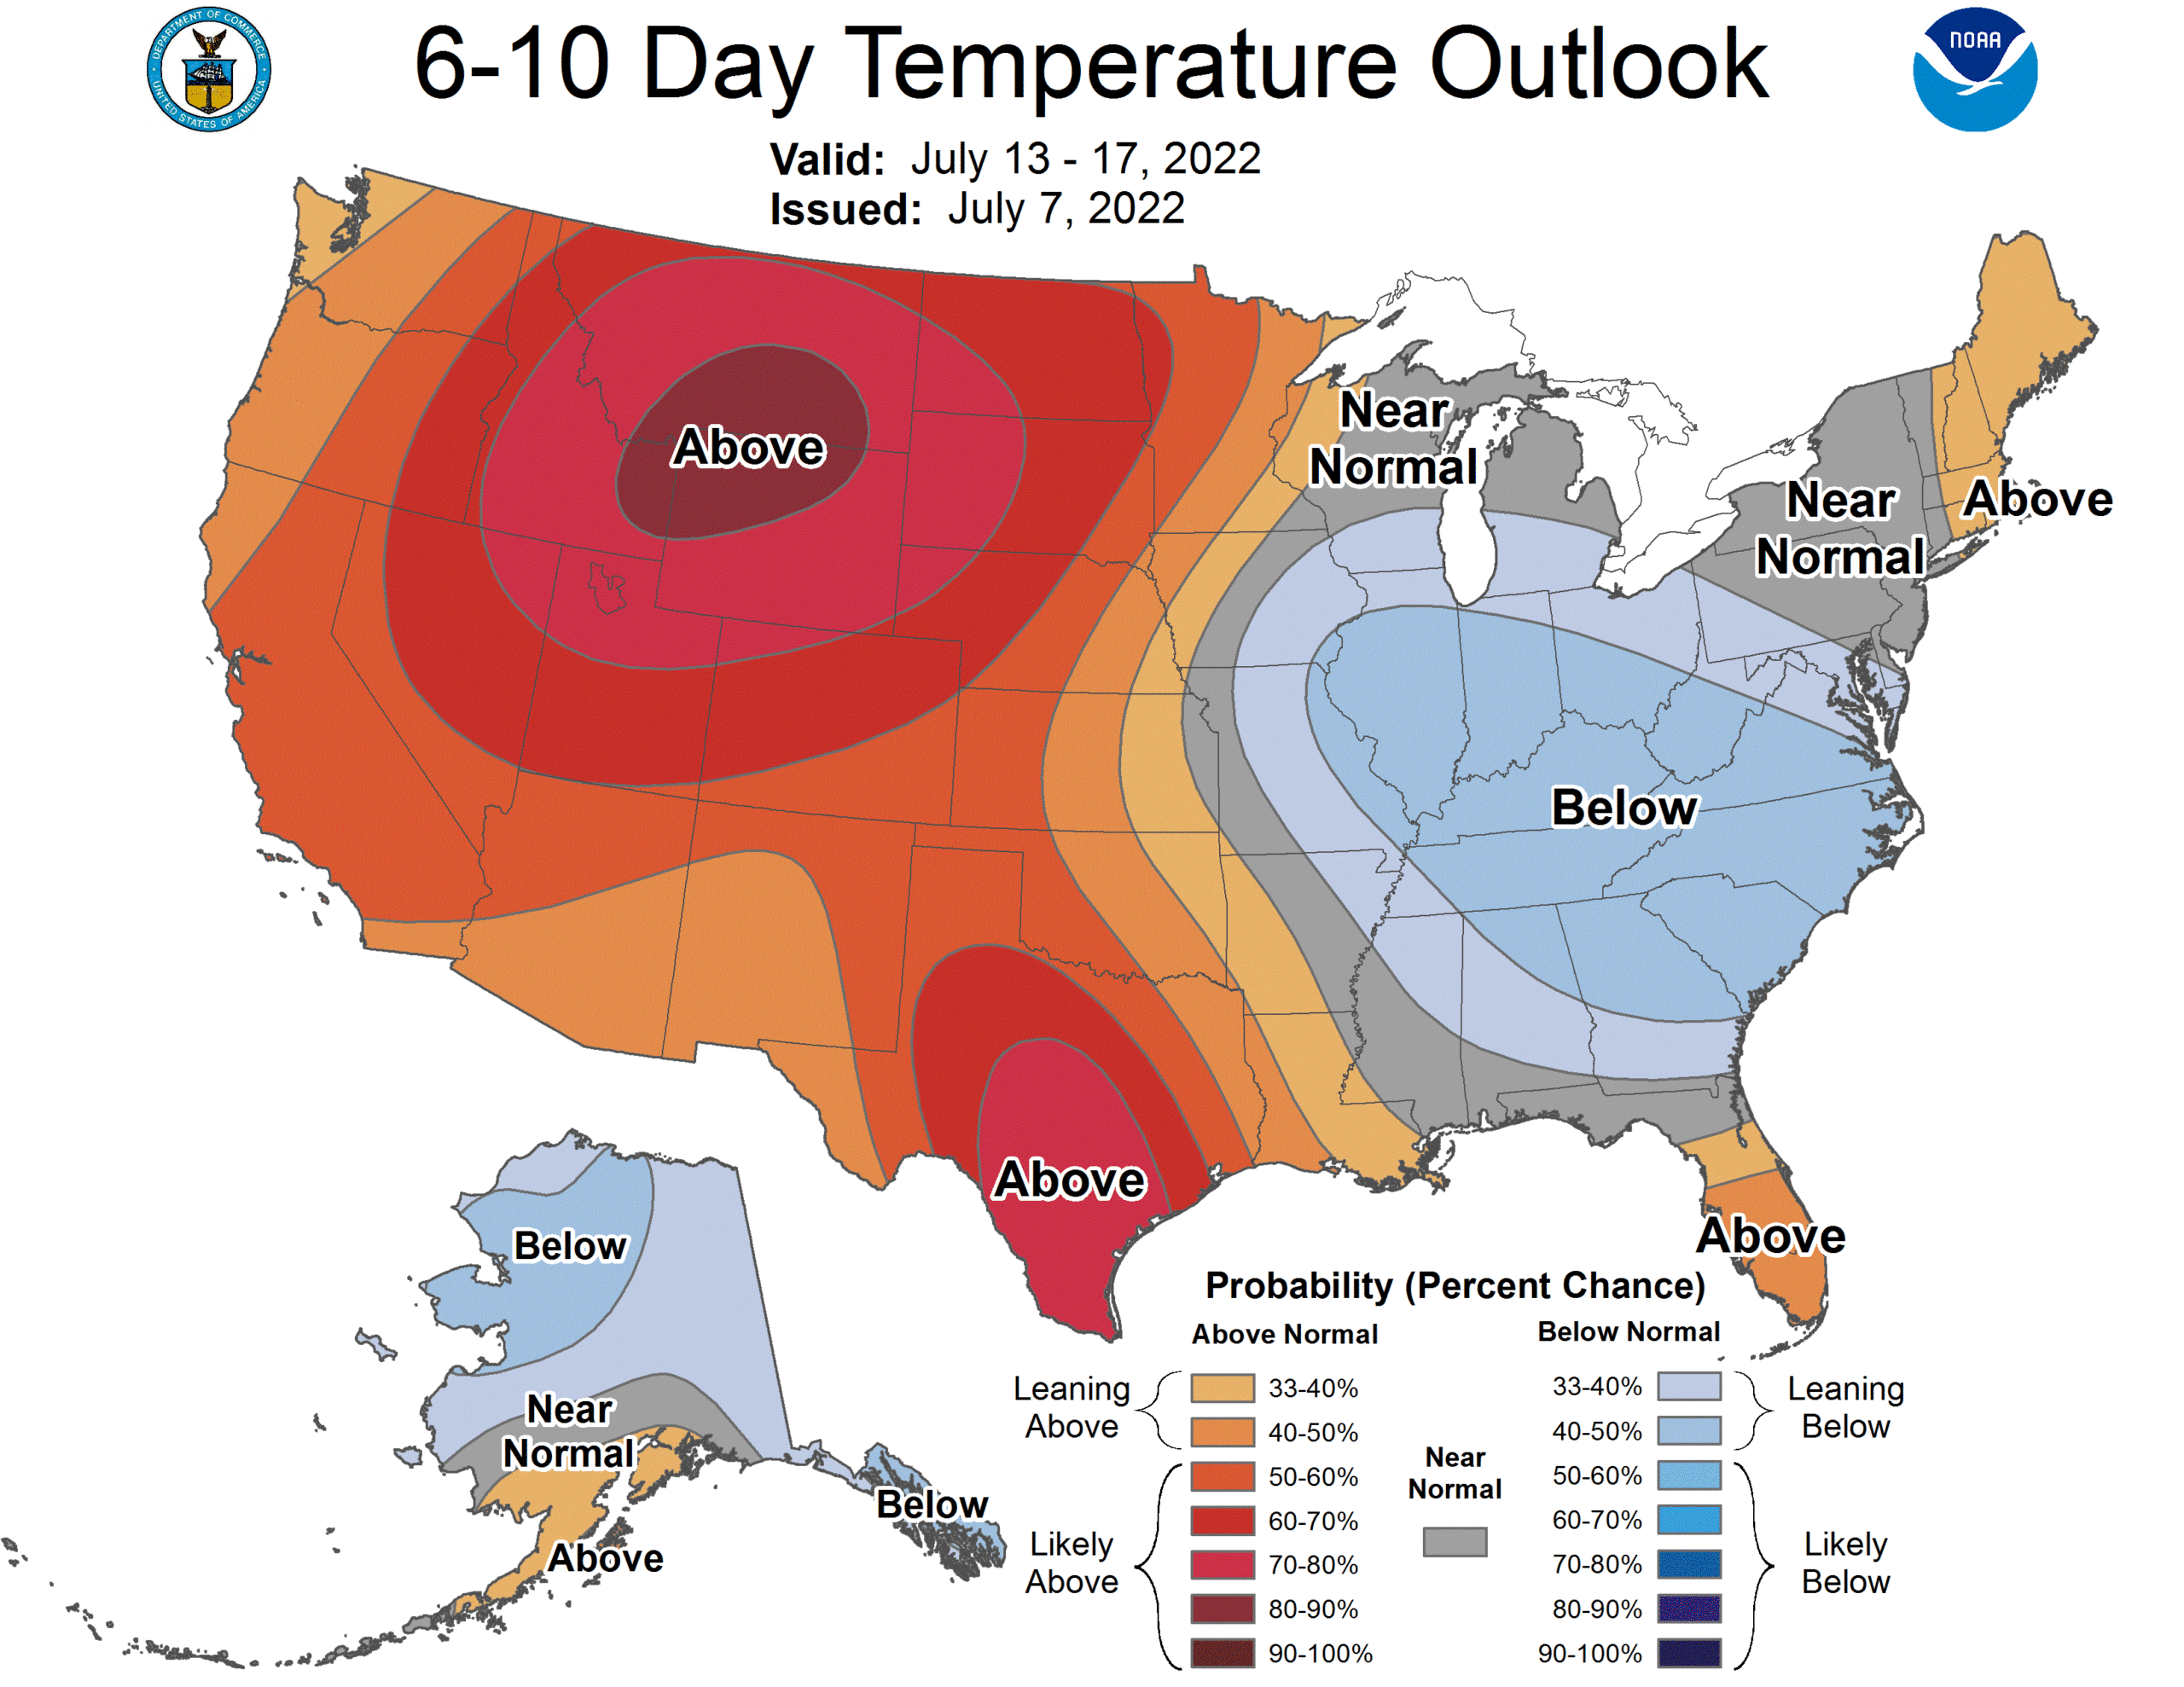
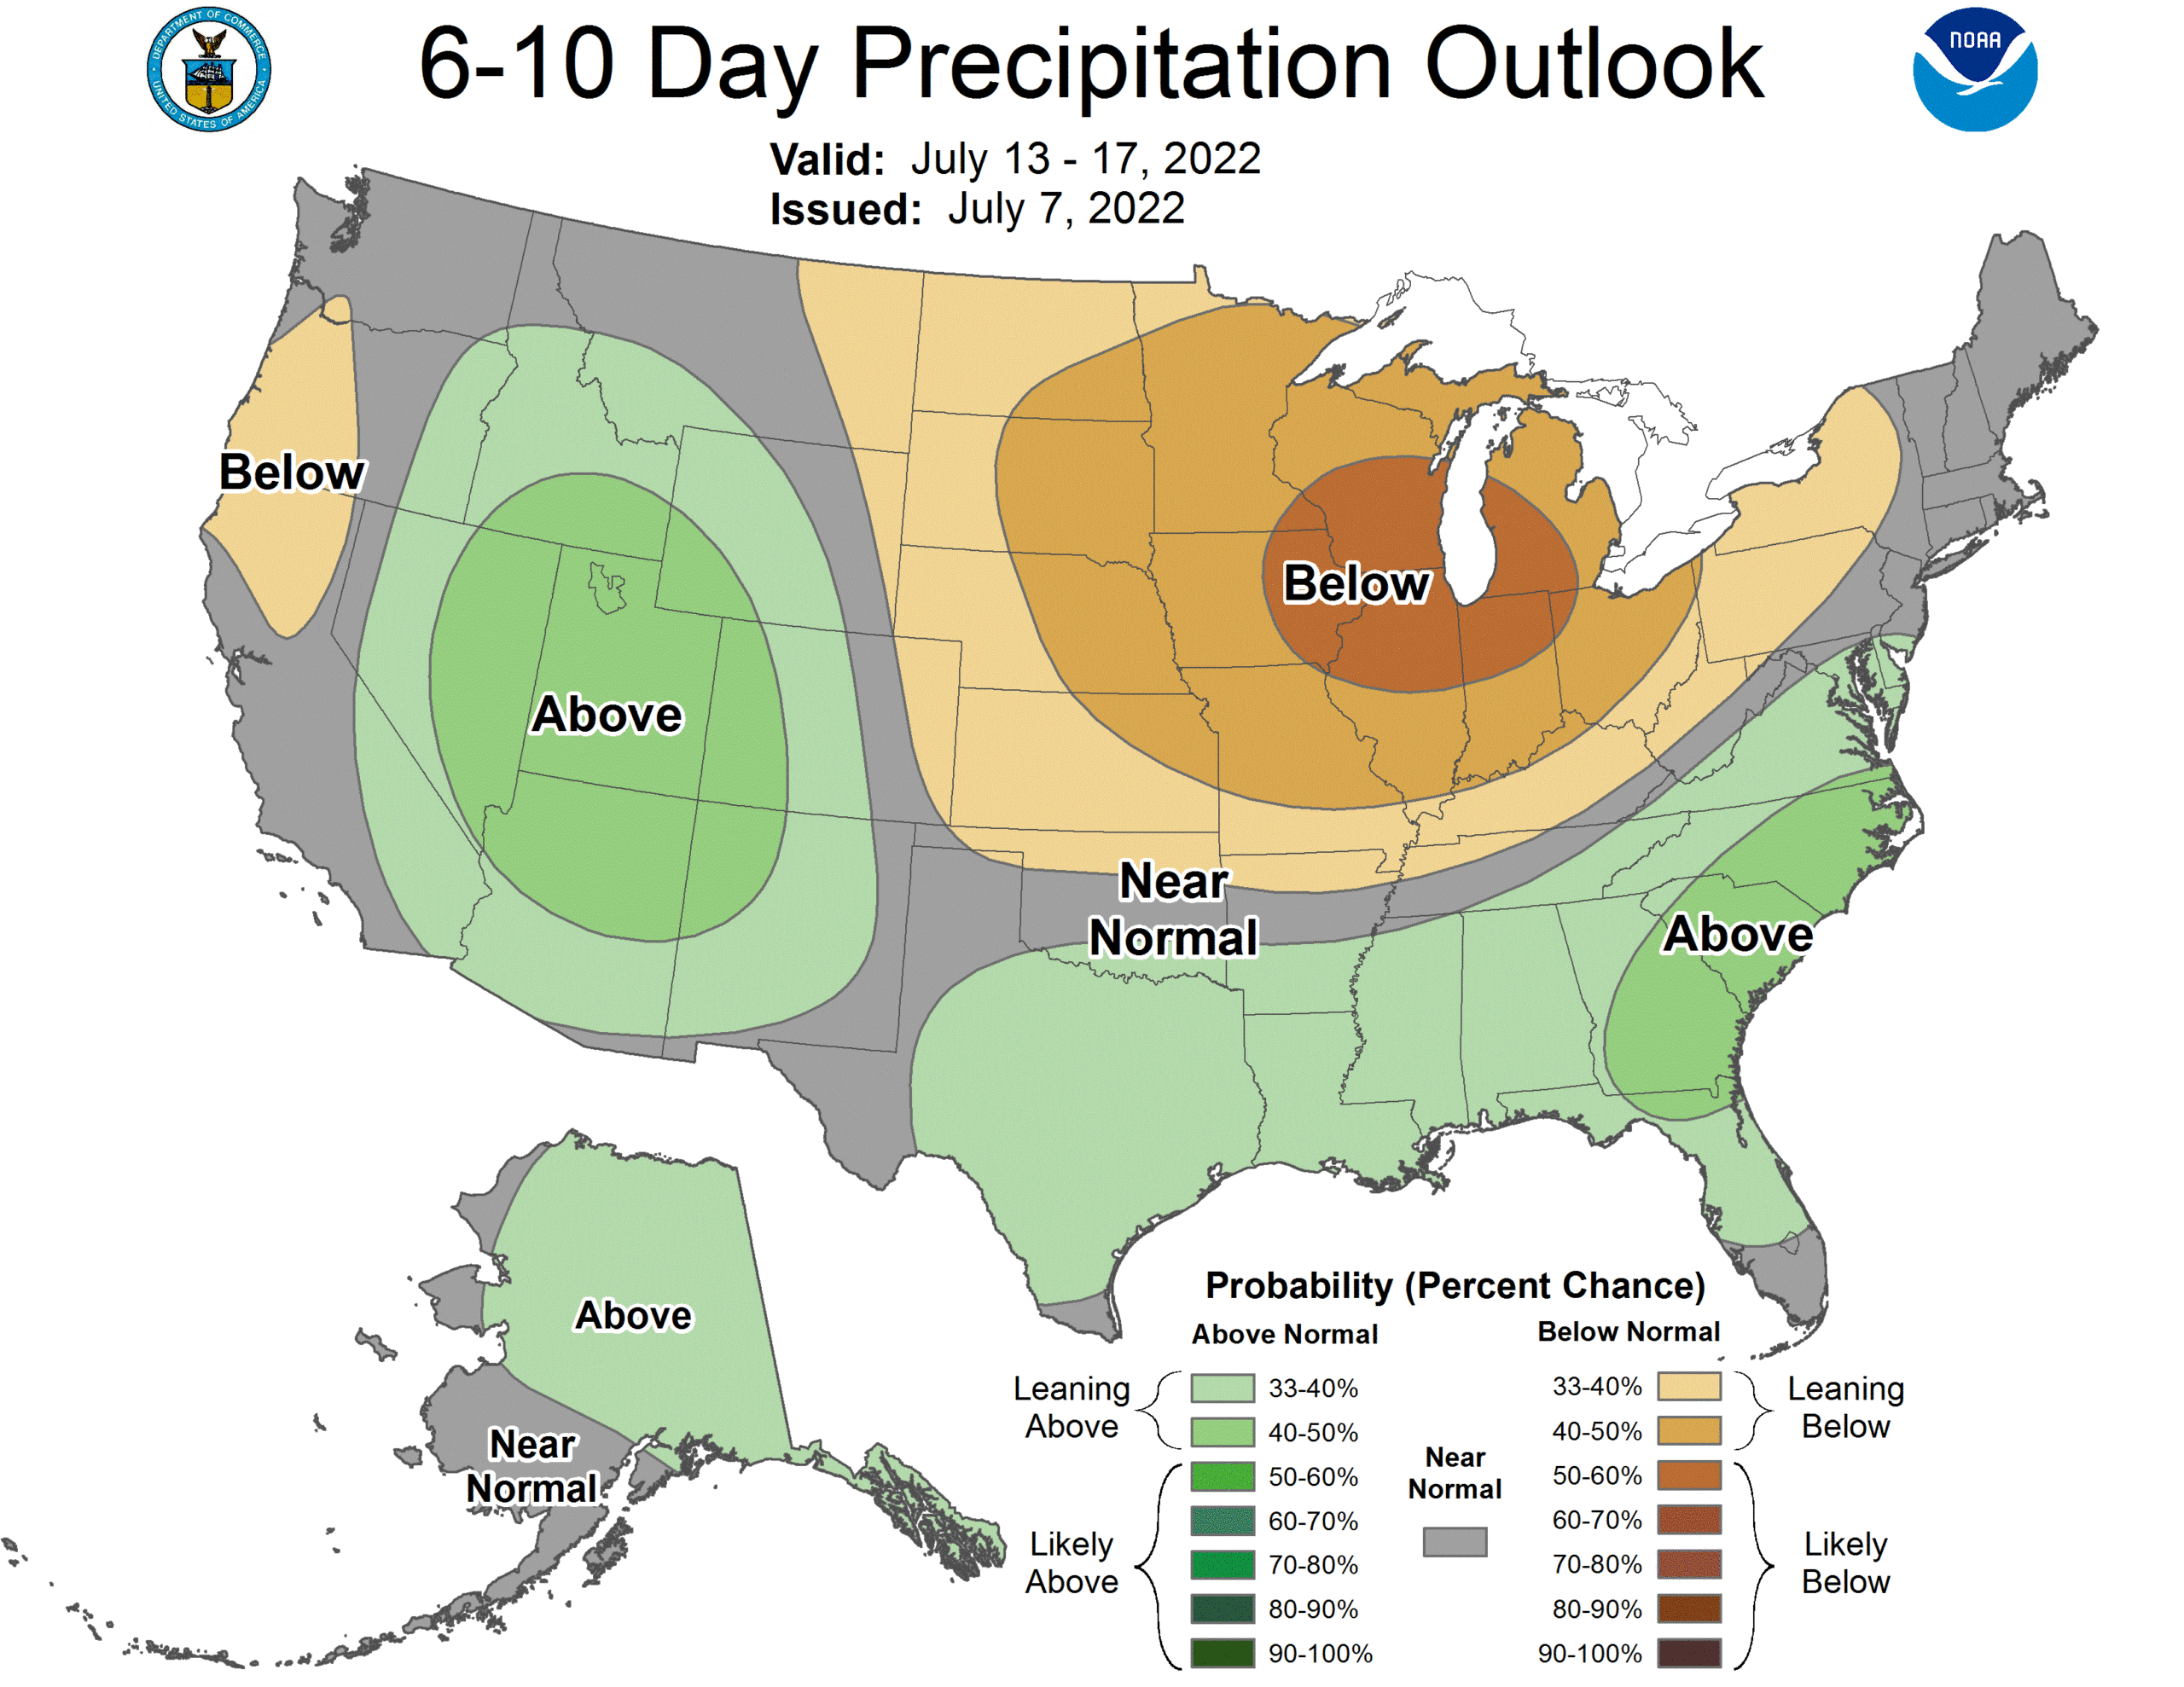
the near term, the US weather forecast for the Great Plains and Midwest was mostly unchanged Delta improved. The 6-10 day still has hot temperatures domination much of the western US and below precipitation for the upper Midwest-bias ECB. The Great Plains
will see rain across OK today and upper & western GP this weekend into Monday. The Midwest will see rain across the southeast and northwest through the weekend. Argentina is still expected to see a few showers across wheat country through Monday. Western Europe
will be hot next week lasting until at least mid-month.


Weather

6 to 10 Day Outlook - Temperature Probability


Map

Description automatically generated


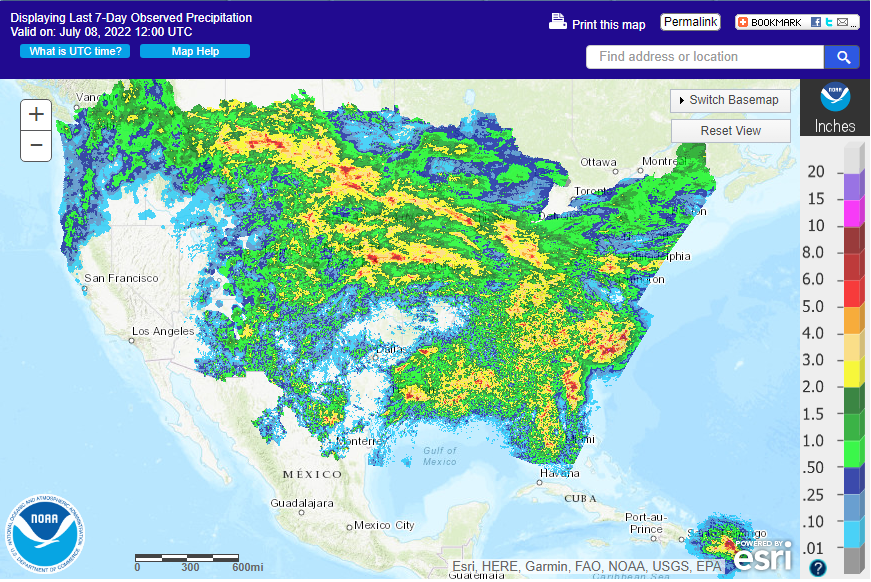
Last
7-days

Map

Description automatically generated


World
Weather Inc.

WEATHER
TO WATCH AROUND THE WORLD

  • Portions
    of Thailand continue to receive lighter than usual rainfall, although no serious drought has evolved
    • Greater
      rain is needed to improve rice and sugarcane as well as some corn production potential
  • Western
    Europe continues to be threatened by dry and warm to hot weather that will evolve later this weekend and especially next week
    • Dry
      or mostly dry weather is expected for ten days and possibly two weeks
    • Extreme
      high temperatures in the 90s Fahrenheit will impact France, the U.K. and possibly a few areas as far north as southern England and Wales
      • A
        few temperatures near and over 100 will occur in France during the middle to latter part of next week when the heat is most intense
    • Spain
      and Portugal will also be included in the heat wave along
    • Crop
      stress is expected to evolve and become significant next week and on into the following weekend
  • Eastern
    Europe will continue to experience pockets of dryness that threaten production potential of dryland corn, sunseed and soybeans
    • It
      is still early enough in the summer that a weather change toward wetter weather could improve production potentials, but not much change is likely for a while
    • Temperatures
      in eastern Europe will be milder than usual over the coming week and then hotter than usual in the following week
  • Russia’s
    southern region is advertised to receive a few more showers in today’s forecast relative to that of previous days this week
    • Any
      showers would be welcome due to parts of the region being notably dry
    • Recent
      temperatures have been heating up into the 80s and lower 90s Fahrenheit and this trend will continue until rain begins to evolve later this weekend into early next week
    • Partial
      relief from the heat and dryness is expected, but greater rain will be needed
  • Argentina’s
    outlook has not changed today with a drier than usual bias continuing in western wheat areas through the next ten days; however the European operational model overnight suggested showers early next week and more significantly late next week into the following
    weekend would provide some relief
    • The
      European Ensemble and GFS model runs all disagree keeping showers limited to eastern wheat areas and most of that will occur early next week
  • U.S.
    weather outlook has not changed greatly today relative to that of Thursday
    • Limited
      rainfall after Saturday will lead to net drying in most of the Key Midwestern states and in a large part of the Great Plains
    • Some
      showers and thunderstorms will occur briefly in the Delta tonight and again during mid- to late-week and in the following weekend offering a limited amount of relief from recent hot and dry weather
    • U.S.
      southeastern states will see the best mix of rain and sunshine over the next ten days improving crop conditions
    • Temperatures
      will trend milder than usual over the central and eastern Midwest this weekend and especially next week
    • Western
      Corn and Soybean Belt will experience warm weather infrequently during the next week to ten days
    • Southern
      Plains will stay too dry and warm to hot for crops, despite some sporadic showers
      • Crops
        in West Texas, the Texas Blacklands and some areas in South Texas will experience significant moisture stress
    • Far
      western states will continue quite dry and warm
  • Canada’s
    Prairies will heat up and dry out for a while next week after weekend showers and thunderstorms end Monday
    • High
      temperatures in the 90s to near 100 Fahrenheit are expected from southern Alberta through most of Saskatchewan and into a part of western Manitoba
      • Some
        drying would be welcome in the wetter areas, but dryness in central and south-central Saskatchewan may worsen raising concern over crop conditions
    • Timely
      rainfall must resume in the second week of the forecast to protect crop production potentials
  • Ontario
    and Quebec Canada will get some timely rainfall and experience some milder than usual weather over the next ten days
    • Southwestern
      Ontario has become quite dry and need a big boost in rainfall
  • Northern
    China will continue to be abundantly to excessively wet
    • Crop
      conditions vary widely across the region
      • Some
        crops in the northeast need more sunshine
      • Central
        parts of the Yellow River Basin and North China Plain crop have improved with greater rainfall noted earlier this season; however some central China locations have become much too wet recently and flooding has resulted
    • Rain
      is expected to fall abundantly to excessively from the northern Yellow River Basin to Liaoning and the Korean Peninsula during the next ten days
  • China’s
    Xinjiang province continues to experience relatively good weather
    • A
      few showers and thunderstorms are expected, but most of the region will be dry with temperatures varying greatly over the week to ten days
      • Some
        cooler biased conditions may briefly evolve in northern parts of the region
  • Southern
    China will experience some drying over the next ten days and that will be a welcome change after recent weeks of excessive rain
  • India’s
    monsoon will generate waves of rain across the central two-thirds of the nation during the next ten days to two weeks
    • The
      region will be plenty wet
    • Additional
      rain will reach into Gujarat and Rajasthan while being heavy at times in Madhya Pradesh and Maharashtra
      • Flooding
        is expected in some of these areas resulting in potential crop damage and a need for replanting
      • Personal
        property damage will also result from excessive rainfall
      • Today’s
        forecast is not quite as wet as that of Thursday
  • Brazil
    periodic rainfall will be confined to Atlantic coastal areas and from Rio Grande do Sul to Parana and southern Paraguay during the next ten days
  • There
    is no risk of crop threatening cold in Brazil grain, coffee, sugarcane or citrus areas for the next two weeks
  • Dry
    weather in Safrinha corn and cotton areas of Brazil will be good for maturation and harvest progress
  • Southern
    Australia weather will trend a little wetter in this coming week bringing back some welcome moisture to the region after a brief break
    • The
      precipitation will be great for winter crop establishment
  • South
    Korea rice areas are still dealing with a serious drought, despite some rain that fell recently.
    • Some
      rain is expected over the next couple of weeks, but the greatest rainfall may be held off for several more days
    • Significant
      drought relief is forthcoming near mid-month
  • Mexico’s
    monsoonal rainfall will be good in the west, south and north-central parts of the nation during the coming two weeks
    • Northeastern
      Mexico drought relief may not occur without the help of a tropical cyclone
    • The
      same may be true for far southern Texas
  • Southeast
    Asia rainfall will continue abundant in many areas through the next two weeks
    • Local
      flooding is possible in the Philippines, New Guinea and Myanmar
    • Some
      western mainland areas of Southeast Asia will continue to get lighter than usual rainfall, but sufficient amounts will occur to support crops
      • There
        is need for greater rain to improve water supply later in the year
    • Sumatra
      rainfall and parts of peninsular Malaysia will experience lighter than usual precipitation in this coming week to ten days
  • East-central
    Africa rainfall will be greatest in central and western Ethiopia and lightest in parts of Uganda.
    • Tanzania
      is normal dry at this time of year and it should be that way for the next few of weeks
  • West-central
    Africa rainfall has been and will continue sufficient to support coffee, cocoa, sugarcane, rice and cotton development normally
    • Some
      greater rain would still be welcome in the drier areas of Ivory Coast
  • South
    Africa’s crop moisture situation is favorable for winter crop emergence, although some additional rain might be welcome
    • Some
      rain will fall in the southwestern crop areas periodically over the next couple of weeks maintaining good soil moisture for winter crop establishment
  • Central
    America rainfall will continue to be abundant to excessive and drying is needed
  • Today’s
    Southern Oscillation Index was +14.81 and it will lower during the coming week
  • New
    Zealand weather will trend wetter with some flooding rainfall possible in North Island and the north half of South Island

Source:
World Weather INC


Bloomberg
Ag Calendar

Friday,
July 8:

  • USDA
    weekly net-export sales for corn, soybeans, wheat, cotton, pork and beef, 8:30am
  • FAO
    world food price index, grains supply and demand outlook
  • ICE
    Futures Europe weekly commitments of traders report
  • CFTC
    commitments of traders weekly report on positions for various U.S. futures and options, 3:30pm
  • FranceAgriMer
    weekly update on crop conditions

Monday,
July 11:

  • USDA
    export inspections – corn, soybeans, wheat, 11am
  • US
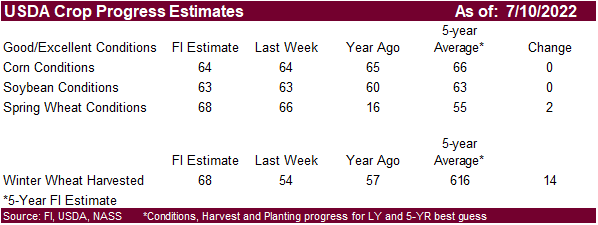
    crop conditions for spring and winter wheat, corn, soybeans and cotton, 4pm
  • Brazil’s
    Unica to release cane crushing and sugar output data (tentative)
  • HOLIDAY:
    Singapore, Malaysia, Pakistan, Bangladesh

Tuesday,
July 12:

  • USDA’s
    monthly World Agricultural Supply and Demand Estimates (WASDE), 12pm
  • China’s
    agriculture ministry (CASDE) releases monthly report on supply and demand for corn and soybeans
  • The
    Malaysian Palm Oil Board releases palm oil stockpiles, output and export data for June
  • World
    Coffee Producers Forum (virtual session)
  • France
    agriculture ministry 2022 crop production estimates
  • EU
    weekly grain, oilseed import and export data

Wednesday,
July 13:

  • China’s
    first batch of June trade data, incl. soybean, edible oil, rubber and meat imports
  • EIA
    weekly U.S. ethanol inventories, production, 10:30am
  • France
    AgriMer monthly grains outlook
  • New
    Zealand food prices
  • HOLIDAY:
    Thailand

Thursday,
July 14:

  • USDA
    weekly net-export sales for corn, soybeans, wheat, cotton, pork and beef, 8:30am
  • HOLIDAY:
    France

Friday,
July 15:

  • ICE
    Futures Europe weekly commitments of traders report
  • CFTC
    commitments of traders weekly report on positions for various U.S. futures and options, 3:30pm
  • China’s
    1H pork output and hog inventory
  • Malaysia’s
    July 1-15 palm oil export data
  • FranceAgriMer
    weekly update on crop conditions
  • The
    Cocoa Association of Asia releases 2Q cocoa grind data

Source:
Bloomberg and FI


USDA
Export Sales

Another
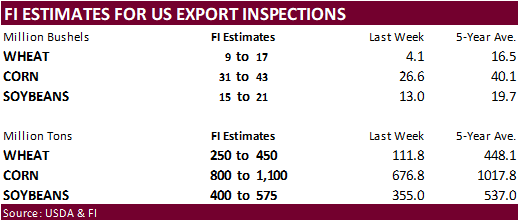
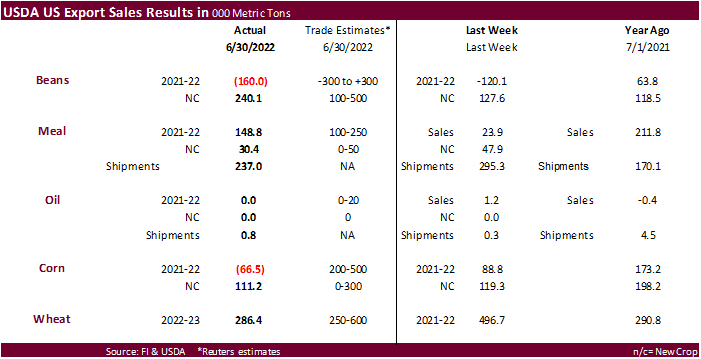
poor week of sales for the books. We are under the impression both corn and soybean exports will fall short of USDA’s 2021-22 export projection, based on Census, inspection, and sales data.


CFTC
Commitment of Traders

Funds
were heavy sellers for the week ending July 5 in corn, good sellers in soybeans, but were much lighter sellers for Chicago wheat. The funds position was less long for corn, but traders missed soybeans and to a much higher extent the Chicago wheat market. Indexes
continued to liquidate longs for the five major commodities. Meanwhile producers loaded up on positions in corn.


Reuters
Table

 SUPPLEMENTAL     
Non-Comm               Indexes                  Comm

                       
Net        Chg        Net        Chg        Net        Chg

Corn               
73,449    -64,988    405,599    -19,113   -420,847     89,083

Soybeans           
33,564    -12,567    170,183    -11,192   -165,614     27,720

Soyoil              
6,306     -8,914     96,629     -2,908   -107,315     15,700

CBOT
wheat         -47,436        295    129,439     -6,593    -73,524      9,273

KCBT
wheat          -2,982     -2,215     52,763     -2,598    -46,569      5,264


FUTURES
+ OPTS     Managed                 Swaps              Producer

                       
Net        Chg        Net        Chg        Net        Chg

Corn              
172,867    -55,748    269,969      5,767   -428,714     78,788

Soybeans          
105,048    -19,450    105,056        153   -168,327     23,589

Soymeal            
65,777      3,321     82,129        150   -184,276      4,119

Soyoil             
24,929     -8,677     80,173        623   -116,805     13,234

CBOT
wheat             -42     -1,063     61,498      4,491    -58,738      2,017

KCBT
wheat          22,037     -2,819     25,778       -809    -39,527      4,614

MGEX
wheat           5,131     -2,955        665        283     -6,434      5,760

                
———- ———- ———- ———- ———- ———-

Total
wheat         27,126     -6,837     87,941      3,965   -104,699     12,391


Live
cattle         14,297     -9,968     61,290     -2,153    -91,910      8,544

Feeder
cattle       -7,531     -2,211      3,645       -342      6,547      1,050

Lean
hogs           28,485     -2,155     52,545       -706    -69,029      2,659


Other             NonReport                  Open

                       
Net        Chg        Net        Chg   Interest        Chg

Corn         
      44,078    -23,825    -58,201     -4,983  1,854,508     -1,463

Soybeans           
-3,644       -331    -38,133     -3,960    805,841      5,375

Soymeal            
17,694     -2,881     18,677     -4,709    435,036      4,221

Soyoil              
7,324     -1,303      4,380     -3,878    414,025      9,387

CBOT
wheat           5,761     -2,471     -8,479     -2,976    387,076     11,528

KCBT
wheat          -5,075       -535     -3,214       -450    170,838       -642

MGEX
wheat           2,157       -902     -1,518     -2,186     65,698     -1,651

                
———- ———- ———- ———- ———- ———-

Total
wheat          2,843     -3,908    -13,211     -5,612    623,612      9,235


Live
cattle         19,646      2,119     -3,324      1,458    341,485       -258

Feeder
cattle        1,168        872     -3,830        632     54,342        234

Lean
hogs           -1,080        303    -10,921       -103    251,545     10,001


Macros

US
Change In Nonfarm Payrolls Jun: 372K (est 268K; prev 390K)

US
Unemployment Rate Jun: 3.6% (est 3.6%; prev 3.6%)

US
Average Hourly Earnings (M/M) Jun: 0.3% (est 0.3%; prev 0.3%)

US
Average Hourly Earnings (Y/Y) Jun: 5.1% (est 5.0%; prev 5.2%)

Revisions***
US Change In Nonfarm Payrolls Jun: 372K (est 268K; prevR 384K)

US
Unemployment Rate Jun: 3.6% (est 3.6%; prev 3.6%)

US
Average Hourly Earnings (M/M) Jun: 0.3% (est 0.3%; prevR 0.4%)

US
Average Hourly Earnings (Y/Y) Jun: 5.1% (est 5.0%; prevR 5.3%)


97
Counterparties Take $2.145 Tln At Fed Reverse Repo Op (prev $2.172 Tln, 102 Bids)


Corn

·        
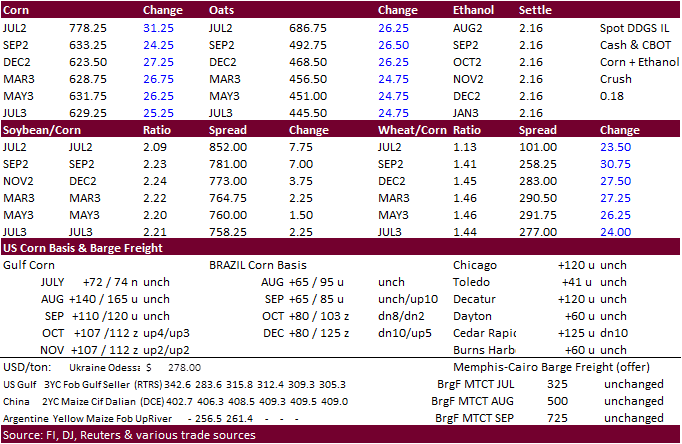
CBOT corn was higher on follow through technical buying and US wheat concerns. The midday weather forecast called for a strong high-pressure ridge for the heart of the US later this month. The 6–10-day weather outlook still has
very warm temperatures bias WCB and GP and net drying for the upper Midwest. 

·        
The central and southern Great Plains are currently seeing hot conditions.

·        
USDA export sales were again poor, and slowing demand is leading us to think 2021-22 ending stocks will be higher than what the trade has penciled in. The USD is lower, WTI crude oil turned higher and equities lower.

·        
Funds bought an estimated net 20,000 corn contracts.

·        
French corn conditions as of July 4 were rated 84% good or excellent, up slightly from 83% the previous week and compared with 89% a year earlier.


Export
developments.

·        
South Korea’s FLC bought 65,000 tons of corn at an estimated $321.29/ton c&f for arrival around October 25.


USDA
Attaché

China
Grain and Feed Update
https://lnks.gd/l/eyJhbGciOiJIUzI1NiJ9.eyJidWxsZXRpbl9saW5rX2lkIjoxMDAsInVyaSI6ImJwMjpjbGljayIsImJ1bGxldGluX2lkIjoiMjAyMjA3MDguNjA0ODkyNTEiLCJ1cmwiOiJodHRwczovL2FwcHMuZmFzLnVzZGEuZ292L25ld2dhaW5hcGkvYXBpL1JlcG9ydC9Eb3dubG9hZFJlcG9ydEJ5RmlsZU5hbWU_ZmlsZU5hbWU9R3JhaW4lMjBhbmQlMjBGZWVkJTIwVXBkYXRlX0JlaWppbmdfQ2hpbmElMjAtJTIwUGVvcGxlJTI3cyUyMFJlcHVibGljJTIwb2ZfQ0gyMDIyLTAwNzQucGRmIn0.hI6BMZThk7GWdj-AVoy42jCLaEcPxi1I9InEztETzL0/s/607563345/br/137061930813-l


Updated
7/1/22

September
corn is seen in a $5.50 and $7.50 range

December
corn is seen in a wide $5.00-$8.00 range


Soybeans

·        
CBOT soybean complex was higher on US weather concerns despite slow US export demand from lack of Chinese buying.

·        
Fundamentals have not changed. USDA export sales were poor and its unlikely US soybean exports will reach USDA’s current crop year projection based on actual shipments.  Don’t discount some selling in futures during the day session.

·        
Funds bought an estimated net 12,000 soybean contracts, bought 6,000 meal and bought 3,000 soybean oil.

·        
Indonesia now wants to set their biodiesel blend rate to 35 percent by the end of the month. They have been testing B40, an eventual target they want to hit. Indonesia’s palm oil stocks hit a high of 6.2 million tons following
the ban.

·        
Malaysian palm oil futures fell 11.6 percent this week, fourth weekly loss over the last five weeks. MPOB is due out July 12. June inventories are expected to be up 12.3 percent.


Export
Developments

·        
Results of China soybean state reserve auction were same as previous week, with no imported soybean sales sold, a sign China domestic end users are not in need of the product. AgriCensus
noted
2.4 million tons of China soybean reserves have been sold out of 7.8 million ton offered over the past 16 weekly auctions.

·        
China looks to sell a half a million tons of soybeans out of reserves on July 15.


USDA
Attaché

China
Oilseed Update

https://lnks.gd/l/eyJhbGciOiJIUzI1NiJ9.eyJidWxsZXRpbl9saW5rX2lkIjoxMDEsInVyaSI6ImJwMjpjbGljayIsImJ1bGxldGluX2lkIjoiMjAyMjA3MDguNjA0ODkyNTEiLCJ1cmwiOiJodHRwczovL2FwcHMuZmFzLnVzZGEuZ292L25ld2dhaW5hcGkvYXBpL1JlcG9ydC9Eb3dubG9hZFJlcG9ydEJ5RmlsZU5hbWU_ZmlsZU5hbWU9T2lsc2VlZHMlMjBhbmQlMjBQcm9kdWN0cyUyMFVwZGF0ZV9CZWlqaW5nX0NoaW5hJTIwLSUyMFBlb3BsZSUyN3MlMjBSZXB1YmxpYyUyMG9mX0NIMjAyMi0wMDc1LnBkZiJ9.6-DiAwt4I7YIZh4MWn2o0n0AW3qcBK2YtmI5G1aOdmM/s/607563345/br/137061930813-l


Due
out July 12.


Updated
7/8/22

Soybeans
– August $13.90-$16.00

Soybeans
– November is seen in a wide $12.75-$16.50 range

Soybean
meal – August $360-$440

Soybean
oil – August 57.00-64.00


Wheat

·        
US wheat futures ended sharply higher with US weather concerns for late planted winter wheat and hot temperatures for Western Europe. Lack of US producer selling added to the bullish undertone. Some producers are holding onto
their wheat with uncertainty over the quality of this year’s US wheat crop.

·        
Funds bought an estimated net 3,000 Chicago wheat contracts. 

·        
But not all the news and fundamental developments are bullish.

·        
The euro continues to weaken against the USD, and some think this the currency will go to parity. This is bullish EU wheat exports, and bearish for US exporters.

·        
USDA export sales slipped from the previous week but were within trade expectations.

·        
Ukraine collected 1.1 million tons of 2022 grains from about 3 percent of the planted area, mainly wheat and barley. 

·        
Russia continues to find new avenues for grain exports, and it seems the handful of buyers will be large enough to satisfy 2022-23 export projections, at least for wheat.

·        
US basis was mixed this week for the Gulf and PNW.

·        
CBOT Chicago wheat deliveries were 102 with no apparent commercial stoppers. 

·        
FOA’s food price index fell in June to 154.2 points versus 157.9 for May, 23.1 percent higher than a year earlier.

·        
France’s soft wheat harvest reached 14 percent as of July 4, up from 5 percent week earlier and compares to just 1 percent year ago. Soft wheat conditions fell one point to 63 percent.


US
Wheat Associates

“HRW
harvest has begun in Colorado and Nebraska. Overall, HRW lab results remain steady with data from 233 samples included in this week’s report. Harvest continues to progress in the SRW growing region with little to no change in data. The SW, HRS and Northern
durum crops are advancing steadily in very good condition.”

Chart

Description automatically generated


Export
Developments.

·        
Pakistan issued a new import tender for 300,000 tons of wheat, set to close July 18 for Aug 1-25 shipment.

·        
Results awaited on the Philippines seeking at least 50,000 tons of feed wheat for October to December shipment.

·        
Jordan seeks 120,000 tons of barley on July 14 for Nov/Dec shipment. They bought 60,000 tons on July 6.

·        
Japan seeks 70,000 tons of feed wheat and 40,000 tons of barley on July 13 for arrival by December 22.


Rice/Other

·        
(Bloomberg) — World 2022-23 cotton production seen 776,000 bales lower than USDA’s previous estimate, according to the avg in a Bloomberg survey of ten analysts.

Estimates
range from 119m to 122m bales

World
ending stocks seen down 321,000 bales to 82.45m bales

US
production seen 471,000 bales lower, and US ending stocks seen 31,000 bales lower


Updated
7/1/22

Chicago – September $7.75
to $9.50 range, December $8.00-$11.00

KC – September $8.00 to
$10.50 range, December $8.50-$12.00

MN – September $8.50‐$11.00, December $8.00-$12.50


USDA Export Sales

Another poor week of sales for the books. We are under the impression both
corn and soybean exports will fall short of USDA’s 2021-22 export projection, based on Census, inspection, and sales data.


Export Sales Highlights

This
summary is based on reports from exporters for the period June 24-30, 2022.

Wheat: Net
sales of 286,400 metric tons (MT) for 2022/2023 primarily for Taiwan (42,800 MT), Japan (39,500 MT), South Korea (36,100 MT), the Philippines (34,000 MT), and Mexico (32,400 MT, including decreases of 4,700 MT), were offset by reductions primarily for Italy
(10,000 MT) and Canada (3,200 MT).  Exports of 287,100 MT were primarily to Egypt (66,000 MT), Taiwan (62,800 MT), Mexico (58,200 MT), Colombia (38,200 MT), and Japan (31,800 MT). 

Corn: 
Net sales reductions of 66,600 MT for 2021/2022–a marketing-year low–were down noticeably from the previous week and from the prior 4-week average.  Increases primarily for Mexico (67,400 MT, including decreases of 2,700 MT), China (63,400 MT, including
68,000 MT switched from unknown destinations and decreases of 4,800 MT), Japan (49,200 MT, including 42,500 MT switched from unknown destinations and decreases of 700 MT), Colombia (14,000 MT, including 21,000 MT switched from unknown destinations and decreases
of 500 MT), and El Salvador (8,200 MT, including 7,500 MT switched from Guatemala, 3,300 MT switched from Colombia, 700 MT switched from Nicaragua, and decreases of 600 MT), were more than offset by reductions primarily for unknown destinations (137,600 MT)
and Canada (100,700 MT).  Net sales of 111,200 MT for 2022/2023 reported for China (84,000 MT), Saudi Arabia (30,000 MT), Guatemala (24,100 MT), Japan (3,000 MT), and Honduras (2,400 MT), were offset by reductions for Mexico (30,000 MT) and Canada (2,300 MT). 
Exports of 1,027,400 MT were down 18 percent from the previous week and 21 percent from the prior 4-week average.  The destinations were primarily to Mexico (302,000 MT), Japan (236,500 MT), China (199,200 MT), Canada (126,100 MT), and Honduras (47,000 MT). 

Optional Origin
Sales:
  For 2021/2022, the current
outstanding balance of 108,300 MT is for unknown destinations (65,000 MT), Italy (34,300 MT), and Saudi Arabia (9,000 MT).  For 2022/2023, the current outstanding balance of 35,400 MT is for Italy.

Barley:  Total
net sales of 1,800 MT for 2022/2023 were for South Korea.  No exports were reported for the week. 

Sorghum: 
Net sales of 54,000 MT for 2021/2022 were up noticeably from the previous week and up 96 percent from the prior 4-week average.  Increases were primarily for unknown destinations (50,000 MT), China (2,600 MT), and Mexico (1,000 MT).  Exports of 69,000 MT were
down 7 percent from the previous week and 52 percent from the prior 4-week average.  The destinations were primarily to China (67,600 MT) and Mexico (1,100 MT).

 Rice:  Net
sales of 30,400 MT for 2021/2022 were up 73 percent from the previous week, but down 2 percent from the prior 4-week average.  Increases primarily for Haiti (15,100 MT, including decreases of 200 MT), Nicaragua (6,000 MT), Honduras (5,100 MT), Canada (3,100
MT), and El Salvador (1,100 MT), were offset by reductions for Costa Rica (1,500 MT) and Argentina (300 MT).  Net sales of 1,600 MT for 2022/2023 were reported for Guatemala (1,100 MT) and El Salvador (500 MT).  Exports of 33,100 MT were down 28 percent from
the previous week and 42 percent from the prior 4-week average.  The destinations were primarily to Japan (19,600 MT), Haiti (7,100 MT), Canada (2,200 MT), Mexico (1,100 MT), and South Korea (900 MT).

Exports for
Own Account:
  For 2021/2022, new exports for own account totaling
100 MT were to Canada.  The current exports for own account outstanding balance is 100 MT, all Canada.

 Soybeans:  Net
sales reductions of 160,000 MT for 2021/2022–a marketing-year low–were up 33 percent from the previous week, but down noticeably from the prior 4-week average.  Increases primarily for the Netherlands (68,800 MT, including 63,000 MT switched from unknown
destinations and decreases of 200 MT), Germany (68,500 MT), Egypt (61,700 MT, including 52,000 MT switched from unknown destinations and decreases of 2,900 MT), Mexico (48,900 MT, including 47,500 MT switched from unknown destinations and decreases of 1,700
MT), and Colombia (17,100 MT, including 18,000 MT switched from unknown destinations and decreases of 2,600 MT), were more than offset by reductions primarily for unknown destinations (405,800 MT) and China (59,200 MT).  Net sales of 240,100 MT for 2022/2023
were primarily for unknown destinations (115,500 MT), Mexico (101,000 MT), and Colombia (17,500 MT).  Exports of 504,900 MT were down 3 percent from the previous week and 5 percent from the prior 4-week average.  The destinations were primarily to Mexico (125,300
MT), China (74,200 MT), the Netherlands (68,800 MT), Germany (68,500 MT), and Egypt (51,700 MT). 

 Export for
Own Account:
 For 2021/2022, the current exports for own account outstanding balance is 6,300 MT, all Canada.

 Export Adjustment: Accumulated
exports of soybeans to the Netherlands were adjusted down 68,525 MT for week ending June 9th.  The correct destination for this shipment is Germany.

Soybean Cake
and Meal:
  Net sales of 148,800 MT for 2021/2022 were up noticeably
from the previous week and up 47 percent from the prior 4-week average.  Increases primarily for the Philippines (107,300 MT), Colombia (21,300 MT, including decreases of 5,500 MT), Canada (6,900 MT, including decreases of 5,200 MT),
Belgium (4,600 MT), and Nicaragua (3,400 MT switched from Honduras), were offset by reductions primarily for Honduras (4,100 MT), Mexico (1,300 MT), Guatemala (800 MT), Ireland (800 MT), and Ecuador (700 MT).  Net sales of 30,400 MT for 2022/2023 were primarily
for Guatemala (14,900 MT), the Dominican Republic (14,000 MT), Japan (900 MT), and Canada (500 MT).  Exports of 237,000 MT were down 20 percent from the previous week and 2 percent from the prior 4-week average.  The destinations were primarily to the Philippines
(47,300 MT), Colombia (42,000 MT), Canada (25,800 MT), Honduras (24,700 MT), and Morocco (22,600 MT).

Soybean
Oil:
  No net sales were reported
for the week.  Exports of 800 MT were up noticeably from the previous week, but down 91 percent from the prior 4-week average.  The destination was primarily to Canada (700 MT). 

Cotton: 
Net sales of 37,400 RB for 2021/2022 were down 22 percent from the previous week and 57 percent from the prior 4-week average.  Increases primarily for Turkey (14,700 RB, including decreases of 15,100 RB), Vietnam (13,200 RB, including 2,200 RB switched from
South Korea and 400 RB switched from Japan), China (10,000 RB, including 100 RB switched from India), Peru (2,600 RB), and Taiwan (1,300 RB), were offset by reductions primarily for Thailand (2,500 RB), South Korea (2,200 RB), and India (1,300 RB).  Net sales
of 381,900 RB for 2022/2023 were primarily for Pakistan (98,700 RB), Turkey (95,500 RB), Bangladesh (66,100 RB), Vietnam (47,900 RB), and China (22,000 RB).  Exports of 377,800 RB were up 4 percent from the previous week and 7 percent from the prior 4-week
average.  The destinations were primarily to China (106,900 RB), Vietnam (58,800 RB), Turkey (51,500 RB), Pakistan (45,200 RB), and India (23,800 RB).  Net sales of Pima totaling 900 RB for 2021/2022 were up 19 percent from the previous week and 9 percent
from the prior 4-week average.  Increases were primarily for Thailand (600 RB), Italy (200 RB), and Malaysia (100 RB).  Net sales of 5,500 RB for 2022/2023 were reported for Turkey (3,300 RB), India (1,300 RB), and Germany (900 RB).  Exports of 10,500 RB were
up 64 percent from the previous week and 41 percent from the prior 4-week average.  The destinations were primarily to China (3,900 RB), Vietnam (1,900 RB), Thailand (1,700 RB), India (1,500 RB), and Ethiopia (500 RB). 

Optional
Origin Sales:
  For 2021/2022,
options were exercised to export 2,100 RB to Vietnam from the United States.  The current outstanding balance of 12,700 RB is for Vietnam (10,200 RB) and Pakistan (2,500 RB). 

Export
for Own Account:
 For 2021/2022,
new exports for own account totaling 16,600 RB were to Vietnam (10,900 RB) and China (5,700 RB).  Exports for own account totaling 5,200 RB primarily to Vietnam (4,000 RB) were applied to new or outstanding sales.  The current exports for own account outstanding
balance of 50,100 RB is for China (31,400 RB), Vietnam (13,900 RB), and Indonesia (4,800 RB).

Hides
and Skins:
  Net
sales of 314,700 pieces for 2022 were down 14 percent from the previous week and 27 percent from the prior 4-week average.  Increases primarily for
 China
(214,900 whole cattle hides, including decreases of 7,000 pieces), South Korea (46,400 whole cattle hides, including decreases of 500 pieces), Mexico (25,100, including decreases of 3,500 pieces), Japan (7,200 whole cattle hides), and Thailand (5,700 whole
cattle hides, including decreases of 400 pieces), were offset by reductions for Indonesia (200 pieces).  Exports of 343,600 pieces were down 23 percent from the previous week and 17 percent from the prior 4-week average.  Whole cattle hides exports were primarily
to China (198,500 pieces), Mexico (48,100 pieces), South Korea (40,500 pieces), Thailand (25,100 pieces), and Brazil (8,400 pieces). 

Net
sales of 255,300 wet blues for 2022 were up noticeably from the previous week and up 60 percent from the prior 4-week average.  Increases were primarily for Italy (97,600 unsplit and 19,100 grain splits, including decreases of 1,600 unsplit), China (85,400
unsplit, including decreases of 100 unsplit), Hong Kong (20,000 unsplit), Vietnam (13,800 unsplit), and Taiwan (7,500 grain splits).  Exports of 83,500 wet blues were down 30 percent from the previous week and 45 percent from the prior 4-week average.  The
destinations were primarily to China (28,900 unsplit), Vietnam (25,500 unsplit), Italy (14,200 unsplit and 3,000 grain splits), Taiwan (6,500 unsplit), and Thailand (3,100 unsplit).  Net sales of 561,300 splits were up noticeably from the previous week and
from the prior 4-week average.  Increases were primarily for Vietnam (495,100 pounds).  Exports of 515,500 pounds were up 44 percent from the previous week and 17 percent from the prior 4-week average. The destination was to Vietnam.

Beef:  Net
sales of 11,000 MT for 2022 were down 35 percent from the previous week and 30 percent from the prior 4-week average.  Increases primarily for Japan (6,300 MT, including decreases of 600 MT), South Korea (1,700 MT, including decreases of 500 MT), Canada (1,100
MT), Mexico (900 MT), and Vietnam (600 MT), were offset by reductions for China (1,600 MT) and the United Arab Emirates (100 MT).  Exports of 20,400 MT were up 3 percent from the previous week and 7 percent from the prior 4-week average.  The destinations
were primarily to Japan (5,500 MT), South Korea (4,400 MT), China (4,200 MT), Taiwan (1,400 MT), and Mexico (1,100 MT). 

Pork:  Net
sales of 31,200 MT for 2022 were down 3 percent from the previous week, but up 23 percent from the prior 4-week average.  Increases were primarily for Mexico (16,200 MT, including decreases of 200 MT), China (11,400 MT, including decreases of 200 MT), Japan
(1,100 MT, including decreases of 400 MT), Canada (900 MT, including decreases of 600 MT), and Australia (500 MT).  Exports of 32,200 MT were up 16 percent from the previous week and 19 percent from the prior 4-week average.  The destinations were primarily
to Mexico (16,100 MT), China (3,900 MT), Japan (3,800 MT), South Korea (3,000 MT), and Canada (1,400 MT).


U.S. EXPORT SALES FOR WEEK ENDING  6/30/2022


CURRENT MARKETING YEAR

NEXT MARKETING YEAR

COMMODITY

NET SALES

OUTSTANDING SALES

WEEKLY EXPORTS

ACCUMULATED EXPORTS

NET SALES

OUTSTANDING SALES

CURRENT YEAR

YEAR

AGO

CURRENT YEAR

YEAR

AGO


THOUSAND METRIC TONS

WHEAT


   HRW    

113.0

1,359.3

1,514.1

96.6

436.3

655.4

0.0

0.0

   SRW    

47.4

1,003.7

932.4

39.8

191.0

151.1

0.0

0.0

   HRS     

106.2

1,249.1

1,609.8

124.9

527.5

425.1

0.0

0.0

   WHITE   

29.8

903.2

1,079.4

25.8

274.2

283.6

0.0

0.0

   DURUM  

-10.0

94.4

8.4

0.0

18.0

31.6

0.0

0.0

     TOTAL

286.4

4,609.6

5,144.1

287.1

1,447.0

1,546.8

0.0

0.0

BARLEY

1.8

13.3

23.7

0.0

2.2

1.4

0.0

0.0

CORN

-66.6

7,858.9

11,034.3

1,027.4

52,498.4

58,685.9

111.2

6,488.1

SORGHUM

54.0

641.0

893.1

69.0

6,317.3

6,337.0

0.0

0.0

SOYBEANS

-160.0

7,724.4

3,410.3

504.9

52,165.4

58,494.0

240.1

13,737.7

SOY MEAL

148.8

2,056.6

2,329.9

237.0

9,208.5

9,120.6

30.4

576.3

SOY OIL

0.0

81.8

21.2

0.8

603.8

656.3

0.0

0.0

RICE


   L G RGH

12.1

82.5

224.5

0.4

1,246.5

1,532.3

1.6

13.1

   M S RGH

0.0

6.8

8.4

0.0

14.1

25.5

0.0

0.0

   L G BRN

0.1

3.1

11.9

0.5

51.6

39.5

0.0

0.0

   M&S BR

-0.2

9.6

22.9

0.0

78.0

133.8

0.0

0.0

   L G MLD

16.8

73.7

46.5

10.3

760.7

611.8

0.0

0.0

   M S MLD

1.6

114.6

117.5

21.8

420.5

570.6

0.0

0.0

     TOTAL

30.4

290.3

431.8

33.1

2,571.5

2,913.6

1.6

13.2

COTTON


THOUSAND RUNNING BALES      

   UPLAND

37.4

3,751.7

2,182.8

377.8

11,888.7

13,933.5

381.9

4,448.5

   PIMA

0.9

48.4

107.7

10.5

432.3

720.0

5.5

59.1


Terry Reilly

Senior Commodity Analyst – Grain and Oilseeds

Futures International
One Lincoln Center
18 W 140 Butterfield Rd.

Suite 1450

Oakbrook Terrace, Il. 60181

W: 312.604.1366

treilly@futures-int.com

ICE IM: 
treilly1

Skype: fi.treilly


Description: Description: Description: Description: FImail


Trading of futures, options, swaps and other derivatives is risky and is not suitable for all persons.  All of these investment products are leveraged, and you can lose more than your initial deposit.  Each investment product is offered
only to and from jurisdictions where solicitation and sale are lawful, and in accordance with applicable laws and regulations in such jurisdiction.  The information provided here should not be relied upon as a substitute for independent research before making
your investment decisions.  Futures International, LLC is merely providing this information for your general information and the information does not take into account any particular individual’s investment objectives, financial situation, or needs.  All investors
should obtain advice based on their unique situation before making any investment decision.  The contents of this communication and any attachments are for informational purposes only and under no circumstances should they be construed as an offer to buy or
sell, or a solicitation to buy or sell any future, option, swap or other derivative.  The sources for the information and any opinions in this communication are believed to be reliable, but Futures International, LLC does not warrant or guarantee the accuracy
of such information or opinions.  Futures International, LLC and its principals and employees may take positions different from any positions described in this communication.  Past results are not necessarily indicative of future results.