PDF Attached
Ukraine,
Russia, Turkey, and the UN may sign an agreement on Friday to secure Ukraine grain exports. Don’t expect a surge in volume over the short term if that happens. From demining at ports to logistical problems delivering grain, Ukraine will have a slow start to
get product out, if realized.
Very
slow trading day. CBOT soybeans traded lower. Wheat was two-sided, ending lower on late selling by the investment funds. The US weather forecast improved with additional rain expected for the Midwest next week. USD was down 40 points. The energy markets were
lower and are pressuring other commodity markets. USDA export sales reported some sales to China, and overall results were mixed.
![]()
Three
day fund selling total…
![]()
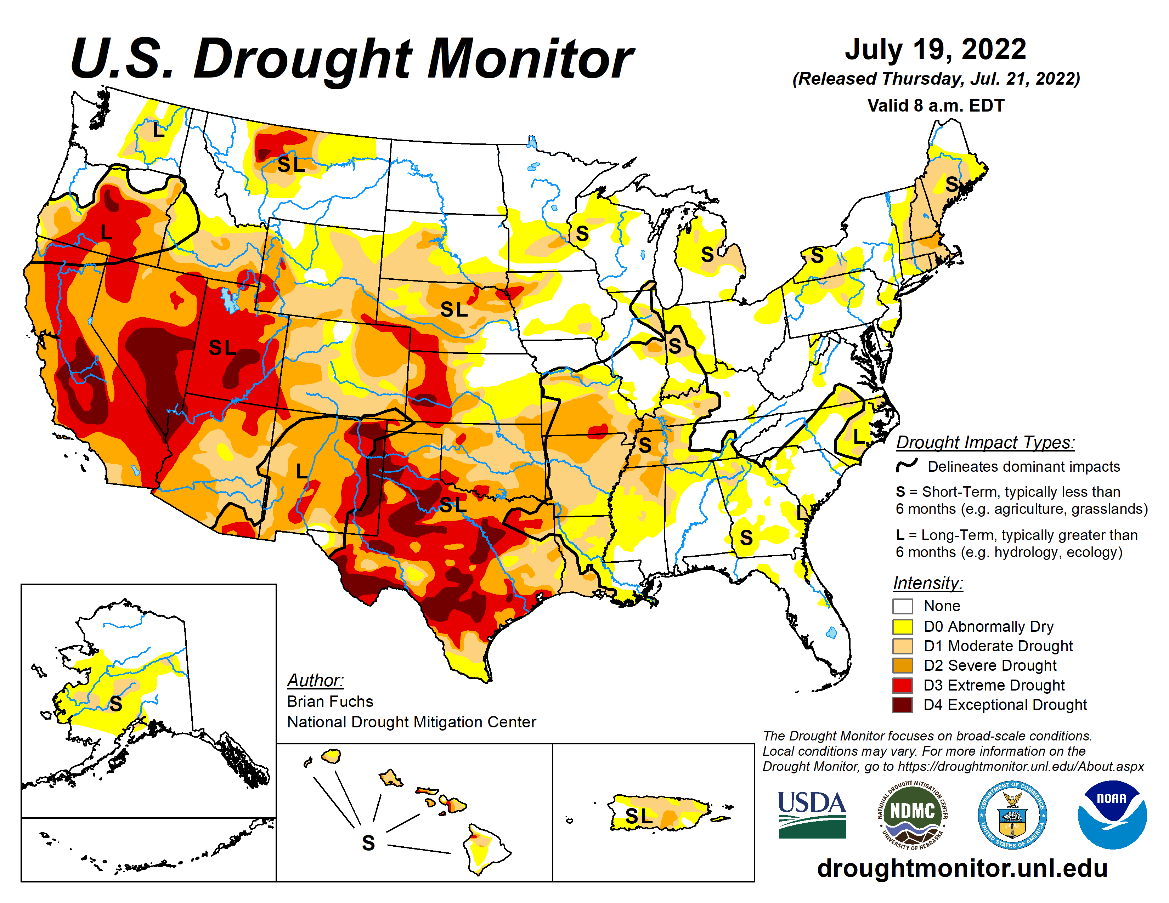
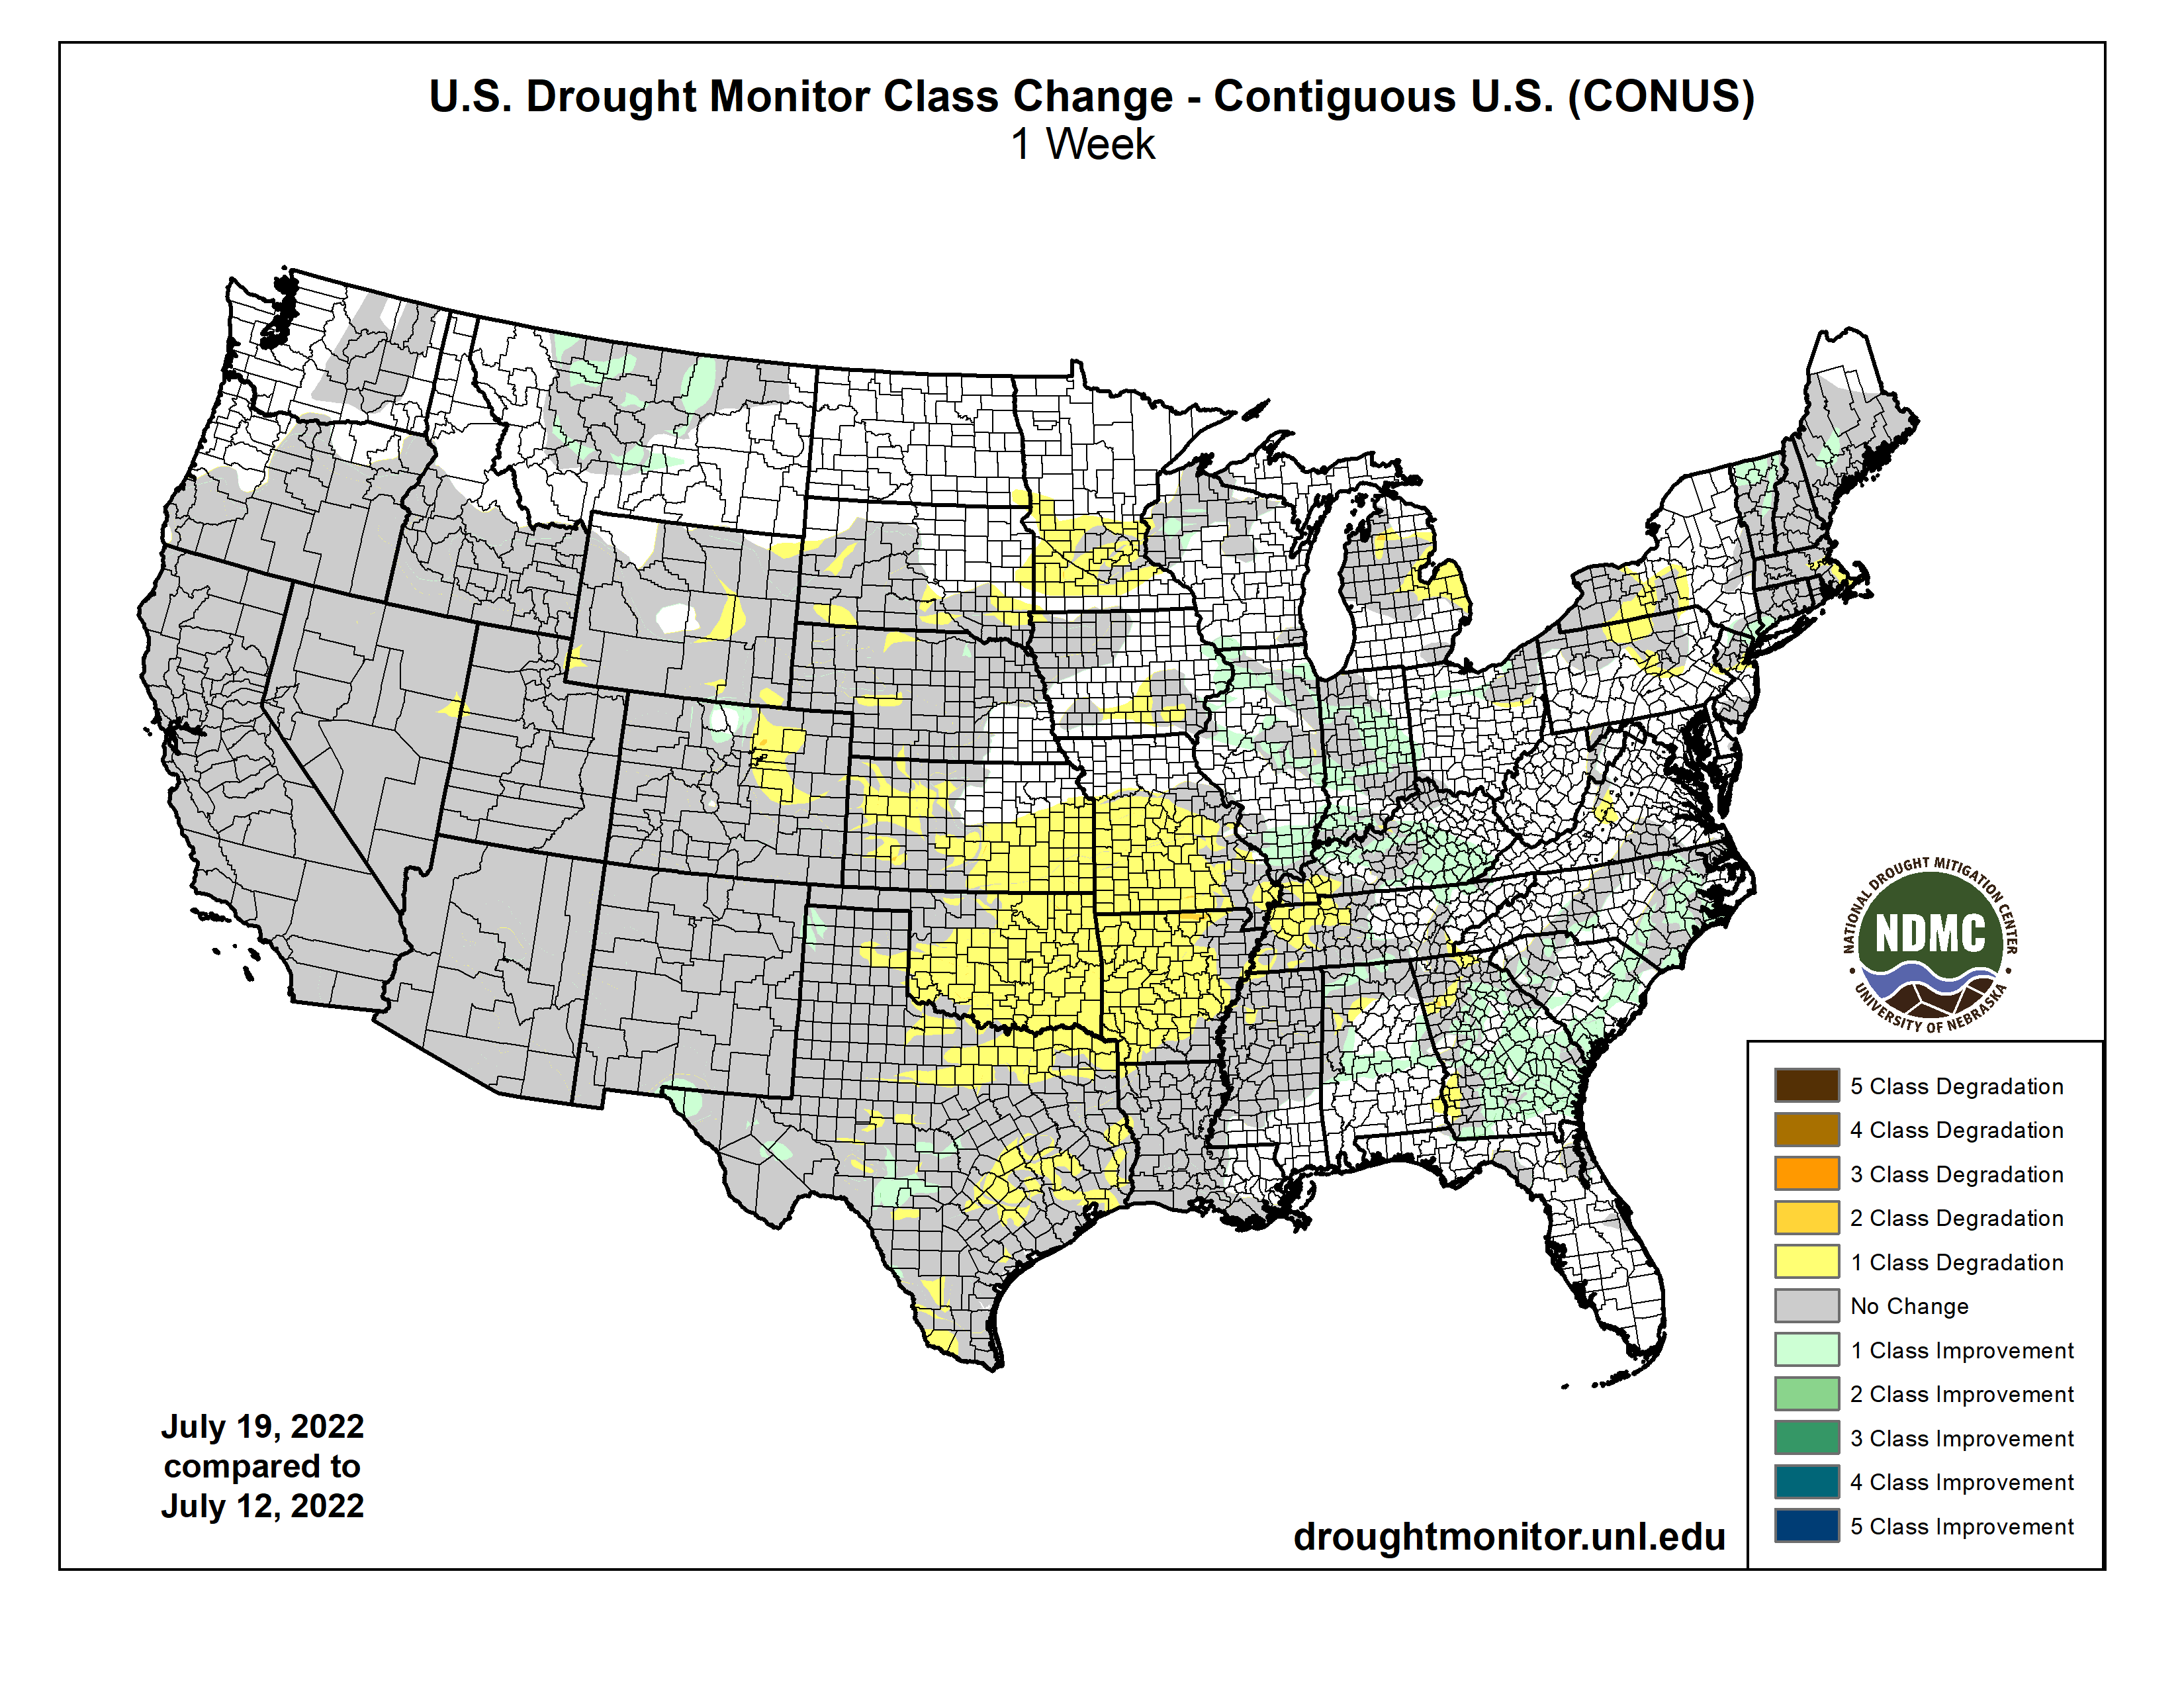
US
drought monitor showed a widespread change (drier) for the south-central GP and lower WCB.
World
Weather Inc.
WEATHER
TO WATCH AROUND THE WORLD
- NWS
30-day outlook puts most of the U.S. Midwest in a drier and warmer than usual mode for the month of August - Rainfall
was advertised to be greater than usual in Florida, southeastern Alabama, Georgia and areas northeast into southeastern Virginia as well as Arizona and far western New Mexico - A
large part of the Plains is also included in the warm and drier bias for the Plains - NWS
90-day outlook keeps most of the U.S. warmer than usual in the August through October period with below normal precipitation from the central Rocky Mountain region through most of the Great Plains and into the upper Midwest - Above
normal rainfall occurs from Florida and southeastern Alabama to New York and southern New England
- U.S.
weather is still advertised to be favorable in the coming ten days with rain for most areas; including some of the drier areas of the Plains and southwestern Corn Belt - Rain
advertised for northern and western Texas and Oklahoma does not occur significantly until late next week and into the following weekend - Some
of the advertised rain may be overdone and it will be totally dependent upon the cold surge from Canada being as great as advertised today - The
cold may be overdone and there is nearly a week between now and then for the model to moderate its outlook – so use some caution - Northern
U.S. Delta, Missouri, Kansas and neighboring areas will not likely get much rain or relief from recent hot and dry weather for another week - Showers
and thunderstorms should evolve late next week and into the following weekend offering a short term bout of relief - Much
more rain will be needed, though, to turn around crops and follow up rainfall may not be very great
- U.S.
northern Plains will get some timely rainfall in the next week to ten days, but some of it may be a little light especially in the northwest where the driest soil is present
- Excessive
heat in the central U.S. is expected to abate for a little while, but the next few days will continue hot enough to stress crops, livestock and humans from South Dakota to Texas - Highest
temperatures will be in the upper 90s to 110, although most readings will stay below 107 and the hottest readings will stay mostly in the southern Plains.
- All
of the heat should retreat into Texas late next week and into the following week while near to below average temperatures impact the northern Plains and Midwest - Drought
in the western United States will be intensified during the latter part of July because of a ridge of high pressure expected in the region and resulting hot and dry conditions - U.S.
southeastern states will continue to experience a favorable mix of weather for a little while longer, but may dry down next week and into the following weekend - Europe
heat and dryness will continue a concern for the next ten days - The
region of greatest concern will be from Slovakia into Greece where dryness is already significant in many areas - Warmer
than usual temperatures and restricted rainfall in these areas will keep crops stress and lower production will be inevitable in unirrigated corn, soybean, sorghum and sunseed production areas - Daily
high temperatures in the 90s Fahrenheit with some extremes over 100 are expected - Western
Europe will also continue drier biased, but temperatures will not be as hot as they were earlier this week, and a few showers may occur - Net
drying is expected to continue with France at the center of the most negatively impacted nations - Rain
will fall most often from Czech Republic into the Baltic States and Belarus including Poland where the best soil and crop conditions are likely - Russia’s
Southern Region will receive periods of rain and drizzle during the next several days while temperatures are cooler than usual - The
environment will be good for improving summer crops that have been recently stressed and strained by dryness
- Other
areas in Russia will experience a good mix of weather during the next ten days - Portions
of western and southern Ukraine are expected to miss out on rainfall during the next ten days to two weeks and that may raise the potential for crop moisture stress as time moves along - Argentina
rain potentials remain good for next week as two waves of moisture come into wheat production areas
- The
rain will bolster topsoil moisture for better germination, emergence and establishment, although follow up rain will be imperative
- Canada’s
Prairies weather will trend a little drier the remainder of this week and into next week, although some showers will occur periodically - Temperatures
will be near to normal with restricted rainfall - Crop
development should advance relatively well in most areas, but timely rain will soon be needed once again
- Southeastern
Canada crop conditions are rated favorably with little change likely for a while - Drought
in northeastern Mexico and the southern U.S. Plains is unlikely to change in the next two weeks
- Most
likely the only way drought will break in these areas will be from a tropical cyclone and none is expected for a while – at least not in that region.
- Many
corn, sorghum, citrus, sugarcane and dry bean crops are being negatively impacted in Mexico along with various other fruit and vegetable crops - Mexico
rain will be most abundant in the west and southern parts of the nation - India’s
monsoon is expected to continue performing favorably with widespread rain across most of the nation during the next couple of weeks - Central
and some northern parts of the nation may be a little too wet at times resulting in some flooding - Sufficient
breaks in the rain are expected to prevent a major flood from occurring - South
America temperatures over the next week will be near to above average with some cooling likely in Argentina and southern Brazil during the middle to latter part of next week - Brazil
rainfall will be minimal except in Atlantic coastal areas and in far southern Brazil - Rainfall
will be light, and some areas will experience net drying - Drying
in other areas of Brazil will be great for Safrinha crop harvesting - Most
of China’s crop region east of Tibet will get rain at one time or another during the next two weeks and all of it will be good for summer crop development - The
greatest rainfall may occur in east-central and northeastern parts of the nation
- Southeastern
China is expected to continue drying out through the next ten days and perhaps longer - Temperatures
will continue near to above normal - China’s
Xinjiang province continues to experience relatively good weather - A
few showers and thunderstorms are expected, but most of the region will be dry with temperatures varying greatly over the week to ten days - Tropical
Storm Estelle was located well west of Mexico in the eastern Pacific Ocean moving west northwesterly away from land - The
storm poses no threat to North America - There
were no other organized tropical cyclones in the world today, although a new disturbance is expected to evolve in the eastern Pacific later in this coming week
- Sumatra,
Indonesia rainfall remained restricted Wednesday - Below
average precipitation has occurred in many areas from northern and central Sumatra into northwestern Borneo in recent weeks and greater rain is needed - Locally
heavy rain fell in central Sumatra briefly Tuesday, but only a few areas were impacted - Some
increase in rain is expected in coming days, but amounts may continue lighter than usual in many areas
- Precipitation
will become more widespread next week - All
other Southeast Asian nations will experience an abundance of rainfall during the next few weeks resulting in some flooding in the Philippines and the Maritime provinces - Recent
rain has improved soil moisture in parts of Thailand after a drier than usual bias earlier this season - Australia
weather in the coming ten days will be favorable for most winter crops - Central
Queensland will get some rain today and Thursday, although it will be quite variable
- Rain
totals may range from 0.30 to 1.25 inches and locally more - Western
Australia will get most of the significant rain this week outside of central Queensland - Southeastern
parts of the nation will be driest this week, but rain will impact many areas next week
- South
Korea rice areas are still dealing with a serious drought, despite some rain that fell recently.
- Some
additional rain is expected over the next couple of weeks, and it should gradually be enough to ease dryness and crop stress, but production will be down - East-central
Africa rainfall will be greatest in central and western Ethiopia and lightest in parts of Uganda.
- Tanzania
is normally dry at this time of year, and it should be that way for the next few of weeks - Some
areas in Kenya are expected to trend wetter in the next ten days - West-central
Africa rainfall has been and will continue sufficient to support coffee, cocoa, sugarcane, rice and cotton development normally - Some
greater rain would still be welcome in the drier areas of Ivory Coast - Seasonal
rains are shifting northward leading to some drying in southern areas throughout west-central Africa - Cotton
areas are expecting much greater rainfall in the next couple of weeks and there is some potential for flooding - Flooding
is also possible in Guinea, Sierra Leone and southern Mali over the next couple weeks
- Mali
has been drier than usual over the past 30 days and rain would benefit cotton and many other crops – at least for a while - South
Africa’s crop moisture situation is favorable for winter crop establishment, although some additional rain might be welcome - Restricted
rainfall is expected for a while, but the crop is rated better than usual - Central
America rainfall will continue to be abundant to excessive and drying is needed - Rain
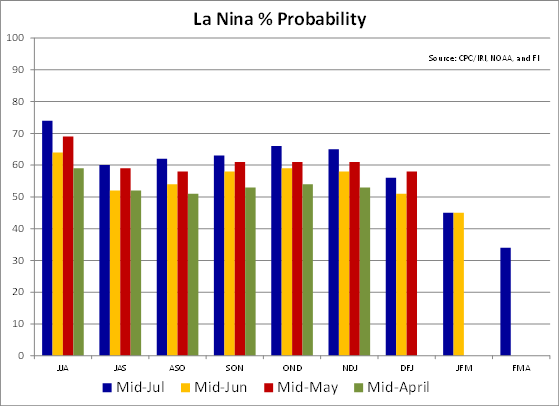
in the Greater Antilles will occur periodically, but no excessive amounts are likely - Today’s
Southern Oscillation Index was +9.69 and it will continue to move lower over the next several days - New
Zealand weather is expected to be well mixed over the next ten days - Temperatures
are expected to be a little cooler than usual - Rainfall
will be greater than usual in North Island in this coming week and near to below average in South Island
Source:
World Weather INC
Thursday,
July 21:
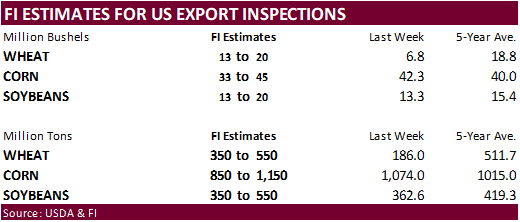
- International
Grains Council releases monthly report - USDA
weekly net-export sales for corn, soybeans, wheat, cotton, pork and beef, 8:30am - USDA
total milk and red meat production, 3pm
Friday,
July 22:
- ICE
Futures Europe weekly commitments of traders report - CFTC
commitments of traders weekly report on positions for various U.S. futures and options, 3:30pm - FranceAgriMer
weekly update on crop conditions - US
cattle inventory; cold storage data for beef, pork and poultry, 3pm
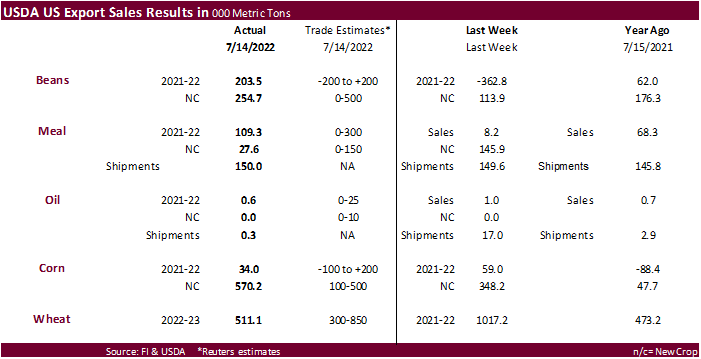
USDA
export sales
Old
crop soybeans posted a positive number just above trade expectations. New crop corn was above a trade range and wheat sales were good. Other sales posted were ok to poor. China bought a cargo of new crop corn, 2,100 tons of sorghum, 146,900 tons of current
crop year soybeans (125k switched from unknown), 136,000 new-crop soybeans, some beef & pork.
U.S.
GENERATED 491 MLN BIODIESEL (D4) BLENDING CREDITS IN JUNE, VS 513 MLN IN MAY -EPA
U.S.
GENERATED 1.29 BLN ETHANOL (D6) BLENDING CREDITS IN JUNE, VS 1.23 BLN IN MAY -EPA
VS.
2021
U.S.
GENERATED 428 MLN BIODIESEL (D4) BLENDING CREDITS IN JUNE, VS 397 MLN IN MAY -EPA
U.S.
GENERATED 1.27 BLN ETHANOL (D6) BLENDING CREDITS IN JUNE, VS 1.26 BLN IN MAY -EPA
Macros
ECB
RAISES MAIN REFINANCING RATE BY 50BPS TO 0.5%; EST. 0.250%
US
Initial Jobless Claims Jul 16: 251K (est 240K; 244K)
US
Continuing Claims Jul 9: 1384K (est 1340K; 1331K)
US
Philadelphia Fed Business Outlook Jul: -12.3 (est 0.8; prev-3.3)
Philadelphia
Fed Prices Paid Index July 52.2 Vs June 64.5
New
Orders Index July -24.8 Vs June -12.4
Employment
Index July 19.4 Vs June 28.1
Six-Month
Business Conditions July -18.6 Vs June -6.8
Six-Month
Capital Expenditures Outlook July 4.4 Vs June 11.7
Canadian
New House Price Index Jun: 0.2% (est 0.3%; prev 0.5%)
·
CBOT corn
ended sharply lower from a morning weather forecast calling for an improvement for the US Corn Belt. The midday weather forecast improved for the 1-5 and 11-15 day for temperatures bias US Midwest. Funds sold an estimated net 13,000 corn contracts.
·
Ukraine and Russia may sign an agreement on Friday to secure safe passage of grain ships.
·
We heard some end users were buying corn and wheat for coverage, taking advantage of the dips.
·
IGC estimated 2022-23 global corn production at 1.189 billion tons, up 1 million from previous and below 2021-22 of 1.220 billion tons.
·
South Korea’s MFG bought an estimated 66,000 tons of feed corn from South America or South Africa for arrival around November 21, at an estimated $317.99/ton C&F and 227 cents over the Dec corn contract.
·
South Korea’s NOFI bought an estimated 138,000 tons of feed corn from South America or South Africa for arrival during November, at an estimated $319.45/ton C&F.
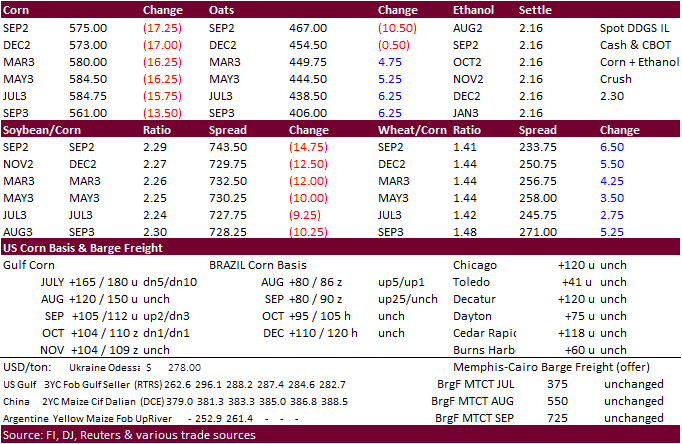
September
corn is seen in a $5.50 and $7.50 range
December
corn is seen in a wide $5.00-$8.00 range