PDF attached
USDA released their September supply and demand outlook
Reaction: Initially we were a little caught off guard USDA lowered the US soybean planted area, one factor that prompted buying in soybeans after prices dipped when the report was released. Overall US corn and soybean stocks for 2021-22 are still relatively tight, so traders that faded or liquidated their long position this week headed into the report are coming back to the market. For example, many ethanol traders lifted positions and were back in buying it this afternoon after seeing a report that was not wildly bearish.
We look for harvesting pressure to keep rallies limited going forward. Early corn yield reports suggest very good yields from Arkansas to Missouri, central IA, and southern IL.
USDA OCE Secretary Briefing
https://www.usda.gov/sites/default/files/documents/september-2021-wasde-lockup-briefing.pdf
USDA NASS Recap
https://www.nass.usda.gov/Newsroom/Executive_Briefings/2021/09-10-2021.pdf
USDA update.
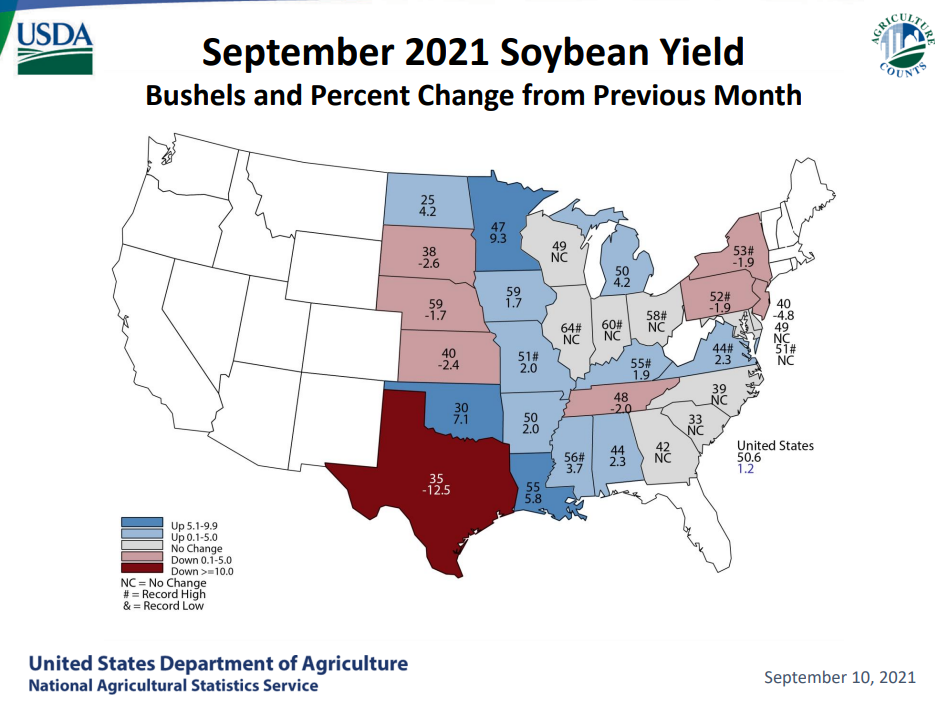
USDA’s estimate for the US soybean yield was 50.6, 0.2 above trade expectations and 0.6/bu above the August estimate. The harvested area was lowered 284,000 acres from a downward revision of 320,000 acres to the planted area to 87.235 million. This is a clear example why FSA prevented planting numbers should be only a consideration. They used all available data, including satellite and operator surveys. Note the planted area increased for IL, IA, MN, and NE. US production of 4.374 billion was 35 million above August, which was 3 million below trade expectations, and but still 239 million above 2020. The higher supply left USDA the ability to make proper adjustments to demand, starting with old crop. USDA took old crop crush down 15 million bushels, as expected, resulting in a 15 million bushel increase in the 2020-21 carryout. With the 2021-22 soybean carry in 15 million bushels higher and production 35 million higher, USDA lowered new-crop imports by 10 million and increased exports by 35 million, despite shipping concerns for the month of September out of the Gulf. They unexpectedly chopped new-crop crush by 25 million bushels, forcing them to reduce new-crop soybean oil domestic use by 200 million pounds and soybean meal domestic use by 650,000 short tons. US new-crop soybean meal production was reduced by the same amount, 650,000 short tons. 2021-22 US soybean oil production was reduced 290 million pounds. They took new-crop soybean oil imports down 150 million. Soybean oil for biodiesel for old crop was taken down 300 million pounds, more than expected, and new-crop soybean oil for biodiesel was lowed 500 million pounds. USDA’s new-crop soybean carryout was raised 30 million bushels, 5 million below an average trade guess. 2021-22 world soybean production fell 800,000 tons to 384.4 million, nearly 6 percent above 2020, China new-crop soybean imports were lowered 1 million tons to 101 million tons. New-crop ending stocks were raised 4.4 million tons to 98.9 million, 4 percent above 2020-21, in large part to an upward revision to 2020-21 global soybean stocks. Note USDA took current crop-year China imports of soybeans up 1 million tons to 99 million.
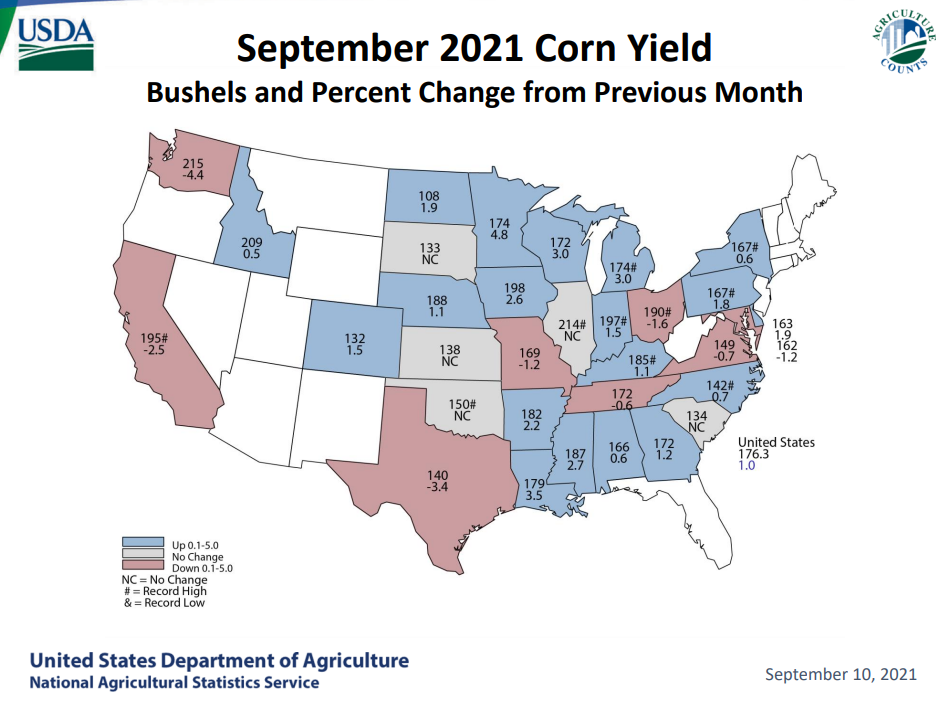
The US corn yield was taken up 1.7 bushel/acre to 176.3 bushels, 0.5 bushel above an average trade guess. The planted area was taken up 612,000 acres to 93.304 million, and harvested area upward revised by 590,000 acres to 85.085 million. US corn production was 14.996 billion, 54 million above the trade and 246 million above August. US old crop corn ending stocks were 1.187 billion, 70 million above August and 18 million above the trade guess. New-crop US corn stocks were 1.408 billion, 166 million above last month and 26 million above the trade guess. USDA lowered corn use for 2020-21 ethanol by 40 million bushels (remember last month it was taken up 25) and took exports down 30 million, resulting in a 70 million boost in the carry out. With US new-crop supply 316 million bushels higher, USDA raised feed use by 75 million and exports by 75 million. New crop stocks of 1.408 billion may sound comfortable, but the stocks to use ratio sits at 11.4%, well below out pivot comfort level of 15%. 2020-21 Brazil corn production was slashed 7 million tons to 86 million, still about 4 million tons above some trade estimate. New-crop global production was upward revised 3 million tons and stocks were revised higher by 6.4 million. USDA took new-crop Argentina production up 2.0 million tons.
US all wheat production was unchanged as they are currently surveying for the upcoming Small Grains Summary. USDA took 2021-22 US all-wheat ending stocks down 12 million bushels to 615 million by lowering imports by 10 million and raising food use by 2 million. There were minimal changes in the wheat by class balances. HRS and soft red stocks were taken down 5 million bushels, each. We view changes to the US wheat balance sheet as noneventful. 2021-22 Russian wheat production was taken down 12.5 million tons to 72.5 million and Canada was lowered 8.5 million tons to 23 million. USDA took Australia production up 3 million tons to 31.5 million. World wheat production was lowered 12.1 million tons and stocks revised down 8.5 million. The cut in Russian and Canadian production proves to bullish high protein wheat.
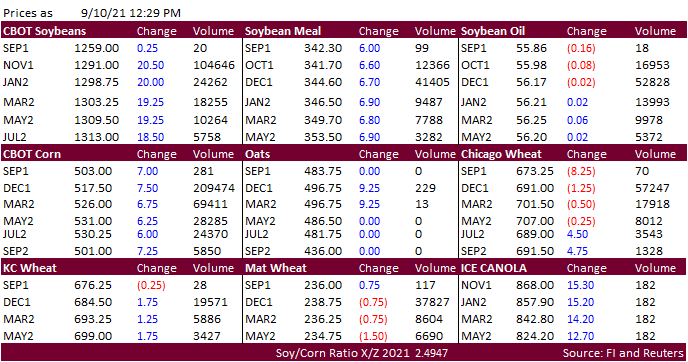
Price outlook – unchanged
December corn is seen in a $4.75-$6.00 range
Soybeans – November $11.75-$14.50 range
Soybean meal – December $320-$395
Soybean oil – December 52-65 cent range
December Chicago wheat is seen in a $6.50‐$7.80 range
December KC wheat is seen in a $6.40‐$8.00
December MN wheat is seen in a $8.45‐$9.50
Terry Reilly
Senior Commodity Analyst – Grain and Oilseeds
Futures International
One Lincoln Center
18 W 140 Butterfield Rd.
Oakbrook Terrace, Il. 60181
W: 312.604.1366
ICE IM: treilly1
Skype: fi.treilly

Trading of futures, options, swaps and other derivatives is risky and is not suitable for all persons. All of these investment products are leveraged, and you can lose more than your initial deposit. Each investment product is offered only to and from jurisdictions where solicitation and sale are lawful, and in accordance with applicable laws and regulations in such jurisdiction. The information provided here should not be relied upon as a substitute for independent research before making your investment decisions. Futures International, LLC is merely providing this information for your general information and the information does not take into account any particular individual’s investment objectives, financial situation, or needs. All investors should obtain advice based on their unique situation before making any investment decision. The contents of this communication and any attachments are for informational purposes only and under no circumstances should they be construed as an offer to buy or sell, or a solicitation to buy or sell any future, option, swap or other derivative. The sources for the information and any opinions in this communication are believed to be reliable, but Futures International, LLC does not warrant or guarantee the accuracy of such information or opinions. Futures International, LLC and its principals and employees may take positions different from any positions described in this communication. Past results are not necessarily indicative of future results.