USDA
S&D is this Friday
![]()
Conab
reported a higher-than-expected Brazil corn and soybean crop. Chicago wheat is higher on rumors China bought US wheat and follow through concerns over US and Canadian spring wheat seedings that are expected to slow over the next 14 days. Global export developments
for wheat are also supporting prices. Soybeans Turned lower post export sales.
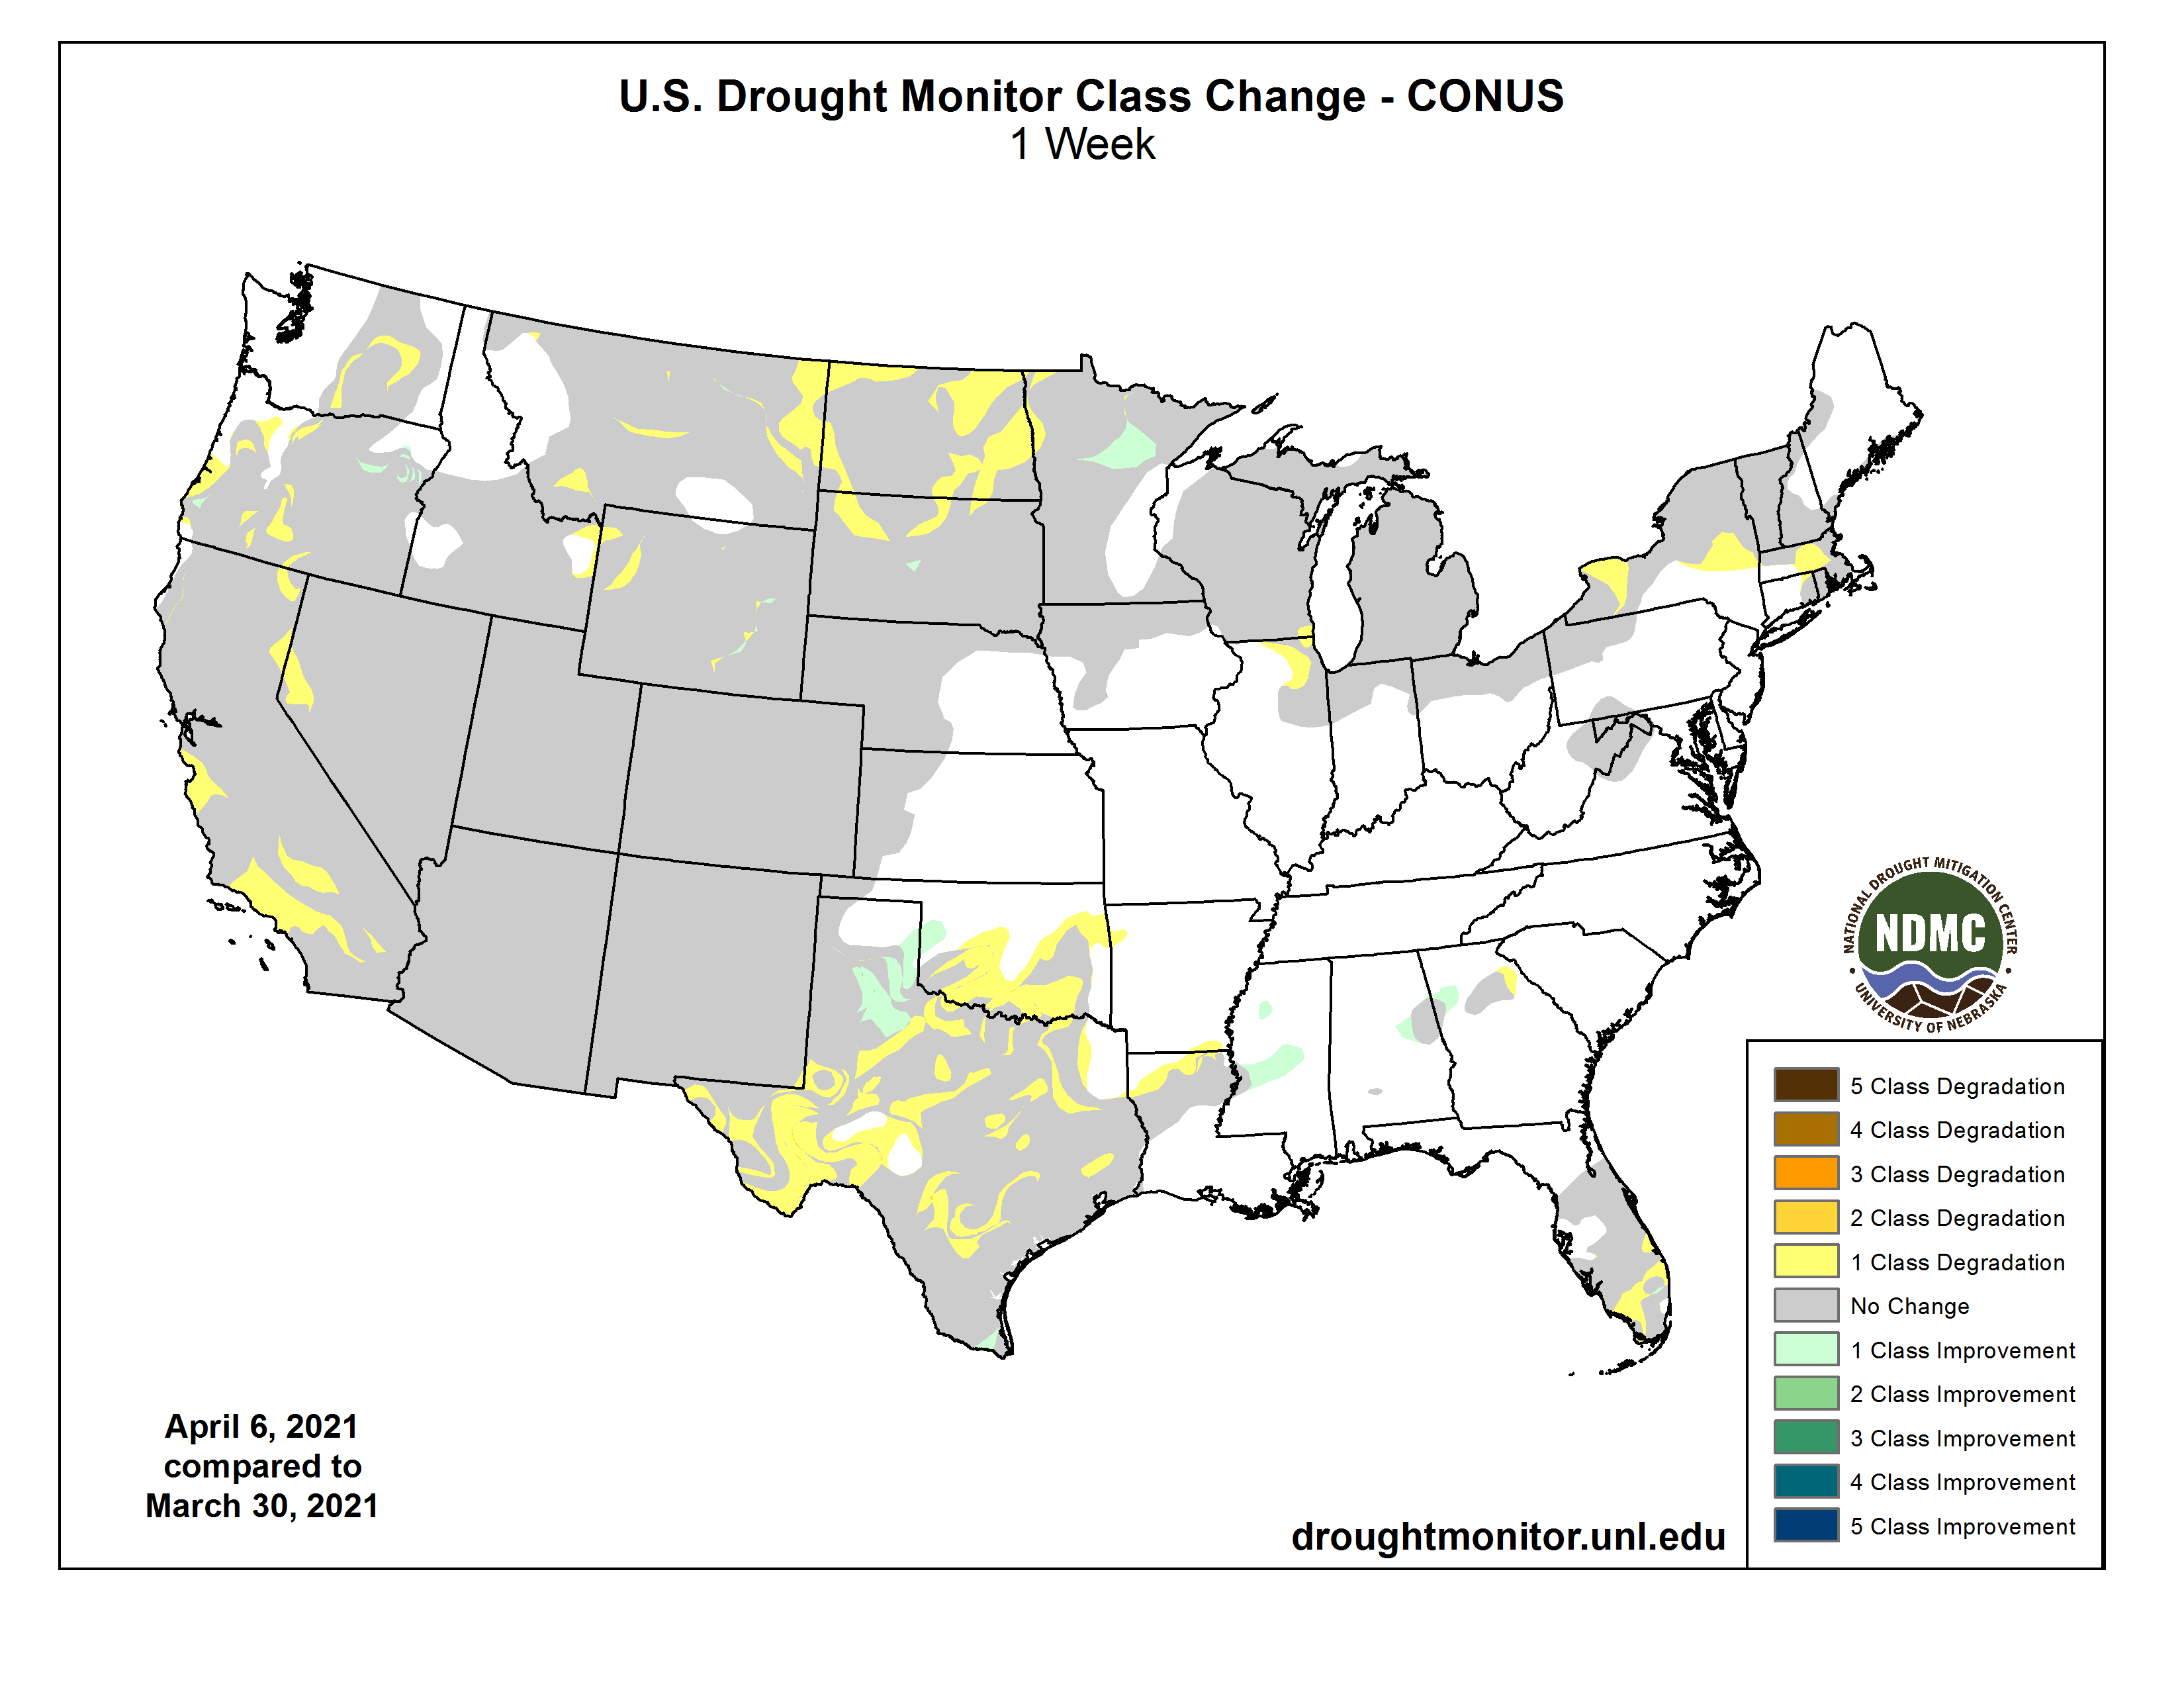
Cold
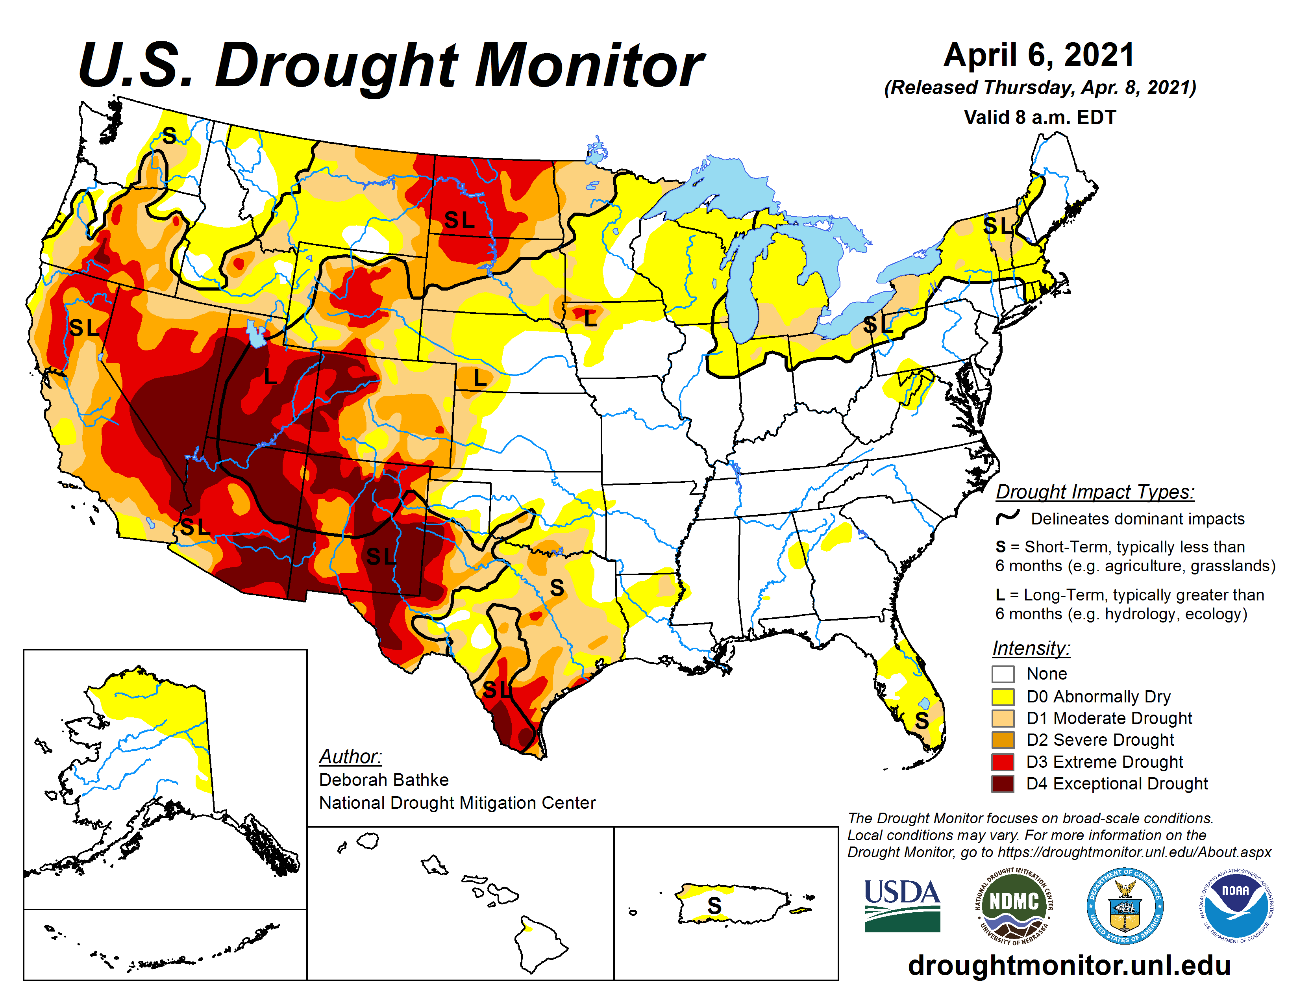
weather across Europe is now thought to limit crop growth. Earlier this week it was suggested there would be no impact. There are reports development stalled mid-week and the cold air will prevail through mid-next week. Dry weather across the northern Great
Plains and cold weather forecast during the 6-10 day and 8-14 day weather maps (for US and Canada) may hinder spring wheat seeding progress over the next two weeks.
U.S.
hard red winter wheat area precipitation prospects are improving. The northern Plains could see precipitation in the last ten days of this month (after April 02). Ongoing dry conditions in interior southern Brazil is of concern for second crop corn.

World
Weather Inc.
MARKET
WEATHER MENTALITY FOR CORN AND SOYBEANS:
Argentina
weather will remain very good for late season corn, sorghum, soybeans and peanuts. No area will be left too dry after rain falls into Saturday. Brazil weather will continue too dry in the interior south and portions of center south where crop stress is expected
to evolve as additional drying occurs through the next ten days.
U.S.
weather is looking relatively good for early season planting with rain this week helping to ensure good soil moisture for aggressive planting later this month. Field progress will not advance very well during the next ten days in some of the wetter areas,
but some progress is expected.
Western
Europe has turned cooler and will remain cool into next week. Not much coarse grain planting is expected right away, but some fieldwork should begin later this month. Warming in the western CIS will slowly bring rapeseed in Ukraine out of dormancy, but that
will be a slow process.
India’s
winter crops are maturing and will be harvested swiftly in the next few weeks. China’s winter crops need to warm up, but soil moisture is favorable for aggressive development once it does warm appropriately. Some rapeseed areas are a little too wet. China’s
spring planting will also advance well once warming kicks in.
South Africa summer crops have yielded well and should mature and be harvested in a favorable environment.
Overall,
weather today may support a mixed influence on market mentality.
MARKET
WEATHER MENTALITY FOR WHEAT: Rain advertised for the west-central and southwestern Plains next week will be good for wheat development if the rain verifies and the situation will be closely monitored. In the meantime, the northwestern U.S. Plains and southwestern
Canada’s Prairies will stay quite dry while a few other areas get light rain and snow. Greater rain potentials may evolve after April 20 in the southern Prairies and northern Plains.
Small
grain planting conditions in Europe were improving with warmer temperatures last weekend but cooling since then is limiting new crop development and could slow seed germination and plant emergence for a while. Winter crops in Europe are rated favorably with
those in the west coming out of dormancy. Most of the CIS winter crops are just beginning to green up in Ukraine and Russia’s Southern Region while still dormant elsewhere.
India’s
winter crops are maturing and expected to be harvested swiftly in the next few weeks. China’s winter crops are greening up in the north and in the vegetative stage of development in the south with huge production potentials this year.
Australia
will need rain later this month and next to support autumn planting and the prospects for that moisture are looking good.
North
Africa will get some rain this week, but more will be needed to induce the best possible crop development and production potential.
Overall,
weather today will likely produce a mixed influence on market mentality.
Source:
World Weather inc.
Bloomberg
Ag Calendar
Thursday,
April 8:
- FAO
World Food Price Index - USDA
weekly crop net-export sales for corn, soybeans, wheat, cotton, pork, beef, 8:30am - China’s
CNGOIC to publish soybean and corn reports - Conab’s
data on yield, area and output of corn and soybeans in Brazil - Port
of Rouen data on French grain exports
Friday,
April 9:
- USDA’s
monthly World Agricultural Supply and Demand (WASDE) report, noon - ICE
Futures Europe weekly commitments of traders report (6:30pm London) - CFTC
commitments of traders weekly report on positions for various U.S. futures and options, 3:30pm - FranceAgriMer
weekly update on crop conditions
Source:
Bloomberg and FI
USDA
Export Sales
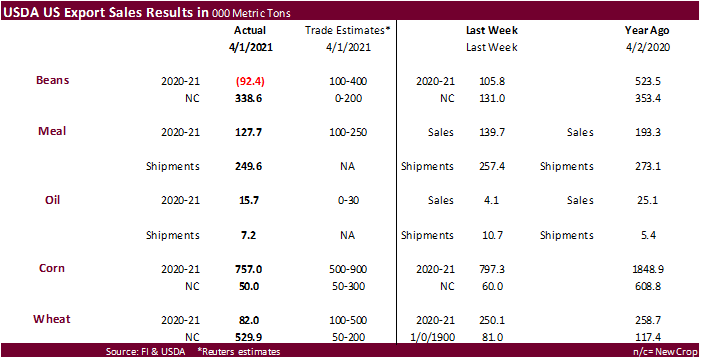
USDA
export sales showed China interest for new-crop US soybeans picking up while there were old crop cancelations. Don’t discount additional old-crop US soybean cancellations, given the availability of Brazilian soybeans and discount of new-crop US soybeans.
Macro
US
Initial Jobless Claims Apr 3: 744K (est 680K; prevR 728K; prev 719K)
US
Continuing Claims Mar 27: 3734K (est 3638K; prevR 3750K; prev 3794K)
- CBOT
corn futures
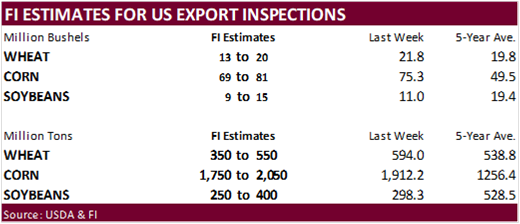
are higher following wheat and decent USDA export sales. - USDA
corn export sales were 757,000 tons, within expectations, with 285,300 tons for Japan and 247,600 tons for South Korea (a good chink switched from unknown). Corn sales also included 99,000 tons for China, including 70,000 tons switched from unknown.
- Sorghum
export sales were a net reduction of 500 tons. - Pork
sales were 33,400 tons and included 1,900 tons for China. South Korea was the largest pork buyer.
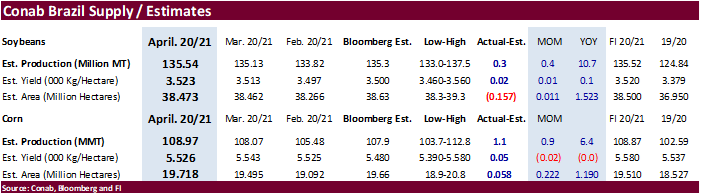
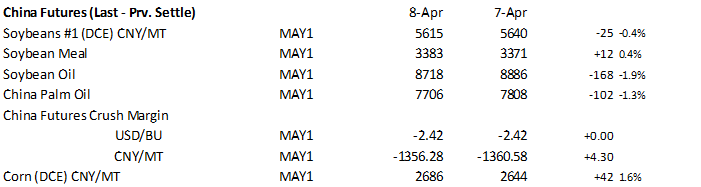
- Conab
reported a higher-than-expected Brazil corn and soybean crop. Corn production was 0.9 million tons above their March estimate at 109 million tons, 1.1 million above an average trade guess. Brazil soybean output was pegged at 135.5 million tons, up 0.4 million
from March and 300,000 tons above an average trade guess. - CNGOIC
estimated China corn imports a record 28 million tons of corn in 2020-21, triple previous year, and up 20 million tons from their previous projection. Imports of grains used for animal feed were seen at a record 43.2 million tons for 2020-21. Previous record
was 12.05 million tons in 2014-15. - The
Philippines this week lowered import tariffs on pork imports because of a domestic shortage. The import duty will drop to 5% from 30% for the first three months and then rise to 10% for month four through month twelve, effective immediately.
- Funds
on Wednesday bought an estimated net 12,000 corn contracts. - Weekly
ethanol production increased 10,000 barrels per day to 975,000 (trade looking for 3,000 decrease) and stocks were off 472,000 barrels (trade looking for up 55,000) to 20.642 million.
- The
USDA Broiler Report showed eggs set in the US up 4 percent and chicks placed down 2 percent. Cumulative placements from the week ending January 9, 2021 through April 3, 2021 for the United States were 2.43 billion. Cumulative placements were down 2 percent
from the same period a year earlier.
Export
developments.
-
None
reported
- CBOT
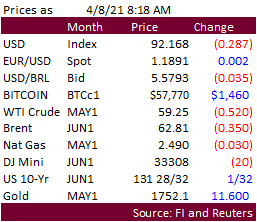
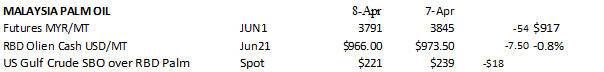
soybeans sold off post USDA export sales report. The USD was off 27 points around 8:13 am CT and WTI down about 61 cents. Offshore values are leading soybean oil higher and meal lower. Malaysian palm fell 54 points and cash was down $7.50 to $966/ton.
Brazil soybean output was pegged by Conab at 135.5 million tons, up 0.4 million from March and 300,000 tons above an average trade guess.
- USDA
soybean export sales for 2020-21 showed a net reduction of 92,500 tons. China cancelled 216,100 tons. For 2021-22, net sales of 338,600 tons were reported for China (264,000 MT), Taiwan (65,000 MT), and Mexico (10,000 MT). Soybean meal sales fell from the
previous week to 127,700 tons, low end of expectations, and shipments were 249,600 tons, slightly below the previous week. Soybean oil sales of 15,700 tons were more than three times than that of last week and included SK and Mexico. SBO shipments were 7,200
tons. - China
should start seeing an increase for Brazil soybean arrivals of this week into next week.
- US
premiums for soybean export new crop are nearing levels China will want to see to start securing new crop soybeans, but Chinese margins may need to improve before they start a round of buying from the US.
- ECB
basis has been firm. We heard Claypool bid April-May +50k, June-July +65N with new crop -25X.
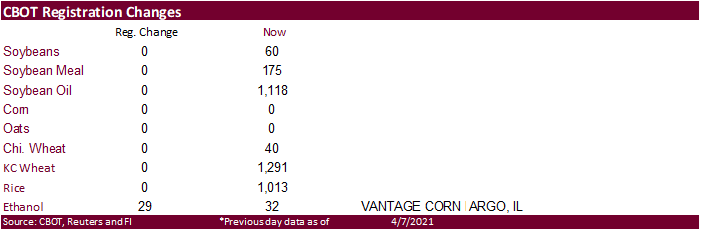
- There
were no changes to CBOT registrations. - Funds
on Wednesday sold an estimated net 5,000 soybean contracts, bought 2,000 soybean meal and sold an estimated 5,000 soybean oil.
- Offshore
values were leading CBOT SBO 52 points higher and meal $2.70 short ton lower.
- Rotterdam
soybean meal values were mixed form this time yesterday and Rotterdam vegetable oils mostly unchanged to 5 euros lower.
- China
cash crush margins on our analysis were 161 (163 previous) vs. 144 cents late last week and compares to 214 cents year earlier.
- China:
-
None
reported
- Chicago
wheat
is higher on rumors China bought US wheat and follow through concerns over US and Canadian spring wheat seedings that are expected to slow over the next 14 days. Global export developments for wheat are also supporting prices. Soybeans are higher in the front
months and corn higher on strength in wheat. - USDA
all-wheat sales were a marketing year low but the season is winding down for commitments. New-crop wheat export commitments were 529,900 tons, well above expectations and included a large 260,000 tons for China.
- The
World Price Index increased to 118.5 points from 116.1 for February, highest since June 2014. The vegetable oil index was up 8%, highest since June 2011.
- Cold
weather across Europe is now thought to limit crop growth. Earlier this week it was suggested there would be no impact. There are reports development stalled mid-week and the cold air will prevail through mid-next week.
- Two
thirds of the northern U.S. Plains spring wheat area will trend drier over the next week.
Cold
weather forecast in the 6-10 day and 8-14 day weather maps indicate conditions will hinder seeding progress over the next two weeks.
- The
World Price Index increased to 118.5 points from 116.1 for February, highest since June 2014. The vegetable oil index was up 8%, highest since June 2011.
- May
milling wheat was 3.50 euros higher, at 210.75 euros a ton. - Funds
on Wednesday bought and estimated net 2,000 CBOT SRW wheat contracts.
- Tunisia
bought 75,000 tons of optional origin soft wheat at an estimated $259.82, $262.42 and $259.89 a ton c&f for May 15 and June 25 shipment.
- Thailand
buyers bought 58,000 tons of feed wheat at around $275/ton c&f for June shipment. TFMA passed on a half million tons earlier this week.
- Taiwan
flour mills bought 96,485 tons of US wheat for May and June shipment off the PNW.
- 25,270
tons of 14.5% protein U.S. dark northern spring wheat at $285.04 a ton FOB - 15,390
tons of 12.5% protein hard red winter wheat at $262.81 a ton - 5,005
tons of soft white wheat of 9% protein bought at $260.79 a ton FOB. - 27,990
tons of dark northern spring wheat of 14.5% protein content bought at $285.04 a ton
- 16,500
tons of hard red winter wheat of 12.5% protein content bought at $262.81 - 6,490
ton of soft white wheat of 9% protein bought at $260.79 a ton FOB.
- Japan
in its weekly SGS import tender seeks 80,000 tons of feed wheat and 100,000 tons of barley for arrival by September 30.
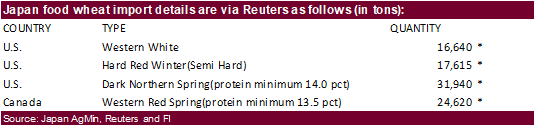
- Japan
bought 90,815 tons of food wheat this week from the US and Canada for June loading. Original details as follows:
- Ethiopia
seeks 30,000 tons of wheat on April 16. - Jordan
postponed their 120,000 ton import tender of animal feed barley from April 6 to April 13.
- Ethiopia seeks 400,000 tons
of optional origin milling wheat, on April 20, valid for 30 days. In January Ethiopia cancelled 600,000 tons of wheat from a November import tender because of contractual disagreements.
Rice/Other
·
Bangladesh seeks 50,000 tons of rice on April 18.
·
Ukraine seeks to import 110,000 tons of sugar in 2020-21.
·
Mauritius seeks 4,000 tons of optional origin long grain white rice on April 16 for delivery between June 1 and July 31.
·
Syria seeks 39,400 tons of white rice on April 19. Origin and type might be White Chinese rice or Egyptian short grain rice.
·
Ethiopia seeks 170,000 tons of parboiled rice on April 20.
U.S. EXPORT SALES FOR WEEK ENDING 4/1/2021
|
|
CURRENT MARKETING YEAR |
NEXT MARKETING YEAR |
||||||
|
COMMODITY |
NET SALES |
OUTSTANDING SALES |
WEEKLY EXPORTS |
ACCUMULATED EXPORTS |
NET SALES |
OUTSTANDING SALES |
||
|
CURRENT YEAR |
YEAR |
CURRENT YEAR |
YEAR |
|||||
|
|
THOUSAND METRIC TONS |
|||||||
|
WHEAT |
|
|
|
|
|
|
|
|
|
HRW |
34.1 |
1,271.8 |
1,702.9 |
189.0 |
7,276.1 |
7,715.0 |
90.7 |
387.2 |
|
SRW |
11.9 |
301.3 |
288.4 |
42.0 |
1,493.6 |
2,070.9 |
154.3 |
471.6 |
|
HRS |
71.3 |
1,408.1 |
1,566.6 |
213.9 |
6,140.9 |
5,785.0 |
53.5 |
422.1 |
|
WHITE |
-37.2 |
1,804.2 |
1,112.2 |
189.3 |
4,817.8 |
3,898.8 |
231.4 |
420.2 |
|
DURUM |
1.8 |
80.1 |
216.3 |
0.0 |
592.1 |
685.3 |
0.0 |
5.0 |
|
TOTAL |
82.0 |
4,865.5 |
4,886.3 |
634.2 |
20,320.5 |
20,155.1 |
529.9 |
1,706.0 |
|
BARLEY |
0.2 |
5.5 |
10.8 |
0.5 |
23.7 |
38.8 |
0.0 |
20.2 |
|
CORN |
757.0 |
30,512.1 |
14,159.5 |
2,053.4 |
35,971.0 |
19,596.9 |
50.0 |
2,049.5 |
|
SORGHUM |
-0.5 |
2,396.7 |
1,621.3 |
165.7 |
3,990.3 |
1,425.3 |
0.0 |
819.0 |
|
SOYBEANS |
-92.5 |
5,587.3 |
5,263.4 |
345.2 |
55,161.9 |
31,969.2 |
338.6 |
5,610.8 |
|
SOY MEAL |
127.7 |
2,354.9 |
2,771.8 |
249.6 |
6,709.2 |
6,208.4 |
4.8 |
254.8 |
|
SOY OIL |
15.7 |
115.9 |
306.0 |
7.2 |
539.0 |
618.0 |
0.0 |
0.6 |
|
RICE |
|
|
|
|
|
|
|
|
|
L G RGH |
14.7 |
317.2 |
300.8 |
13.7 |
1,106.3 |
1,031.5 |
0.0 |
0.0 |
|
M S RGH |
0.0 |
5.3 |
43.7 |
0.0 |
23.5 |
25.6 |
0.0 |
0.0 |
|
L G BRN |
14.6 |
17.8 |
16.4 |
0.5 |
34.4 |
41.1 |
0.0 |
0.0 |
|
M&S BR |
0.7 |
69.0 |
61.5 |
0.7 |
85.1 |
46.9 |
0.0 |
0.0 |
|
L G MLD |
3.9 |
49.8 |
70.6 |
3.5 |
457.0 |
673.8 |
0.0 |
0.0 |
|
M S MLD |
10.1 |
258.7 |
267.3 |
12.4 |
382.0 |
409.9 |
0.0 |
0.0 |
|
TOTAL |
44.0 |
718.0 |
760.2 |
30.7 |
2,088.4 |
2,228.8 |
0.0 |
0.0 |
|
COTTON |
|
THOUSAND RUNNING BALES |
||||||
|
UPLAND |
269.9 |
5,003.7 |
6,173.3 |
371.7 |
9,843.3 |
9,113.9 |
49.0 |
1,591.9 |
|
PIMA |
7.5 |
233.4 |
179.8 |
21.6 |
513.4 |
361.6 |
0.0 |
1.1 |
This
summary is based on reports from exporters for the period March 26-April 1, 2021.
Wheat: Net
sales of 82,000 metric tons (MT) for 2020/2021–a marketing-year low–were down 67 percent from the previous week and 75 percent from the prior 4-week average. Increases primarily for South Korea (49,300 MT, including 45,000 MT switched from unknown destinations
and decreases of 3,900 MT), the Philippines (29,300 MT), Japan (28,900 MT), Mexico (23,500 MT, including decreases of 3,900 MT), and Panama (19,300 MT), were offset by reductions primarily for China (56,700 MT), unknown destinations (50,000 MT), and El Salvador
(7,500 MT). For 2021/2022, net sales of 529,900 MT were primarily for China (260,000 MT), unknown destinations (154,600 MT), South Korea (83,000 MT), Honduras (15,000 MT), and the Dominican Republic (12,500 MT). Exports of 634,200 MT were up noticeably from
the previous week and up 23 percent from the prior 4-week average. The destinations were primarily to China (200,300 MT), Mexico (129,100 MT), South Korea (123,400 MT), the Philippines (57,200 MT), and Ecuador (29,500 MT).
Optional
Origin Sales:
For 2020/2021, new optional origin sales of 29,000 MT were reported for Spain. The current outstanding balance of 29,000 MT is for Spain.
Corn:
Net sales of 757,000 MT for 2020/2021 were down 5 percent from the previous week and 54 percent from the prior 4-week average. Increases primarily for Japan (285,300 MT, including 135,300 MT switched from unknown destinations and decreases of 2,900 MT), South
Korea (247,600 MT, including decreases of 20,200 MT), Colombia (122,200 MT, including 50,000 MT switched from unknown destinations and decreases of 8,700 MT), China (99,000 MT, including 70,000 MT switched from unknown destinations), and Mexico (67,700 MT,
including decreases of 10,000 MT), were offset by reductions primarily for unknown destinations (164,800 MT). For 2021/2022, net sales of 50,000 MT reported for Mexico (90,000 MT) and Guatemala (10,000 MT), were offset by reductions for unknown destinations
(50,000 MT). Exports of 2,053,400 MT were up 4 percent from the previous week and 6 percent from the prior 4-week average. The destinations were primarily to China (578,500 MT), Mexico (473,600 MT), Japan (366,100 MT), South Korea (242,500 MT), and Colombia
(120,400 MT).
Optional
Origin Sales:
For 2020/2021, options were exercised to export 202,000 MT to South Korea from the United States. Options were exercised to export 56,100 MT to China from other than the United States. Decreases totaling 4,800 MT were reported for China. The current outstanding
balance of 567,800 MT is for South Korea (282,000 MT), unknown destinations (244,500 MT), the Ukraine (32,400 MT), and China (8,900 MT).
Barley:
Net sales of 200 MT for 2020/2021 were up 97 percent from the previous week, but down noticeably from the prior 4-week average. Increases were for Taiwan (200 MT). Exports of 500 MT were up 24 percent from the previous
week and 52 percent from the prior 4-week average. The destinations were primarily to Canada (300 MT) and Taiwan (200 MT).
Sorghum:
Net sales reductions of 500 MT for 2020/2021 were down noticeably from the previous week and from the prior 4-week average. Increases for China (54,500 MT, including decreases of 3,300 MT), were offset by reductions for
unknown destinations (55,000 MT). Exports of 165,700 MT were down 46 percent from the previous week and 16 percent from the prior 4-week average. The destination was primarily to China (165,600 MT).
Rice:
Net sales of 44,000 MT for 2020/2021 were down 21 percent from the previous week and 30 percent from the prior 4-week average. Increases were primarily for Haiti (14,500 MT), Panama (9,700 MT), Mexico (6,800 MT), Canada (3,200 MT), and Jordan (3,100 MT).
Exports of 30,700 MT were down 51 percent from the previous week and 45 percent from the prior 4-week average. The destinations were primarily to Mexico (15,300 MT), Saudi Arabia (3,300 MT), Canada (2,700 MT), Jordan (1,800 MT), and South Korea (1,600 MT).
Soybeans:
Net sales reductions 92,500 MT for 2020/2021–a marketing-year low–were down noticeably from the previous week and from the prior 4-week average. Increases primarily for Egypt (66,200 MT, including 65,000 MT switched from unknown destinations and decreases
of 2,500 MT), Japan (40,700 MT, including 8,800 MT switched from unknown destinations), Indonesia (21,100 MT, including decreases of 200 MT), Mexico (13,200 MT, including decreases of 900 MT), and Saudi Arabia (10,400 MT, including 9,500 MT switched from unknown
destinations), were offset by reductions primarily for China (216,100 MT). For 2021/2022, net sales of 338,600 MT were reported for China (264,000 MT), Taiwan (65,000 MT), Mexico (10,000 MT), and Thailand (300 MT), were offset by reductions for Japan (700
MT). Exports of 345,200 MT–a marketing-year low–were down 25 percent from the previous week and 37 percent from the prior 4-week average. The destinations were primarily to Egypt (119,200 MT), Mexico (76,500 MT), Costa Rica (27,100 MT), Indonesia (26,100
MT), and Taiwan (18,500 MT).
Exports
for Own Account:
For 2020/2021, the current exports for own account outstanding balance is 5,800 MT, all Canada.
Soybean
Cake and Meal:
Net sales of 127,700 MT for 2020/2021 were down 9 percent from the previous week and 36 percent from the prior 4-week average. Increases primarily for Mexico (40,900 MT), Canada (39,300 MT, including decreases of 700 MT), Colombia (16,800 MT, including decreases
of 2,700 MT), Japan (8,500 MT), and Belgium (5,900 MT), were offset by reductions for El Salvador (5,100 MT) and Jamaica (4,400 MT). For 2021/2022, net sales of 4,800 MT were primarily for Mexico. Exports of 249,600 MT were down 3 percent from the previous
week and 1 percent from the prior 4-week average. The destinations were primarily to the Philippines (43,100 MT), Mexico (35,100 MT), Canada (34,000 MT), the Dominican Republic (32,000 MT), and Colombia (27,600 MT).
Soybean
Oil:
Net sales of 15,700 MT for 2020/2021 were up noticeably from the previous week and up 53 percent from the prior 4-week average. Increases primarily for South Korea (15,000 MT), Mexico (700 MT), and the Dominican Republic (500 MT), were offset by reductions
for Colombia (500 MT). Exports of 7,200 MT were down 32 percent from the previous week and 69 percent from the prior 4-week average. The destinations were primarily to South Korea (5,300 MT), Mexico (1,200 MT), and Canada (700 MT).
Cotton:
Net sales of 269,900 RB for 2020/2021 were up noticeably from the previous week and up 8 percent from the prior 4-week average. Increases primarily for Vietnam (136,200 RB, including 4,400 RB switched from China and 2,200 RB switched from Hong Kong), Pakistan
(49,900 RB, including decreases of 200 RB), China (31,200 RB, including decreases of 8,300 RB), Turkey (21,800 RB), and South Korea (7,900 RB), were offset by reductions primarily for Hong Kong (2,200 RB) and Malaysia (300 RB). For 2021/2022, net sales of
49,000 RB were primarily for Indonesia (13,200 RB), China (13,200 RB), Turkey (11,800 RB), Pakistan (5,700 RB), and Mexico (2,600 RB). Exports of 371,700 RB were up 15 percent from the previous week and 11 percent from the prior 4-week average. Exports were
primarily to Vietnam (121,200 RB), Pakistan (53,000 RB), Turkey (51,300 RB), China (45,800 RB), and Mexico (16,700 RB). Net sales of Pima totaling 7,500 RB were up 73 percent from the previous week, but down 2 percent from the prior 4-week average. Increases
primarily for China (4,400 RB), Pakistan (1,500 RB, including 1,100 RB switched from the United Arab Emirates), India (700 RB, including decreases of 100 RB), Greece (400 RB), and Turkey (400 RB), were offset by reductions primarily for the United Arab Emirates
(1,100 RB) and Japan (200 RB). Exports of 21,600 RB were up 51 percent from the previous week and 50 percent from the prior 4-week average. The destinations were primarily to India (7,200 RB), China (4,800 RB), Peru (3,200 RB), Pakistan (2,400 RB), and Austria
(900 RB).
Exports
for Own Account:
For 2020/2021, new exports for own account totaling 2,400 RB were primarily to Vietnam (1,300 RB) and China (1,000 RB). Exports for own account totaling 1,100 RB to Vietnam were applied to new or outstanding sales. The current exports for own account outstanding
balance of 31,500 RB is for China (24,600 RB), Vietnam (6,300 RB), and Bangladesh (600 RB).
Hides
and Skins:
Net sales of 399,900 pieces for 2021 were up 12 percent from the previous week, but down 20 percent from the prior 4-week average. Increases primarily for China (276,000 whole cattle hides, including decreases of 14,200 pieces), South Korea (52,400 whole
cattle hides, including decreases of 200 pieces), Thailand (45,700 whole cattle hides, including decreases of 100 pieces), Brazil (14,000 whole cattle hides, including decreases of 700 pieces), and Taiwan (8,900 whole cattle hides, including decreases of 1,300
pieces), were offset by reductions for Italy (200 pieces), Indonesia (200 pieces), and India (100 pieces). Exports of 367,900 pieces for 2021 were down 11 percent from the previous week and 5 percent from the prior 4-week average. Whole cattle hides exports
were primarily to China (242,300 pieces), South Korea (44,700 pieces), Mexico (22,000 pieces), Thailand (17,400 pieces), and Taiwan (15,800 pieces).
Net
sales of 64,100 wet blues for 2021 were down 71 percent from the previous week and 62 percent from the prior 4-week average. Increases reported for China (25,500 unsplit, including decreases of 100 grain splits), Mexico (20,000 grain splits and 4,300 unsplit),
Vietnam (12,300 unsplit, including decreases of 200 pieces), and Brazil (2,600 unsplit), were offset by reductions primarily for Thailand (200 unsplit) and Italy (200 unsplit). Exports of 119,800 wet blues for 2021 were down 28 percent from the previous week,
but up 1 percent from the prior 4-week average. The destinations were primarily to Vietnam (41,000 unsplit), Italy (23,000 unsplit and 1,600 grain splits), China (24,500 unsplit), Brazil (10,300 unsplit), and Mexico (6,500 grain splits and 2,800 unsplit).
Net sales of 927,400 splits were for Vietnam (600,000 pounds) and China (327,400 pounds, including decreases of 18,600 pounds). Exports of 364,600 pounds were to Vietnam (280,000 pounds) and China (84,600 pounds).
Beef:
Net
sales of 18,200 MT reported for 2021 were down 3 percent from the previous week and 14 percent from the prior 4-week average. Increases primarily for South Korea (9,100 MT, including decreases of 700 MT), Japan (4,200 MT, including decreases of 400 MT), China
(1,900 MT, including decreases of 100 MT), Mexico (1,300 MT, including decreases of 100 MT), and Taiwan (700 MT, including decreases of 100 MT),
were
offset by reductions primarily for the Philippines (300 MT) and Vietnam (100 MT).
Exports of 18,800 MT were up 1 percent from the previous week and 4 percent from the prior 4-week average. The destinations were primarily to South Korea (6,500 MT), Japan (4,700 MT), China (3,200 MT), Mexico (1,100 MT),
and Taiwan (1,000 MT).
Pork:
Net
sales of 33,400 MT reported for 2021 were down 45 percent from the previous week and 22 percent from the prior 4-week average. Increases were primarily for Mexico (23,000 MT, including decreases of 500 MT), Japan (3,400 MT, including decreases of 300 MT),
Australia (1,600 MT, including decreases of 100 MT), China (1,200 MT, including decreases of 1,000 MT), and South Korea (1,200 MT, including decreases of 400 MT). Exports of 38,400 MT were down 5 percent from the previous week and 3 percent from the prior
4-week average. The destinations were primarily to China (13,400 MT), Mexico (7,800 MT), Japan (5,400 MT), South Korea (3,300 MT), and the Philippines (1,700 MT).
Terry Reilly
Senior Commodity Analyst – Grain and Oilseeds
Futures International
One Lincoln Center
18 W 140 Butterfield Rd.
Oakbrook Terrace, Il. 60181
W: 312.604.1366
ICE IM:
treilly1
Skype: fi.treilly

Trading of futures, options, swaps and other derivatives is risky and is not suitable for all persons. All of these investment products are leveraged, and you can lose more than your initial deposit. Each investment product is offered
only to and from jurisdictions where solicitation and sale are lawful, and in accordance with applicable laws and regulations in such jurisdiction. The information provided here should not be relied upon as a substitute for independent research before making
your investment decisions. Futures International, LLC is merely providing this information for your general information and the information does not take into account any particular individual’s investment objectives, financial situation, or needs. All investors
should obtain advice based on their unique situation before making any investment decision. The contents of this communication and any attachments are for informational purposes only and under no circumstances should they be construed as an offer to buy or
sell, or a solicitation to buy or sell any future, option, swap or other derivative. The sources for the information and any opinions in this communication are believed to be reliable, but Futures International, LLC does not warrant or guarantee the accuracy
of such information or opinions. Futures International, LLC and its principals and employees may take positions different from any positions described in this communication. Past results are not necessarily indicative of future results.