PDF attached


Good
morning.


WASHINGTON,
September 10, 2021—Private exporters reported to the U.S. Department of Agriculture export sales of 132,000 metric tons of soybeans for delivery to China during the 2021/2022 marketing year.


Soybeans,
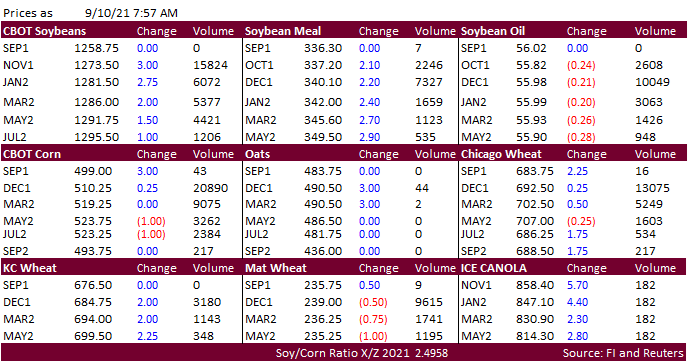
corn, and wheat are catching a bid this morning on light positioning ahead of several reports due out today. USD is 10 points lower.  WTI is rebounding, up $1.33 and equity futures are pointing towards a higher open. 


Weather

Map

Description automatically generated


Map

Description automatically generated


Bloomberg
Ag Calendar

Friday,
Sept. 10:

  • USDA
    weekly crop net-export sales for corn, soybeans, wheat, cotton, pork, beef, 8:30am
  • USDA’s
    monthly World Agricultural Supply and Demand Estimates (WASDE) report, noon
  • China
    farm ministry’s CASDE outlook report
  • ICE
    Futures Europe weekly commitments of traders report (6:30pm London)
  • CFTC
    commitments of traders weekly report on positions for various U.S. futures and options, 3:30pm
  • Malaysian
    Palm Oil Board data on August stockpiles, output, and exports
  • FranceAgriMer
    weekly update on crop conditions
  • Malaysia
    Sept. 1-10 palm oil export data
  • HOLIDAY:
    India

Monday,
Sept. 13:

  • USDA
    export inspections – corn, soybeans, wheat, 11am
  • U.S.
    crop conditions – corn, cotton, soybeans; spring wheat harvest, 4pm
  • AB
    Sugar trading update
  • Ivory
    Coast cocoa arrivals
  • New
    Zealand Food Prices

Tuesday,
Sept. 14:

  • EU
    weekly grain, oilseed import and export data
  • France
    agricultural ministry crop production estimate
  • Ros
    Agro capital markets day
  • Abares’
    agricultural commodities — September quarter 2021

Wednesday,
Sept. 15:

  • EIA
    weekly U.S. ethanol inventories, production
  • FranceAgriMer
    monthly grains report
  • Malaysia
    Sept. 1-15 palm oil exports
  • Brazil’s
    Unica releases cane crush and sugar output data (tentative)

Thursday,
Sept. 16:

  • USDA
    weekly crop net-export sales for corn, soybeans, wheat, cotton, pork, beef, 8:30am
  • Port
    of Rouen data on French grain exports
  • HOLIDAY:
    Malaysia

Friday,
Sept. 17:

  • ICE
    Futures Europe weekly commitments of traders report (6:30pm London)
  • CFTC
    commitments of traders weekly report on positions for various U.S. futures and options, 3:30pm
  • FranceAgriMer
    weekly update on crop conditions

Source:
Bloomberg and FI


US
inventories (Reuters)

Table

Description automatically generated


US
production (Reuters)

Table

Description automatically generated


World
inventories (Reuters)

Table

Description automatically generated


USDA
export sales

were within expectations for soybeans, corn, and wheat.  Meal and soybean oil were near the lower end of expectations.  Soybean meal shipments significantly slow, in part to the closure of Gulf terminals and barge movement, while soybean oil shipments remain
slow. 


Macros


Corn

·        
Corn was higher earlier this morning but most of the contracts broke right before the electronic close. 

·        
We look for a choppy trade headed into the USDA report.   

·        
Ukrainian grain traders union UGA estimated Ukraine’s corn crop could reach a record 38-40 million tons compared with 30 million tons harvested in 2020.

·        
China’s Sinograin  sold 12,972 tons of imported genetically modified corn, or 10% of the total volume offered.  They also sold 3,287 tons of imported non-GMO corn, or 40% of the volume offered.  They plan to sell 99,339 tons of
corn from the United States. 

·        
In its monthly CASDE update, China lowered its 2021-22 corn consumption of corn by 3 million tons to 187 million tons from the previous month.

·        
The Baltic Dry Index posted a 6 percent increase from the previous day to 3,864 points. 

·        
French corn conditions as of September 6 fell 2 points to 89% good or excellent and are well above a year ago of 60%. 

·        
France raised its bird flu alert level after highly contagious H5N8 strain of avian influenza was found this week among ducks, hens, turkeys, and pigeons belonging to a household in the Ardennes region.  Belgium and Luxembourg
recently reported the cases.  (Reuters)

·        
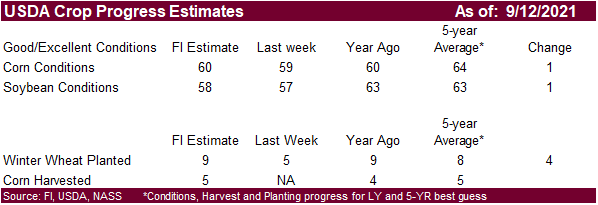
For USDA, we look for about a 1 million acre increase to the US corn area and the US corn yield to increase from 173.6 bu/ac to 174.6, below a trade guess of 175.8 bu/ac.  Note the 2020 US corn yield was 172.0 bu/ac, yet combined
good/excellent corn crop conditions are currently running 2 points below early September 2020. 

·        
The Rosario Grains Exchange estimated Argentina’s corn crop at between 55 and 56 million tons versus previous 55 million.

·        
Weekly US ethanol production was up 18,000 barrels (trade +4,000) from the previous week, snapping an 8-week downtrend, to 923,000 barrels.  Ethanol stocks were down 720,000 barrels to 20,390 million (trade +2,000), lowest level
since June 4. 


Export
developments.

·        
None reported. 


Soybeans

·        
US soybeans and meal are higher while soybean oil is lower on positioning ahead of the USDA report.  The USD is lower and WTI crude oil higher.  Malaysian palm ended 114 points lower. 

·        
We are hearing China bought Brazilian soybeans for October shipment. 

·        
Offshore values are leading SBO 43 points higher and meal $4.10/short ton higher. 

·        
AmSpec reported Malaysian palm oil Sept. 1-10 exports rose 50.47% to 554,875 tons from 368,763 tons shipped during the first 10 days in the previous month.

·        
Malaysia’s August palm oil stocks increased 25.3% from July to 1.87 million tons per MPOB data.  Crude production was up 11.8% to 1.7 million tons, while palm oil exports fell 17.1% to 1.16 million.  Production was up 11.2% to
1.7 million tons and exports fell 12.3% to 1.24 million tons.


·        
Malaysian palm oil

·        
China cash crush margins were last positive 139 cents on our analysis (133 previous) versus 115 cents late last week and 84 cents around a year ago. 

·        
China

·        
The Rosario Grains Exchange estimated Argentina harvested 48.8 million tons of soybeans in 2021-22, down from a previous estimate of 49 million.

·        
Abiove sees the 2021 Brazil soybean export campaign at 86 million tons from 86.7 million previously.  They see imports at 900,000 tons from 400,000 previous. 


Export
Developments

  • Under
    the USDA 24-hour announcement system, private exporters export sales of 132,000 tons of soybeans for delivery to China during the 2021-22 marketing year.


Wheat

·        
Wheat is higher in KC, mostly higher in Chicago, and lower for Minneapolis on positioning ahead of the USDA report. 

·        
December Paris wheat was down 0.50 at 239 euros. 

·        
Russia’s wheat export duty will rise to $52.5 per ton as of September 15 from the current $46.5, which applies until September 14 (AgMin). Barley was set at $33.1 from $26.1, and corn will decrease to $49 per ton from $51.1.


Export
Developments. 

·        
Tunisia bought 75,000 tons of wheat and 100,000 tons of feed barley.  for October through November shipment.  The wheat was bought between $351.97 c&f and $353.68/ton c&f and barley between  $320.23 and $320.10 a ton c&f and $321.23/ton
c&f.

·        
Pakistan bought 405,000 tons of wheat (550k sought) at $369.50 a ton c&f. On Tuesday they were seeing offers at around $369.50/ton and $386.60/ton. 

·        
Results awaited: Saudi Arabia seeks 360,000 tons of wheat for arrival in November. 

·        
Jordan seeks 120,000 tons of wheat on September 15 for last half December through first half February shipment. 

·        
Japan’s Ministry in their regular SBS import tender seeks 80,000 tons of feed wheat and 100,000 tons of feed barley for arrival in Japan by Feb. 24, 2022, set to close on Sept. 15.

·        
Bangladesh’s state grains buyer seeks another 50,000 tons of milling wheat on September 16. 

·        
Mauritius seeks 47,000 tons of wheat flour, optional origin, on Sept. 21 for various 2022 shipment.

·        
Morocco seeks 363,000 tons of US wheat on September 21 for arrival by the end of the year. 


Rice/Other

  • (Bloomberg) — U.S. 2021-22
    cotton production seen at 17.69m bales, 428,000 bales above USDA’s previous est., according to the avg in a Bloomberg survey of nine analysts.

Estimates range from 17m to 18.45m bales

U.S. ending stocks seen increasing by the same amount

Global ending stocks seen 438,000 bales higher at
87.67m bales


U.S. EXPORT SALES FOR WEEK ENDING  09/02/21


CURRENT MARKETING YEAR

NEXT MARKETING YEAR

COMMODITY

NET SALES

OUTSTANDING SALES

WEEKLY EXPORTS

ACCUMULATED EXPORTS

NET SALES

OUTSTANDING SALES

CURRENT YEAR

YEAR
AGO

CURRENT YEAR

YEAR
AGO

WHEAT

THOUSAND METRIC TONS      

   HRW    

227.4

1,507.4

1,856.1

214.0

2,118.3

3,000.5

0.0

0.0

   SRW    

34.1

760.3

517.5

12.0

885.9

568.1

0.0

0.0

   HRS     

77.7

1,049.3

1,831.7

101.1

1,675.8

1,973.7

0.0

0.0

   WHITE   

49.2

668.8

1,226.0

62.9

1,095.2

1,334.9

0.0

0.0

   DURUM  

0.0

7.4

256.8

0.0

43.2

231.6

0.0

0.0

     TOTAL

388.4

3,993.3

5,688.2

390.1

5,818.4

7,108.7

0.0

0.0

BARLEY

-0.1

21.3

30.8

0.0

3.9

8.4

0.0

0.0

CORN

905.8

24,158.2

18,601.2

167.9

167.9

245.7

0.0

331.0

SORGHUM

126.4

1,944.9

2,415.0

0.0

0.0

33.0

0.0

0.0

SOYBEANS

1,471.9

21,011.4

29,359.7

13.8

13.8

468.7

0.0

0.0

SOY MEAL

60.7

1,252.1

1,086.2

44.3

10,888.5

11,099.3

48.3

2,106.4

SOY OIL

-1.6

18.3

121.8

0.4

670.7

1,155.1

0.1

1.5

RICE


   L G RGH

27.5

241.9

186.9

6.9

97.5

50.8

0.0

0.0

   M S RGH

0.0

8.1

27.4

0.5

1.0

1.5

0.0

0.0

   L G BRN

0.2

1.1

8.3

0.5

12.0

2.7

0.0

0.0

   M&S BR

0.0

22.3

19.1

0.0

13.7

13.9

0.0

0.0

   L G MLD

4.0

167.1

68.5

5.5

77.0

20.2

0.0

0.0

   M S MLD

2.2

42.0

42.6

15.5

44.8

52.8

0.0

0.0

     TOTAL

34.0

482.6

352.9

28.9

246.0

141.7

0.0

0.0

COTTON


THOUSAND RUNNING BALES      


   UPLAND

453.0

5,084.8

5,627.9

155.3

937.3

1,482.1

19.5

686.8

   PIMA

12.1

129.1

195.5

12.0

36.0

47.1

0.0

0.0


FINAL 2020/21 MARKETING YEAR

COMMODITY

NET SALES

CARRYOVER

SALES 1/

08/31/2021

EXPORTS

ACCUMULATED

EXPORTS

CORN

-87.4

2,978.1

256.0

66,957.9

SORGHUM

0.0

223.6

2.5

6,913.4

SOYBEANS

148.2

1,805.8

283.1

60,570.5


This summary is based on reports from exporters for the period
August 27-September 2, 2021.

Wheat:  Net sales of 388,400 metric tons (MT) for
2021/2022 were up 32 percent from the previous week and 54 percent from the prior 4-week average.  Increases primarily for Mexico (128,100 MT, including decreases of 12,500 MT), the Philippines (63,000 MT), Japan (54,800 MT), Thailand (50,000 MT), and Venezuela
(30,100 MT, including 29,300 MT switched from unknown destinations), were offset by reductions primarily for unknown destinations (20,800 MT).  Exports of 390,100 MT were down 7 percent from the previous week and 33 percent from the prior 4-week average. 
The destinations were primarily to Mexico (106,600 MT), the Philippines (63,000 MT), Taiwan (57,200 MT), Guatemala (33,500 MT), and South Korea (33,300 MT). 

Corn:  Net sales for the 2021/2022
marketing year, which began September 1, totaled 905,800 MT.  Increases were primarily for Mexico (334,100 MT, including decreases of 1,800 MT), unknown destinations (234,900 MT), Canada (176,200 MT, including decreases of 2,500 MT), Colombia (63,500 MT),
and Japan (60,300 MT, including decreases of 10,200 MT), were offset by reductions for Costa Rica (1,000 MT).  A total of 2,978,100 MT in sales were carried over from the 2020/2021 marketing year, which ended August 31.  Exports for the period ending August
31 of 256,000 MT brought accumulated exports to 66,957,900 MT, up 55 percent from the prior year’s total of 43,273,800 MT.  The primary destinations were to Mexico (117,000 MT), Japan (90,200 MT), Venezuela (19,100 MT), Canada (17,100 MT), and Guyana (8,000
MT).  Exports for September 1-2 totaled 167,900 MT, with Mexico (140,100 MT), Canada (27,500 MT), and Hong Kong (200 MT) being the primary destinations.

Optional Origin
Sales:
  For 2021/2022, options were exercised to export 30,500 MT to unknown destinations from other than the United States.  The current outstanding balance of 110,000 MT is for unknown destinations.

Barley:  Total
net sales reductions for 2021/2022 of 100 MT were for Canada.  No exports were reported for the week.

Sorghum: 
Net sales for the 2021/2022 marketing year, which began September 1, totaled 126,400 MT.  Increases were reported for China (68,600 MT), unknown destinations (55,000 MT), and Mexico (2,800 MT).  A total of 223,600 MT in sales were carried over from the 2020/2021
marketing year, which ended August 31.  Exports for the period ending August 31 of 2,500 MT brought accumulated exports to 6,913,400 MT, up 53 percent from the prior year’s total of 4,529,300 MT.  The destination was Mexico.  There were no exports for September
1-2.

Rice:
 Net sales of 34,000 MT for 2021/2022 were primarily for Costa Rica (22,000 MT), Honduras (5,500 MT), Saudi Arabia (2,800 MT), Canada (2,200 MT), and Hong Kong (900 MT).  Exports of 28,900 MT were primarily to Japan (12,000 MT), Mexico (7,700 MT), Saudi
Arabia (3,900 MT), Canada (2,400 MT), and the Dominican Republic (1,900 MT). 

Soybeans: 
Net sales for the 2021/2022 marketing year, which began September 1, totaled 1,471,900 MT.  Increases were primarily for China (764,000 MT), unknown destinations (453,600 MT), Mexico (79,100 MT, including decreases of 400 MT), Turkey (55,000 MT), and Egypt
(55,000 MT).  A total of 1,805,800 MT in sales were carried over from the 2020/2021 marketing year, which ended August 31.  Exports for the period ending August 31 of 283,100 MT brought accumulated exports to 60,570,500 MT, up 35 percent from the prior year’s
total of 44,934,500 MT.  The primary destinations were Germany (152,200 MT), Japan (58,100 MT), Mexico (42,700 MT), Indonesia (9,200 MT), and Taiwan (8,100 MT).  Exports for September 1-2 totaled 13,800 MT, with Mexico (10,500 MT), Malaysia (2,200 MT), the
Philippines (600 MT), Japan (300 MT), and Indonesia (200 MT) being the destinations.

Export for Own
Account:
For 2021/2022, new exports for own account totaling 5,800 MT were carried over from the 2020/2021 marketing year, which ended August 31.  The current exports for own account outstanding balance is 5,800 MT, all Canada.

Export
Adjustments:
  Accumulated export of soybeans to the Netherlands were adjusted down 65,966 MT for week ending August 19th, and 86,200 MT for week ending August 26th.  The correct destination
for these shipments is Germany.  

Soybean Cake and
Meal:
  Net sales of 60,700 MT for 2020/2021 were up noticeably from the previous week, but down 9 percent from the prior 4-week average.  Increases primarily for Mexico (24,100 MT, including decreases of 200 MT), Malaysia (8,500 MT), Canada (6,100 MT,
including decreases of 200 MT), Taiwan (5,800 MT), and the Philippines (5,200 MT), were offset by reductions primarily for unknown destinations (8,300 MT). 
For 2021/2022, net sales of 48,300 MT primarily for Japan (20,500 MT), the Dominican Republic (15,000 MT), Canada (9,100 MT), Colombia (8,600 MT), and Jamaica (8,000 MT), were offset by reductions primarily for unknown destinations (19,000
MT).
  Exports of 44,300 MT were down 77 percent from the previous week and 80 percent from the prior 4-week average.  The destinations were primarily to Canada (16,700 MT), Mexico (13,100 MT), Guyana (4,200 MT), Venezuela (3,100 MT), and Burma (2,400 MT). 

Soybean Oil: 
Total net sales reductions for 2020/2021 of 1,600 MT, down noticeably from the previous week and from the prior 4-week average, were for Canada (including decreases of 1,800 MT).  Total net sales for 2021/2022 of 100 MT were for Canada.  Exports of 400 MT
were down 91 percent from the previous week and 73 percent from the prior 4-week average.  The destination was primarily to Canada (300 MT).

Cotton: 
Net sales of 453,000 RB for 2021/2022 primarily for China (261,500 RB, including decreases of 100 RB), Pakistan (36,500 RB), Indonesia (30,500 RB, including decreases of 100 RB), Guatemala (28,400 RB), and Turkey (25,400 RB, including decreases of 300 RB),
were offset by reductions for Japan (1,100 RB) and Bangladesh (200 RB).  Total net sales for 2022/2023 of 19,500 RB were for Guatemala.  Exports of 155,300 RB were primarily to Vietnam (48,600 RB), China (29,100 RB), Pakistan (16,600 RB), Mexico (16,000 RB),
and Turkey (14,300 RB).  Net sales of Pima totaling 12,100 RB were primarily for India (5,500 RB, including decreases of 100 RB), Austria (2,600 RB), Honduras (2,200 RB), Pakistan (900 RB) and South Korea (700 RB).  Exports of 12,000 RB were primarily to India
(7,700 RB), Pakistan (2,200 RB), China (1,000 RB), Peru (400 RB), and Thailand (400 RB). 

Optional
Origin Sales:
  For 2021/2022, the current outstanding balance of 8,800 RB is for Pakistan. 

Exports for Own Account:  For 2021/2022, the current
exports for own account outstanding balance of 4,800 RB is for China (4,700 RB) and Vietnam (100 RB).

Hides
and Skins:
  Net sales of 398,900 pieces for 2021 were up 23 percent from the previous week and 49 percent from the prior 4-week average.  Increases primarily for China (285,600 whole cattle hides, including decreases
of 28,400 pieces), South Korea (38,400 whole cattle hides, including decreases of 1,200 pieces), Thailand (24,000 whole cattle hides, including decreases of 1,100 pieces), Mexico (19,300 whole cattle hides, including decreases of 600 pieces), and Italy (16,200
whole cattle hides), were offset by reductions for Ethiopia (100 pieces).  Exports of 350,000 pieces were down 18 percent from the previous week and 20 percent from the prior 4-week average.  Whole cattle hides exports were primarily to China (226,400 pieces),
South Korea (43,100 pieces), Mexico (30,600 pieces), Thailand (15,800 pieces), and Taiwan (14,500 pieces).

Net
sales of 2,100 wet blues for 2021 were down 99 percent from the previous week and from the prior 4-week average.  Increases primarily for Brazil (6,000 unsplit), India (2,000 unsplit), Thailand (1,400 unsplit, including decreases of 400 unsplit), and Mexico
(900 unsplit), were offset by reductions primarily for Italy (8,200 pieces). 

Total net sales for 2022 of 8,000 wet blues were for Italy. 
Exports of 64,500 wet blues were down 49
percent from the previous week and 60 percent from the prior 4-week average.  The destinations were to Italy (23,300 unsplit), Vietnam (16,200 unsplit), Thailand (9,100
unsplit), China (6,600 unsplit), and Mexico (1,900 unsplit and 2,100 grain splits).  Total net sales reductions of 2,100 splits were for China.  Exports of 160,000 pounds were to Vietnam. 

Beef: 
Net sales of 12,400 MT reported for 2021 were down 20 percent from the previous week and 2 percent from the prior 4-week average.  Increases were primarily for Japan (4,600 MT, including decreases of 500 MT), China
(2,700 MT, including decreases of 100 MT), South Korea (900 MT, including decreases 500 MT), Canada (800 MT), and Taiwan (700 MT, including 100 MT switched from the Philippines and decreases of 100 MT).  Total net sales for 2022 of 400 MT were for South Korea. 
Exports of 18,800 MT were up 4 percent from the previous week, but unchanged from the prior 4-week average.  The destinations were primarily to Japan (4,900 MT), South Korea (4,700 MT), China (4,000 MT), Taiwan (1,100 MT), and Mexico (1,000 MT). 

Pork: 
Net sales of 33,800 MT reported for 2021 were up 1 percent from the previous week and 47 percent from the prior 4-week average.  Increases were primarily for China (15,000 MT, including decreases of 200 MT), Mexico (8,200
MT, including decreases of 700 MT), South Korea (3,600 MT, including decreases of 200 MT), Colombia (3,100 MT, including decreases of 100 MT), and Japan (1,600 MT, including decreases of 300 MT).  Exports of 29,100 MT were up 3 percent from the previous week
and 2 percent from the prior 4-week average.  The destinations were primarily to Mexico (13,800 MT), China (5,000 MT), Japan (3,700 MT), South Korea (1,400 MT), and Canada (1,400 MT). 


Terry Reilly

Senior Commodity Analyst – Grain and Oilseeds

Futures International
One Lincoln Center
18 W 140 Butterfield Rd.

Oakbrook Terrace, Il. 60181

W: 312.604.1366

treilly@futures-int.com

ICE IM: 
treilly1

Skype: fi.treilly


Description: Description: Description: Description: FImail


Trading of futures, options, swaps and other derivatives is risky and is not suitable for all persons.  All of these investment products are leveraged, and you can lose more than your initial deposit.  Each investment product is offered
only to and from jurisdictions where solicitation and sale are lawful, and in accordance with applicable laws and regulations in such jurisdiction.  The information provided here should not be relied upon as a substitute for independent research before making
your investment decisions.  Futures International, LLC is merely providing this information for your general information and the information does not take into account any particular individual’s investment objectives, financial situation, or needs.  All investors
should obtain advice based on their unique situation before making any investment decision.  The contents of this communication and any attachments are for informational purposes only and under no circumstances should they be construed as an offer to buy or
sell, or a solicitation to buy or sell any future, option, swap or other derivative.  The sources for the information and any opinions in this communication are believed to be reliable, but Futures International, LLC does not warrant or guarantee the accuracy
of such information or opinions.  Futures International, LLC and its principals and employees may take positions different from any positions described in this communication.  Past results are not necessarily indicative of future results.