PDF attached
US CPI (M/M) Dec: -0.1% (exp -0.1%; prev 0.1%)
– CPI Core (M/M) Dec: 0.3% (exp 0.3%; prev 0.2%)
– CPI (Y/Y) Dec: 6.5% (exp 6.5%; prev 7.1%)
– CPI Core (Y/Y) Dec: 5.7% (exp 5.7%; prev 6.0%)
US Initial Jobless Claims Jan-7: 205K (exp 215K; R prev 206K)
– Continuing Claims Dec-31: 1643M (exp 1710K; R prev 1697K)
US Real Average Hourly Earnings (Y/Y) Dec: -1.7% (R prev -2.1%)
– Real Average Weekly Earnings (Y/Y) Dec: -3.1% (R prev -3.3%)
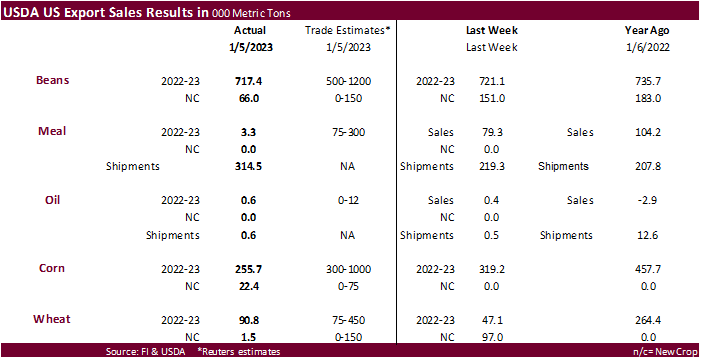
Soybean sales of 717,400 tons were within expectations. More than half of the 676,600 tons of soybean booked by China were switched from unknown. Soybean meal sales were poor at only 3,300 tons but shipments were good at 314,500 tons. Soybean oil sales were only 600,000 tons and shipments the same amount. Corn export sales were well below expectation at 255,700 tons and all-wheat were a low 90,800 tons. Mexico was active for corn. China switched a cargo of wheat and couple cargoes of corn from unknown destinations.
U.S. EXPORT SALES FOR WEEK ENDING 1/5/2023
|
|
CURRENT MARKETING YEAR |
NEXT MARKETING YEAR |
||||||
|
COMMODITY |
NET SALES |
OUTSTANDING SALES |
WEEKLY EXPORTS |
ACCUMULATED EXPORTS |
NET SALES |
OUTSTANDING SALES |
||
|
CURRENT YEAR |
YEAR AGO |
CURRENT YEAR |
YEAR AGO |
|||||
|
|
THOUSAND METRIC TONS |
|||||||
|
WHEAT |
|
|
|
|
|
|
|
|
|
HRW |
32.2 |
953.7 |
2,041.2 |
20.2 |
3,194.5 |
4,318.3 |
0.0 |
69.3 |
|
SRW |
10.1 |
626.8 |
679.9 |
15.5 |
1,763.7 |
1,698.0 |
0.0 |
41.6 |
|
HRS |
-0.1 |
1,295.6 |
1,259.6 |
54.2 |
3,227.4 |
3,076.6 |
0.0 |
49.8 |
|
WHITE |
25.2 |
1,207.7 |
805.6 |
84.9 |
2,501.7 |
2,101.3 |
0.0 |
0.3 |
|
DURUM |
23.4 |
121.2 |
54.2 |
18.9 |
168.4 |
112.7 |
1.5 |
1.5 |
|
TOTAL |
90.8 |
4,205.0 |
4,840.5 |
193.6 |
10,855.7 |
11,307.0 |
1.5 |
162.5 |
|
BARLEY |
0.0 |
4.9 |
19.0 |
0.3 |
6.7 |
11.5 |
0.0 |
0.0 |
|
CORN |
255.7 |
11,612.2 |
25,790.0 |
387.1 |
10,384.0 |
15,664.6 |
22.4 |
1,161.4 |
|
SORGHUM |
0.0 |
140.9 |
3,576.3 |
0.2 |
220.0 |
1,752.6 |
0.0 |
0.0 |
|
SOYBEANS |
717.4 |
14,741.4 |
10,803.7 |
1,620.7 |
29,662.1 |
31,633.7 |
66.0 |
397.0 |
|
SOY MEAL |
3.3 |
3,191.1 |
2,880.4 |
314.5 |
3,012.1 |
3,350.0 |
0.0 |
18.3 |
|
SOY OIL |
0.6 |
18.2 |
232.6 |
0.6 |
19.5 |
205.1 |
0.0 |
0.6 |
|
RICE |
|
|
|
|
|
|
|
|
|
L G RGH |
5.1 |
127.1 |
175.4 |
0.5 |
192.0 |
584.0 |
0.0 |
0.0 |
|
M S RGH |
0.0 |
13.4 |
10.5 |
0.3 |
13.5 |
3.2 |
0.0 |
0.0 |
|
L G BRN |
0.0 |
8.1 |
3.7 |
0.3 |
7.8 |
27.3 |
0.0 |
0.0 |
|
M&S BR |
29.2 |
36.8 |
67.7 |
0.1 |
7.1 |
16.5 |
0.0 |
0.0 |
|
L G MLD |
14.0 |
148.8 |
64.7 |
17.2 |
297.9 |
404.6 |
0.0 |
0.0 |
|
M S MLD |
14.5 |
148.3 |
100.7 |
2.1 |
101.6 |
181.6 |
0.0 |
0.0 |
|
TOTAL |
62.7 |
482.4 |
422.7 |
20.5 |
619.9 |
1,217.1 |
0.0 |
0.0 |
|
COTTON |
|
THOUSAND RUNNING BALES |
||||||
|
UPLAND |
72.6 |
4,841.0 |
7,789.8 |
150.5 |
4,018.0 |
3,204.4 |
0.0 |
1,203.1 |
|
PIMA |
3.3 |
62.1 |
225.2 |
6.3 |
61.1 |
154.0 |
0.0 |
1.1 |
This summary is based on reports from exporters for the period December 30, 2022 – January 5, 2023.
Wheat: Net sales of 90,800 metric tons (MT) for 2022/2023 were up 93 percent from the previous week, but down 73 percent from the prior 4-week average. Increases primarily for China (66,000 MT, including 65,000 MT switched from unknown destinations), the Philippines (23,200 MT, including decreases of 22,000 MT), Italy (18,900 MT), South Africa (7,700 MT, including 8,000 MT switched from unknown destinations and decreases of 300 MT), and Panama (6,000 MT), were offset by reductions for unknown destinations (43,000 MT) and Thailand (3,600 MT). Total net sales of 1,500 MT for 2023/2024 were for Panama. Exports of 193,600 MT were up noticeably from the previous week, but down 15 percent from the prior 4-week average. The destinations were primarily to China (66,000 MT), the Philippines (35,200 MT), Japan (26,200 MT), Mexico (24,500 MT), and Italy (18,900 MT).
Corn: Net sales of 255,700 MT for 2022/2023 were down 20 percent from the previous week and 62 percent from the prior 4-week average. Increases primarily for Mexico (223,500 MT, including decreases of 4,800 MT), China (138,600 MT, including 136,000 MT switched from unknown destinations and decreases of 800 MT), Canada (33,400 MT), Nicaragua (6,100 MT), and Taiwan (5,200 MT, including 1,000 MT switched from Hong Kong and decreases of 300 MT), were offset by reductions for unknown destinations (110,600 MT), Honduras (42,500 MT), and Hong Kong (1,000 MT). Total net sales of 22,400 MT for 2023/2024 were for Mexico. Exports of 387,100 MT were down 49 percent from the previous week and 53 percent from the prior 4-week average. The destinations were primarily to Mexico (213,700 MT), China (138,600 MT), Canada (23,100 MT), Jamaica (4,700 MT), and Taiwan (4,200 MT).
Barley: No net sales were reported for the week. Exports of 300 MT were unchanged from the previous week and up 25 percent from the prior 4-week average. The destination was Japan.
Sorghum: No net sales were reported for the week. Exports of 200 MT–a marketing-year low– were down 82 percent from the previous week and 98 percent from the prior 4-week average. The destination was to Mexico.
Rice: Net sales of 62,700 MT for 2022/2023 were up noticeably from the previous week and 29 percent from the prior 4-week average. Increases were primarily for South Korea (34,100 MT), Haiti (13,400 MT, including deceases of 3,600 MT), Jordan (8,000 MT), Honduras (5,100 MT), and Mexico (900 MT). Exports of 20,500 MT were down 59 percent from the previous week and 44 percent from the prior 4-week average. The destinations were primarily to Haiti (15,100 MT), Mexico (2,200 MT), Canada (1,500 MT), Saudi Arabia (500 MT), and South Korea (400 MT).
Soybeans: Net sales of 717,400 MT for 2022/2023 were down 1 percent from the previous week and 41 percent from the prior 4-week average. Increases primarily for China (676,600 MT, including 372,000 MT switched from unknown destinations, 52,000 MT switched from Pakistan, and decreases of 10,800 MT), Germany (142,600 MT), Mexico (100,400 MT, including decreases of 1,800 MT), Bangladesh (57,200 MT, including 55,000 MT switched from unknown destinations), and Spain (46,900 MT, including 41,000 MT switched from unknown destinations), were offset by reductions primarily for unknown destinations (348,800 MT). Total net sales of 66,000 MT for 2023/2024 were for Pakistan. Exports of 1,620,700 MT were up 10 percent from the previous week, but down 7 percent from the prior 4-week average. The destinations were primarily to China (1,134,800 MT), Germany (142,600 MT), Mexico (66,700 MT), Bangladesh (57,200 MT), and Spain (46,900 MT).
Optional Origin Sales: For 2022/2023, the current outstanding balance of 300 MT, all South Korea.
Export for Own Account: For 2022/2023, the current exports for own account outstanding balance is 1,500 MT, all Canada.
Export Adjustments: Accumulated exports of soybeans to the Netherlands were adjusted down 142,556 MT for week ending December 22nd. The correct destination for this shipment is Germany.
Soybean Cake and Meal: Net sales of 3,300 MT for 2022/2023–a marketing-year low–were down 96 percent from the previous week and 99 percent from the prior 4-week average. Increases primarily for France (64,700 MT, including 60,000 MT switched from unknown destinations), Venezuela (11,000 MT switched from unknown destinations), Honduras (7,100 MT), Vietnam (5,000 MT), and the Philippines (4,000 MT, including decreases of 500 MT), were offset by reductions primarily for unknown destinations (80,000 MT), Ecuador (6,800 MT), Costa Rica (6,500 MT), and Morocco (6,000 MT). Exports of 314,500 MT were up 43 percent from the previous week and 34 percent from the prior 4-week average. The destinations were primarily to France (64,700 MT), the Philippines (50,000 MT), Mexico (32,400 MT), Japan (27,700 MT), and Burma (27,500 MT).
Soybean Oil: Net sales of 600 MT for 2022/2023 were up 74 percent from the previous week, but down 61 percent from the prior 4-week average. Increases were reported for Canada (400 MT) and Mexico (200 MT). Exports of 600 MT were up 14 percent from the previous week, but down 66 percent from the prior 4-week average. The destinations were to Canada (400 MT) and Mexico (200 MT).
Cotton: Net sales of 72,600 RB for 2022/2023 were up 83 percent from the previous week and up noticeably from the prior 4-week average. Increases primarily for Turkey (19,600 RB), China (16,400 RB), Vietnam (11,800 RB, including 200 RB switched from Japan and decreases of 400 RB), Pakistan (9,200 RB), Indonesia (6,900 RB, including 100 RB switched from Japan), were offset by reductions for Peru (1,400 RB). Exports of 150,500 RB were up 61 percent from the previous week and 24 percent from the prior 4-week average. The destinations were primarily to Pakistan (45,100 RB), China (44,200 RB), Vietnam (11,400 RB), Mexico (10,900 RB), and Bangladesh (8,600 RB). Net sales of Pima totaling 3,300 RB for 2022/2023 were down noticeably from the previous week, but up 78 percent from the prior 4-week average. Increases were reported for Vietnam (1,800 RB), China (1,100 RB), and India (400 RB). Exports of 6,300 RB were up 85 percent from the previous week and 28 percent from the prior 4-week average. The destinations were primarily to Turkey (2,900 RB), Vietnam (1,300 RB), Egypt (700 RB), India (400 RB), and China (400 RB).
Optional Origin Sales: For 2022/2023, the current outstanding balance of 9,300 RB, all Malaysia.
Export for Own Account: For 2022/2023, new exports for own account totaling 1,800 RB were to China. Exports for own account totaling 700 RB to Vietnam were applied to new or outstanding sales. The current exports for own account outstanding balance of 120,400 RB are for China (90,100 RB), Vietnam (21,900 RB), Pakistan (6,500 RB), India (1,500 RB), and Indonesia (400 RB).
Hides and Skins: Net sales for the 2023 marketing year, which began January 1st, totaled 329,000 pieces, primarily for China (209,300 whole cattle hides, including decreases of 30,600 pieces), South Korea (79,200 whole cattle hides, including decreases of 300 pieces), Mexico (18,900 whole cattle hides, including decreases of 7,500 pieces), and Turkey (18,900 whole cattle hides), were offset by reductions for Italy (1,900 pieces) and Indonesia (100 pieces). Net sales of 400 calf skins resulted in increases for China (1,800 calf skins, including decreases of 2,500 calf skins), were offset by reductions for Italy (1,400 calf skins). In addition, total net sales reductions of 200 kips skins were for China. Net sales reductions of 1,500 pieces, net sales of 5,600 calf skins, and total net sales of 2,300 kip skins were carried over from the 2022 marketing year, which ended December 31st. Exports for the period ending December 31st of 179,500 pieces brought accumulated exports to 22,214,900 pieces, up 11 percent from the prior year’s total of 20,003,400 pieces. The destinations were primarily to China (120,200 pieces), South Korea (25,800 pieces), and Thailand (8,800 pieces). Exports of 7,500 calf skins were to Italy (5,700 calf skins) and China (1,800 calf skins). In addition, total exports of 1,000 kip skins were to China.
Net sales for 2023 marketing year, which began January 1st, totaled 94,900 wet blues primarily for Hong Kong (35,000 unsplit), China (20,800 unsplit), Vietnam (9,600 unsplit), Thailand (9,000 unsplit), and Italy (7,800 unsplit, including decreases of 200 unsplit). Net sales reductions of 100 unsplit were carried over from the 2022 marketing year which ended on December 31st. Exports for the period ending December 31st of 20,200 wet blues brought accumulated exports to 7,125,200 wet blues, up 3 percent prior year total of 6,929,900 wet blues. The primary destinations were primarily to Italy (4,500 unsplit), Hong Kong (4,000 unsplit), India (2,900 unsplit), Vietnam (2,300 unsplit), and Thailand (2,000 unsplit). Net sales of splits totaling 180,500 pounds for 2023 marketing year for Vietnam (187,400 pounds, including decreases of 5,900 pounds), were offset by reductions for Hong Kong (6,900 pounds). Accumulated exports of splits in 2022 totaled 18,600,500 pounds, down 5 percent from the prior year’s total of 19,559,400 pounds. Exports of 36,500 pounds were to Vietnam.
Beef: Net sales for 2023 marketing year, which began January 1st, totaled 13,300 MT primarily for Japan (4,800 MT, including decreases of 600 MT), China (3,400 MT, including decreases of 100 MT), South Korea (1,700 MT, including decreases of 700 MT), Mexico (900 MT, including decreases of 100 MT), and Taiwan (700 MT, including decreases of 100 MT), were offset by reductions for Chile (100 MT). Net sales of 600 MT were carried over from the 2022 marketing year, which ended December 31st. Exports for the period ending December 31st of 4,300 MT brought accumulated exports to 942,000 MT, up 2 percent from the prior year total of 925,100 MT. The primary destinations were to South Korea (1,300 MT), Japan (1,200 MT), China (500 MT), Mexico (400 MT), and Taiwan (200 MT).
Pork: Net sales for 2023 marketing year, which began January 1st, totaled 13,100 MT were primarily for Mexico (4,700 MT, including decreases of 300 MT), Japan (3,500 MT, including decreases of 400 MT), South Korea (1,400 MT, including decreases of 700 MT), Canada (800 MT, including decreases of 400 MT), and the Dominican Republic (600 MT, including decreases of 100 MT). Net sales of 4,000 MT were carried over from the 2022 marketing year, which ended December 31st. Exports of the period ending December 31st of 9,700 MT brought accumulated exports to 1,502,900 MT, down 16 percent from the prior year total of 1,791,700 MT. The primarily destinations were to Mexico (6,000 MT), Japan (1,300 MT), South Korea (600 MT), China (500 MT), and Canada (400 MT).
Terry Reilly
Senior Commodity Analyst – Grain and Oilseeds
Futures International
One Lincoln Center
18 W 140 Butterfield Rd.
Oakbrook Terrace, Il. 60181
W: 312.604.1366
ICE IM: treilly1
Skype: fi.treilly

Trading of futures, options, swaps and other derivatives is risky and is not suitable for all persons. All of these investment products are leveraged, and you can lose more than your initial deposit. Each investment product is offered only to and from jurisdictions where solicitation and sale are lawful, and in accordance with applicable laws and regulations in such jurisdiction. The information provided here should not be relied upon as a substitute for independent research before making your investment decisions. Futures International, LLC is merely providing this information for your general information and the information does not take into account any particular individual’s investment objectives, financial situation, or needs. All investors should obtain advice based on their unique situation before making any investment decision. The contents of this communication and any attachments are for informational purposes only and under no circumstances should they be construed as an offer to buy or sell, or a solicitation to buy or sell any future, option, swap or other derivative. The sources for the information and any opinions in this communication are believed to be reliable, but Futures International, LLC does not warrant or guarantee the accuracy of such information or opinions. Futures International, LLC and its principals and employees may take positions different from any positions described in this communication. Past results are not necessarily indicative of future results.