PDF attached
USDA Export Sales
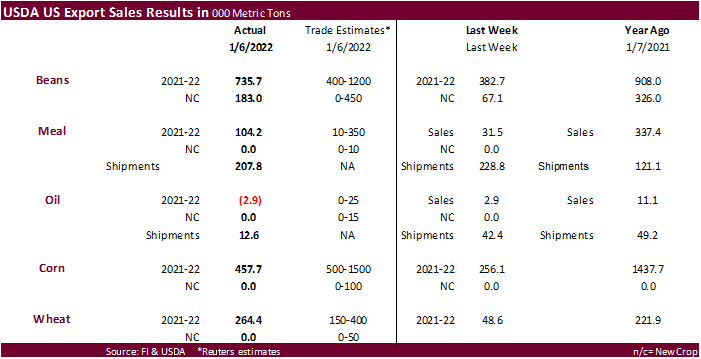
China showed up for soybeans, sorghum and cotton. USDA soybean export sales were ok for soybeans at 735,700 tons, but below average for this time of year. New crop sales of 183,000 tons were as expected. Meal and soybean oil sales were poor. Corn export sales fell short of a range of expectations, below 500,000 tons, and wheat was only 264,400 tons with nothing posted for new-crop. Overall bearish, IMO.
U.S. EXPORT SALES FOR WEEK ENDING 1/6/2022
|
|
CURRENT MARKETING YEAR |
NEXT MARKETING YEAR |
||||||
|
COMMODITY |
NET SALES |
OUTSTANDING SALES |
WEEKLY EXPORTS |
ACCUMULATED EXPORTS |
NET SALES |
OUTSTANDING SALES |
||
|
CURRENT YEAR |
YEAR |
CURRENT YEAR |
YEAR |
|||||
|
|
THOUSAND METRIC TONS |
|||||||
|
WHEAT |
|
|
|
|
|
|
|
|
|
HRW |
38.4 |
2,041.2 |
1,446.4 |
92.5 |
4,318.3 |
5,770.9 |
0.0 |
14.0 |
|
SRW |
65.9 |
679.9 |
499.2 |
75.8 |
1,698.0 |
1,087.8 |
0.0 |
37.0 |
|
HRS |
96.2 |
1,259.6 |
1,816.4 |
57.6 |
3,076.6 |
4,294.9 |
0.0 |
0.0 |
|
WHITE |
30.9 |
805.6 |
2,456.5 |
32.5 |
2,101.3 |
3,098.5 |
0.0 |
0.0 |
|
DURUM |
33.0 |
54.2 |
100.8 |
0.0 |
112.7 |
488.9 |
0.0 |
33.0 |
|
TOTAL |
264.4 |
4,840.5 |
6,319.3 |
258.4 |
11,307.0 |
14,741.0 |
0.0 |
84.0 |
|
BARLEY |
0.0 |
19.0 |
13.7 |
0.0 |
11.5 |
16.9 |
0.0 |
0.0 |
|
CORN |
457.7 |
25,790.0 |
28,661.5 |
1,011.8 |
15,664.6 |
16,720.6 |
0.0 |
1,512.0 |
|
SORGHUM |
20.9 |
3,576.3 |
3,219.2 |
139.6 |
1,752.6 |
2,059.5 |
0.0 |
0.0 |
|
SOYBEANS |
735.6 |
10,803.7 |
14,561.1 |
1,020.1 |
31,633.7 |
40,911.7 |
183.0 |
466.1 |
|
SOY MEAL |
104.2 |
2,880.4 |
2,822.8 |
207.8 |
3,350.2 |
3,464.7 |
-0.7 |
35.5 |
|
SOY OIL |
-2.9 |
232.6 |
247.9 |
12.6 |
205.1 |
254.3 |
-0.1 |
0.3 |
|
RICE |
|
|
|
|
|
|
|
|
|
L G RGH |
0.0 |
175.4 |
202.9 |
1.7 |
584.0 |
787.0 |
0.0 |
0.0 |
|
M S RGH |
0.0 |
10.5 |
15.6 |
0.3 |
3.2 |
13.3 |
0.0 |
0.0 |
|
L G BRN |
0.1 |
3.7 |
10.5 |
0.2 |
27.3 |
22.7 |
0.0 |
0.0 |
|
M&S BR |
0.5 |
67.7 |
45.3 |
1.1 |
16.5 |
50.7 |
0.0 |
0.0 |
|
L G MLD |
18.4 |
64.7 |
72.2 |
11.7 |
404.6 |
298.0 |
0.0 |
0.0 |
|
M S MLD |
2.4 |
100.7 |
171.5 |
2.4 |
181.6 |
211.0 |
0.0 |
0.0 |
|
TOTAL |
21.3 |
422.7 |
518.1 |
17.3 |
1,217.1 |
1,382.7 |
0.0 |
0.0 |
|
COTTON |
|
THOUSAND RUNNING BALES |
||||||
|
UPLAND |
401.0 |
7,789.8 |
6,066.2 |
167.6 |
3,204.4 |
5,798.0 |
38.3 |
1,152.5 |
|
PIMA |
2.4 |
225.2 |
243.1 |
9.3 |
154.0 |
352.7 |
0.0 |
5.3 |
This summary is based on reports from exporters for the period December 31, 2021 – January 6, 2022.
Wheat: Net sales of 264,400 metric tons (MT) for 2021/2022 were up noticeably from the previous week, but down 20 percent from the prior 4-week average. Increases primarily for the Philippines (50,000 MT), Mexico (42,300 MT, including decreases of 18,500 MT), Algeria (33,000 MT), Japan (26,800 MT), and Jamaica (22,000 MT), were offset by reductions primarily for the French West Indies (11,500 MT). Exports of 258,400 MT were up 23 percent from the previous week and 2 percent from the prior 4-week average. The destinations were primarily to Japan (60,300 MT), Indonesia (60,300 MT), Mexico (56,100 MT), Nicaragua (33,000 MT), and Taiwan (28,500 MT).
Corn: Net sales of 457,700 MT for 2021/2022 were up 79 percent from the previous week, but down 59 percent from the prior 4-week average. Increases primarily for Mexico (278,800 MT, including decreases of 20,600 MT), Japan (233,000 MT, including 101,500 MT switched from unknown destinations), China (70,200 MT, including 68,000 MT switched from unknown destinations), Canada (27,000 MT, including decreases of 1,100 MT), and Nicaragua (16,900 MT), were offset by reductions primarily for unknown destinations (216,300 MT). Exports of 1,011,800 MT were up 3 percent from the previous week, but down 1 percent from the prior 4-week average. The destinations were primarily to Mexico (347,800 MT), China (274,700 MT), Japan (131,700 MT), Saudi Arabia (73,300 MT), and Costa Rica (49,300 MT).
Optional Origin Sales: For 2021/2022, the current outstanding balance of 381,000 MT is for unknown destinations (309,000 MT), Italy (63,000 MT), and Saudi Arabia (9,000 MT).
Barley: No net sales or exports were reported for the week.
Sorghum: Net sales of 20,900 MT for 2021/2022 resulting in increases for China (143,900 MT, including 68,000 MT switched from unknown destinations and decreases of 500 MT), were offset by reductions for unknown destinations (123,000 MT). Exports of 139,600 MT were up 88 percent from the previous week, but down 18 percent from the prior 4-week average. The destinations were to China (139,300 MT) and Mexico (300 MT).
Rice: Net sales of 21,300 MT for 2021/2022 were down 23 percent from the previous week and 63 percent from the prior 4-week average. Increases were primarily for Haiti (16,200 MT), Canada (2,300 MT), Mexico (1,100 MT, including decreases of 200 MT), Belgium (500 MT), and New Zealand (300 MT). Exports of 17,300 MT were down 68 percent from the previous week and 63 percent from the prior 4-week average. The destinations were primarily to Haiti (7,200 MT), Mexico (5,500 MT), Canada (2,500 MT), Taiwan (1,100 MT), and Belgium (500 MT).
Exports for Own Account: For 2021/2022, the current exports for own account outstanding balance is 100 MT, all Canada.
Soybeans: Net sales of 735,600 MT for 2021/2022 were up 92 percent from the previous week, but down 1 percent from the prior 4-week average. Increases primarily for China (301,800 MT, including 264,000 MT switched from unknown destinations and decreases of 1,200 MT), Mexico (187,900 MT, including decreases of 1,400 MT), Egypt (175,800 MT, including 57,500 MT switched from China and decreases of 3,700 MT), Bangladesh (57,500 MT, including 55,000 MT switched from unknown destinations), and Indonesia (33,900 MT, including decreases of 200 MT), were offset by reductions primarily for unknown destinations (109,000 MT). Net sales of 183,000 MT for 2022/2023 were for unknown destinations (120,000 MT) and China (63,000 MT). Exports of 1,020,100 MT were down 42 percent from the previous week and 43 percent from the prior 4-week average. The destinations were primarily to China (489,000 MT, including 69,500 MT – late), Mexico (107,700 MT), Egypt (106,800 MT), Pakistan (68,800 MT), and Spain (59,900 MT).
Export for Own Account: For 2021/2022, exports for own account totaling 59,900 MT to Canada were applied to new or outstanding sales. Decreases of 100 MT were reported for Canada. The current exports for own account outstanding balance is 3,000 MT, all Canada.
Late Reporting: For 2021/2022, exports totaling 69,500 MT of soybeans were reported late to China.
Soybean Cake and Meal: Net sales of 104,200 MT for 2021/2022 were up noticeably from the previous week, but down 16 percent from the prior 4-week average. Increases primarily for Mexico (26,200 MT, including decreases 1,000 MT), Morocco (24,000 MT), Colombia (22,300 MT, including 15,000 MT switched from unknown destinations and decreases of 23,000 MT), Canada (18,200 MT, including decreases of 1,400 MT), and the Dominican Republic (11,500 MT), were offset by reductions primarily for unknown destinations (13,000 MT). Net sales reductions of 700 MT for 2022/2023 resulting in increases for Canada (1,900 MT), were more than offset by reductions for the Netherlands (2,000 MT) and Japan (700 MT). Exports of 207,800 MT were down 9 percent from the previous week and 16 percent from the prior 4-week average. The destinations were primarily to Colombia (77,900 MT), the Philippines (48,300 MT), Mexico (32,600 MT), Canada (29,200 MT), and Guatemala (9,500 MT).
Optional Origin Sales: For 2021/2022, the current outstanding balance of 50,000 MT is for Venezuela.
Soybean Oil: Net sales reductions of 2,900 MT for 2021/2022–a marketing-year low–were down noticeably from the previous week and from the prior 4-week average. Increases reported for South Korea (300 MT) and the Dominican Republic (200 MT), were more than offset by reductions for Canada (3,000 MT) and India (400 MT). Total net sales reductions of 100 MT for 2022/2023 were for Canada. Exports of 12,600 MT were down 70 percent from the previous week and 28 percent from the prior 4-week average. The destinations were to the Dominican Republic (9,200 MT), Mexico (1,600 MT), Colombia (1,500 MT), and Canada (300 MT).
Cotton: Net sales of 401,000 RB for 2021/2022 were up noticeably from the previous week and up 85 percent from the prior 4-week average. Increases were primarily for China (139,500 RB), India (74,700 RB), Turkey (53,200 RB), Pakistan (38,400 RB), and Vietnam (36,600 RB, including 300 RB switched from China). Net sales of 38,300 RB for 2022/2023 were primarily for Pakistan (36,500 RB). Exports of 167,600 RB were up 60 percent from the previous week and 27 percent from the prior 4-week average. The destinations were primarily to China (59,000 RB), Vietnam (26,900 RB), Turkey (19,400 RB), Mexico (18,000 RB), and Pakistan (13,700 RB). Net sales of Pima totaling 2,400 RB were down 46 percent from the previous week and 49 percent from the prior 4-week average. Increases were primarily for China (1,700 RB), Pakistan (300 RB), and Brazil (300 RB). Exports of 9,300 RB were up 29 percent from the previous week and 37 percent from the prior 4-week average. The destinations were primarily to Peru (4,800 RB), Indonesia (1,700 RB), India (1,600 RB), China (500 RB), and Vietnam (400 RB).
Optional Origin Sales: For 2021/2022, the current outstanding balance of 8,800 RB is for Pakistan.
Exports for Own Account: For 2021/2022, the current exports for own account outstanding balance is 100 RB, all Vietnam.
Hides and Skins: Net sales for the 2022 marketing year, which began January 1, totaled 188,800 pieces, primarily for China (124,500 whole cattle hides, including decreases of 13,500 pieces), Mexico (17,000 whole cattle hides, including decreases of 400 pieces), South Korea (16,800 whole cattle hides, including decreases of 1,000 pieces), Taiwan (16,400 whole cattle hides), and Indonesia (10,300 whole cattle hides, including decreases of 100 pieces), were offset by reductions for Thailand (8,400 pieces). Net sales reductions of 400 pieces were carried over from the 2021 marketing year, which ended December 31. Exports for the period ending December 31 of 195,200 pieces brought accumulated exports to 20,003,400 pieces, down 6 percent from the prior year’s total of 21,233,400 pieces. The destinations were primarily to China (132,800 pieces), South Korea (18,100 pieces), Thailand (18,000 pieces), Mexico (13,800 pieces), and Brazil (5,700 pieces).
Net sales for 2022 marketing year, which began January 1, totaled 31,300 wet blues primarily for China (8,800 unsplit, including decreases of 1,000 pieces), Vietnam (8,800 unsplit), Thailand (5,600 unsplit), Taiwan (5,100 unsplit), and Mexico (1,700 unsplit), were offset by reductions for Italy (100 unsplit). In addition, net sales of 200 grain splits were reported for Italy. There were no net sales carried over from the 2021 marketing year which ended on December 31. Exports for the period ending December 31 of 32,800 wet blues brought accumulated exports to 6,929,900 wet blues, up 15 percent prior year total of 6,040,100 wet blues. The primary destinations were China (16,800 unsplit), Italy (8,000 unsplit), and Vietnam (8,000 unsplit). Net sales of splits totaling 296,000 pounds for 2022 marketing year were for China. Accumulated exports of splits in 2021 totaled 19,559,400 pounds, up 17 percent from the prior year’s total of 16,779,200 pounds. Exports of 41,000 pounds were to China.
Beef: Net sales for 2022 marketing year, which began January 1, totaled 9,700 MT primarily for Japan (2,600 MT, including decreases of 300 MT), Mexico (1,400 MT), South Korea (1,400 MT, including decreases of 500 MT), China (1,100 MT, including decreases of 400 MT), and Egypt (500 MT), were offset by reductions for the United Arab Emirates (100 MT). Net sales of 900 MT were carried over from the 2021 marketing year, which ended December 31. Exports for the period ending December 31 of 8,600 MT brought accumulated exports to 925,100 MT, up 9 percent from the prior year total of 851,800 MT. The primary destinations were to South Korea (3,100 MT), Japan (1,900 MT), China (1,700 MT), Taiwan (500 MT), and Mexico (500 MT).
Pork: Net sales for 2022, which began January 1, totaled 19,800 MT primarily for Mexico (10,100 MT, including decreases of 300 MT), Japan (3,100 MT, including decreases of 500 MT), South Korea (2,100 MT, including decreases of 600 MT), China (1,400 MT, including decreases of 400 MT), and Canada (1,300 MT, including decreases of 500 MT), were offset by reductions for Peru (200 MT) and the Philippines (100 MT). Net sales reductions of 3,100 MT was carried over from the 2021 marketing year, which ended December 31. Exports for the period ending December 31 of 20,500 MT brought accumulated exports to 1,791,700 MT, were down 8 percent from the prior year total of 1,938,000 MT. The primary destinations were to Mexico (10,700 MT), China (2,800 MT), Japan (2,800 MT), South Korea (1,500 MT), and Canada (900 MT).
January 13, 2022 1 FOREIGN AGRICULTURAL SERVICE/USDA
Terry Reilly
Senior Commodity Analyst – Grain and Oilseeds
Futures International
One Lincoln Center
18 W 140 Butterfield Rd.
Oakbrook Terrace, Il. 60181
W: 312.604.1366
ICE IM: treilly1
Skype: fi.treilly

Trading of futures, options, swaps and other derivatives is risky and is not suitable for all persons. All of these investment products are leveraged, and you can lose more than your initial deposit. Each investment product is offered only to and from jurisdictions where solicitation and sale are lawful, and in accordance with applicable laws and regulations in such jurisdiction. The information provided here should not be relied upon as a substitute for independent research before making your investment decisions. Futures International, LLC is merely providing this information for your general information and the information does not take into account any particular individual’s investment objectives, financial situation, or needs. All investors should obtain advice based on their unique situation before making any investment decision. The contents of this communication and any attachments are for informational purposes only and under no circumstances should they be construed as an offer to buy or sell, or a solicitation to buy or sell any future, option, swap or other derivative. The sources for the information and any opinions in this communication are believed to be reliable, but Futures International, LLC does not warrant or guarantee the accuracy of such information or opinions. Futures International, LLC and its principals and employees may take positions different from any positions described in this communication. Past results are not necessarily indicative of future results.