PDF attached
USDA Export Sales
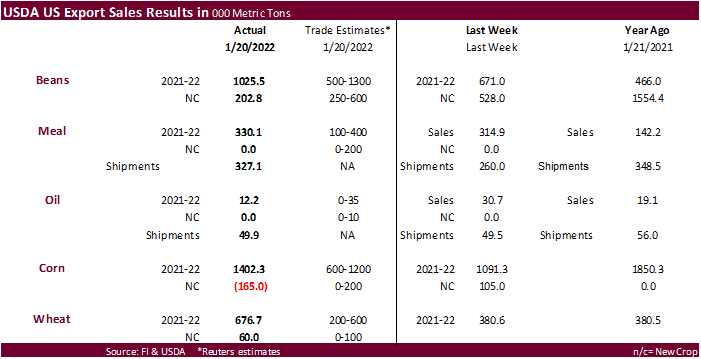
Overall good for the grains and soybean products (shipments). Soybeans ok. USDA US soybean export sales were 1.026 million tons and included increases primarily for China (540,200 MT, including 132,000 MT switched from unknown destinations and decreases of 2,600 MT), Mexico (345,300 MT, including decreases of 67,200 MT), Spain (105,900 MT, including 97,000 MT switched from unknown destinations), and the Netherlands (84,200 MT, including 80,000 MT switched from unknown destinations and decreases 1,800 MT). New-crop soybean sales were 202,800 tons, on the lighter side given the rumors last week China was pricing a good number of new-crop US soybeans. Soybean meal sales were 330,100 tons, within expectations and shipments were very good at 327,100 tons. Soybean oil sales of 12,200 tons slowed from the previous week but shipments were also excellent at 49,900 tons. Previous week shipments for SBO were also an impressive 49,500 tons. USDA US corn export sales of 1.402 million tons topped a range of expectations and included heavy sales to Japan and Mexico. New-crop posted a net reduction of 165,000 tons. Sorghum sales of 328,500 tons for 2021-22 included China (202,500 MT) and unknown destinations (126,000 MT). USDA US all-wheat export sales of 676,700 tons were above expectations and a marketing year high. The Philippines, Nigeria, Japan and Mexico were large buyers.
U.S. EXPORT SALES FOR WEEK ENDING 1/20/2022
|
|
CURRENT MARKETING YEAR |
NEXT MARKETING YEAR |
||||||
|
COMMODITY |
NET SALES |
OUTSTANDING SALES |
WEEKLY EXPORTS |
ACCUMULATED EXPORTS |
NET SALES |
OUTSTANDING SALES |
||
|
CURRENT YEAR |
YEAR |
CURRENT YEAR |
YEAR |
|||||
|
|
THOUSAND METRIC TONS |
|||||||
|
WHEAT |
|
|
|
|
|
|
|
|
|
HRW |
279.2 |
2,165.8 |
1,356.2 |
130.2 |
4,614.1 |
6,001.4 |
15.0 |
39.5 |
|
SRW |
86.9 |
743.9 |
443.1 |
45.2 |
1,831.9 |
1,156.6 |
16.0 |
70.5 |
|
HRS |
199.9 |
1,361.7 |
1,894.3 |
111.3 |
3,265.8 |
4,513.2 |
15.0 |
31.0 |
|
WHITE |
110.1 |
819.6 |
2,398.1 |
73.7 |
2,234.4 |
3,349.8 |
14.0 |
42.0 |
|
DURUM |
0.4 |
54.6 |
168.0 |
0.4 |
113.1 |
489.8 |
0.0 |
33.0 |
|
TOTAL |
676.7 |
5,145.6 |
6,259.7 |
360.9 |
12,059.2 |
15,510.8 |
60.0 |
216.0 |
|
BARLEY |
0.0 |
18.0 |
13.3 |
0.0 |
12.5 |
17.2 |
0.0 |
0.0 |
|
CORN |
1,402.3 |
25,549.0 |
29,648.7 |
1,436.9 |
18,399.1 |
19,021.3 |
-165.0 |
1,452.0 |
|
SORGHUM |
328.5 |
4,172.0 |
3,358.6 |
73.9 |
1,962.8 |
2,398.7 |
0.0 |
53.0 |
|
SOYBEANS |
1,025.5 |
9,101.5 |
12,271.2 |
1,594.1 |
35,032.4 |
45,485.3 |
202.8 |
1,196.9 |
|
SOY MEAL |
330.1 |
2,938.4 |
2,845.9 |
327.1 |
3,937.2 |
4,052.3 |
-99.0 |
138.2 |
|
SOY OIL |
12.2 |
176.1 |
233.7 |
49.9 |
304.5 |
340.0 |
-0.1 |
0.2 |
|
RICE |
|
|
|
|
|
|
|
|
|
L G RGH |
31.2 |
172.2 |
294.9 |
37.1 |
637.8 |
838.7 |
0.0 |
0.0 |
|
M S RGH |
0.0 |
10.3 |
14.8 |
0.1 |
3.3 |
14.1 |
0.0 |
0.0 |
|
L G BRN |
5.2 |
10.3 |
10.3 |
0.5 |
28.0 |
23.1 |
0.0 |
0.0 |
|
M&S BR |
0.9 |
68.4 |
53.5 |
0.1 |
16.9 |
52.5 |
0.0 |
0.0 |
|
L G MLD |
24.8 |
92.9 |
75.3 |
10.7 |
418.1 |
326.9 |
0.0 |
0.0 |
|
M S MLD |
13.6 |
102.0 |
168.5 |
14.0 |
198.1 |
243.1 |
0.0 |
0.0 |
|
TOTAL |
75.7 |
456.0 |
617.4 |
62.5 |
1,302.1 |
1,498.4 |
0.0 |
0.0 |
|
COTTON |
|
THOUSAND RUNNING BALES |
||||||
|
UPLAND |
391.3 |
8,057.6 |
6,083.6 |
197.9 |
3,601.0 |
6,395.6 |
106.8 |
1,398.5 |
|
PIMA |
3.6 |
220.8 |
271.8 |
4.3 |
165.8 |
373.6 |
0.0 |
5.3 |
This summary is based on reports from exporters for the period January 14-20, 2022.
Wheat: Net sales of 676,700 metric tons (MT) for 2021/2022–a marketing-year high–were up 78 percent from the previous week and up noticeably from the prior 4-week average. Increases were primarily for the Philippines (111,100 MT), Nigeria (110,300 MT, including decreases of 46,000 MT), Japan (102,600 MT, including decreases of 400 MT), Mexico (80,100 MT, including decreases of 4,800 MT), and South Korea (78,000 MT, including decreases of 5,000 MT). Net sales of 60,000 MT for 2022/2023 were reported for Honduras (29,000 MT), Japan (21,000 MT), and unknown destinations (10,000 MT). Exports of 360,900 MT were down 8 percent from the previous week, but up 21 percent from the prior 4-week average. The destinations were primarily to the Philippines (123,100 MT), Nigeria (50,300 MT), Mexico (44,400 MT), Jamaica (29,500 MT), and Japan (29,300 MT).
Corn: Net sales of 1,402,300 MT for 2021/2022 were up 29 percent from the previous week and 84 percent from the prior 4-week average. Increases primarily for Japan (563,700 MT, including 219,700 MT switched from unknown destinations and decreases of 3,100 MT), Mexico (266,000 MT, including decreases of 44,200 MT), unknown destinations (102,100 MT, including 65,000 MT – late), Colombia (98,400 MT, including 41,000 MT switched from unknown destinations and decreases of 8,600 MT), and Guatemala (67,900 MT, including decreases of 1,900 MT), were offset by reductions for Morocco (100 MT). Net sales reductions of 165,000 MT for 2022/2023 were reported for Japan (110,000 MT) and Mexico (55,000 MT). Exports of 1,436,900 MT–a marketing-year high–were up 11 percent from the previous week and 36 percent from the prior 4-week average. The destinations were primarily to Japan (415,300 MT), Mexico (371,000 MT, including 27,300 MT – late), China (347,900 MT), Canada (104,600 MT), and Colombia (61,400 MT).
Optional Origin Sales: For 2021/2022, new optional origin sales of 65,000 MT were reported for South Korea. Options were exercised to export 74,000 MT to unknown destinations from the United States. Decreases totaling 32,000 MT were reported for Italy. The current outstanding balance of 342,300 MT is for unknown destinations (235,000 MT), South Korea (65,000 MT), Italy (33,300 MT), and Saudi Arabia (9,000 MT).
Late Reporting: For 2021/2022, net sales totaling 65,000 MT of corn were reported late for unknown destinations. Exports totaling 27,300 MT of corn were reported late to Mexico.
Barley: No net sales or exports were reported for the week.
Sorghum: Net sales of 328,500 MT for 2021/2022 were down 31 percent from the previous week, but up 87 percent from the prior 4-week average. Increases were reported for China (202,500 MT) and unknown destinations (126,000 MT). Exports of 73,900 MT were down 46 percent from the previous week and 44 percent from the prior 4-week average. The destinations were to China (73,200 MT) and Mexico (700 MT).
Rice: Net sales of 75,700 MT for 2021/2022 were up 77 percent from the previous week and 88 percent from the prior 4-week average. Increases were primarily for Mexico (25,500 MT), Haiti (15,100 MT, including decreases of 100 MT), Japan (12,000 MT), Canada (9,800 MT), and Guatemala (6,700 MT). Exports of 62,500 MT were up noticeably from the previous week and from the prior 4-week average. The destinations were primarily to Mexico (29,600 MT), Japan (13,000 MT), Guatemala (9,400 MT), Haiti (7,100 MT), and Canada (2,100 MT).
Exports for Own Account: For 2021/2022, the current exports for own account outstanding balance is 100 MT, all Canada.
Soybeans: Net sales of 1,025,500 MT for 2021/2022 were up 53 percent from the previous week and 77 percent from the prior 4-week average. Increases primarily for China (540,200 MT, including 132,000 MT switched from unknown destinations and decreases of 2,600 MT), Mexico (345,300 MT, including decreases of 67,200 MT), Spain (105,900 MT, including 97,000 MT switched from unknown destinations), the Netherlands (84,200 MT, including 80,000 MT switched from unknown destinations and decreases 1,800 MT), and Japan (79,000 MT, including 70,500 MT switched from unknown destinations and decreases of 100 MT), were offset by reductions primarily for unknown destinations (405,800 MT). Net sales of 202,800 MT for 2022/2023 were reported for China (198,000 MT) and Japan (4,800 MT). Exports of 1,594,100 MT were down 12 percent from the previous week, but up 1 percent from the prior 4-week average. The destinations were primarily to China (844,400 MT, including 138,300 MT – late), Mexico (111,200 MT), Spain (105,900 MT), Japan (89,900 MT), and the Netherlands (84,200 MT).
Export for Own Account: For 2021/2022, the current exports for own account outstanding balance is 3,000 MT, all Canada.
Late Reporting: For 2021/2022, export totaling 138,300 MT of soybeans were reported late to China.
Soybean Cake and Meal: Net sales of 330,100 MT for 2021/2022 were up 5 percent from the previous week and up noticeably from the prior 4-week average. Increases primarily for Ecuador (70,900 MT), Vietnam (50,000 MT switched from Thailand), the Philippines (48,800 MT), Honduras (37,000 MT), and Guatemala (36,700 MT), were offset by reductions primarily for Thailand (53,000 MT) and Mexico (44,300 MT). Net sales reductions of 99,000 MT for 2022/2023 resulting in increases for Canada (600 MT) and Japan (400 MT), were more than offset by reductions for Spain (100,000 MT). Exports of 327,100 MT were up 26 percent from the previous week and 51 percent from the prior 4-week average. The destinations were primarily to Ecuador (70,300 MT), the Philippines (51,700 MT), Denmark (48,700 MT), Thailand (47,000 MT), and Morocco (29,700 MT).
Optional Origin Sales: For 2021/2022, the current outstanding balance of 50,000 MT is for Venezuela.
Soybean Oil: Net sales of 12,200 MT for 2021/2022 were down 61 percent from the previous week, but up 22 percent from the prior 4-week average. Increases were primarily for Mexico (5,000 MT), Venezuela (3,000 MT), the Dominican Republic (2,000 MT), and Canada (1,700 MT). Total net sales reductions of 100 MT for 2022/2023 were for Canada. Exports of 49,900 MT–a marketing-year high–were up 1 percent from the previous week and 72 percent from the prior 4-week average. The destinations were primarily to India (33,000 MT), Colombia (7,100 MT), the Dominican Republic (5,000 MT), Jamaica (3,500 MT), and Mexico (1,000 MT).
Cotton: Net sales of 391,300 RB for 2021/2022 were up 43 percent from the previous week and 55 percent from the prior 4-week average. Increases primarily for Vietnam (132,900 RB, including 600 RB switched from South Korea and 400 RB switched from Japan), India (62,400 RB, including decreases of 3,500 RB), China (58,200 RB, including 8,400 RB switched from unknown destinations and decreases of 2,200 RB), Bangladesh (39,400 RB), and Pakistan (37,300 RB), were offset by reductions for unknown destinations (8,400 RB). Net sales of 106,800 RB for 2022/2023 were primarily for Indonesia (33,900 RB), Pakistan (22,900 RB), Guatemala (14,000 RB), Turkey (13,600 RB), and Honduras (9,700 RB). Exports of 197,900 RB were unchanged from the previous week, but up 25 percent from the prior 4-week average. The destinations were primarily to China (64,200 RB), Turkey (23,800 RB), Vietnam (23,300 RB), Pakistan (20,300 RB), and Mexico (15,700 RB). Net sales of Pima totaling 3,600 RB were down 5 percent from the previous week and 19 percent from the prior 4-week average. Increases were reported for India (1,700 RB), Vietnam (800 RB), China (800 RB), Japan (200 RB), and Mexico (100 RB). Exports of 4,300 RB were down 43 percent from the previous week and 44 percent from the prior 4-week average. The destinations were primarily to India (1,700 RB), Peru (1,300 RB), China (700 RB), and Egypt (400 RB).
Optional Origin Sales: For 2021/2022, the current outstanding balance of 61,600 RB is for Vietnam (52,800 RB) and Pakistan (8,800 RB).
Exports for Own Account: For 2021/2022, the current exports for own account outstanding balance is 100 RB, all Vietnam.
Hides and Skins: Net sales of 592,900 pieces for 2022, primarily for China (351,800 whole cattle hides, including 10,600 whole cattle hides switched from Cambodia and decreases of 6,200 pieces), South Korea (72,700 whole cattle hides, including decreases of 3,200 pieces), Mexico (54,400 whole cattle hides, including decreases of 500 pieces), Thailand (28,000 whole cattle hides, including decreases of 1,800 pieces), and Brazil (23,800 whole cattle hides, including decreases of 700 pieces), were offset by reductions for Cambodia (10,600 pieces). In addition, total net sales of 7,000 calf skins were reported for Italy. Exports of 420,900 pieces were primarily to China (258,300 pieces), South Korea (60,200 pieces), Mexico (37,100 pieces), Thailand (33,800 pieces), and Taiwan (10,600 pieces). In addition, exports of 3,200 were to Italy (1,800 calf skins and 1,400 kip skins).
Net sales of 343,400 wet blues for 2022 were primarily for Vietnam (145,400 unsplit, including decreases of 200 unsplit), Italy (96,500 unsplit and 100 grain splits), China (70,800 unsplit, including decreases of 100 unsplit), and Mexico (16,800 grain splits and 4,300 unsplit). Exports of 169,900 wet blues were primarily to Vietnam (72,300 unsplit), China (50,800 unsplit), Italy 28,700 unsplit and 3,200 grain splits), Mexico (6,000 grain splits and 3,500 unsplit), and South Korea (3,200 grain splits). Net sales of 1,186,300 splits for 2022 were reported for Vietnam (1,184,800 pounds, including decreases of 16,000 pounds) and China (1,500 pounds, including decreases of 1,300 pounds). Exports of 607,500 pounds were primarily to Vietnam (483,600 pounds).
Beef: Net sales of 14,300 MT for 2022 were primarily for South Korea (6,200 MT, including decreases of 400 MT), Japan (3,900 MT, including decreases of 500 MT), Mexico (600 MT), China (600 MT, including decreases of 900 MT), and Indonesia (600 MT). Exports of 14,300 MT were primarily to Japan (4,100 MT), South Korea (3,900 MT), China (1,900 MT), Taiwan (1,300 MT), and Mexico (900 MT).
Pork: Net sales of 49,100 MT for 2022, primarily for Mexico (17,300 MT, including decreases of 300 MT), China (16,900 MT, including decreases of 200 MT), Canada (3,000 MT, including decreases of 500 MT), Japan (2,700 MT, including decreases of 400 MT), and South Korea (2,600 MT, including decreases of 300 MT), were offset by reductions for Trinidad and Tobago (100 MT), Australia (100 MT), and Guatemala (100 MT). Exports of 30,700 MT were primarily to Mexico (16,000 MT), Japan (3,600 MT), China (3,600 MT), South Korea (2,000 MT), and Canada (1,400 MT).
January 27, 2022 1 FOREIGN AGRICULTURAL SERVICE/USDA
Terry Reilly
Senior Commodity Analyst – Grain and Oilseeds
Futures International
One Lincoln Center
18 W 140 Butterfield Rd.
Oakbrook Terrace, Il. 60181
W: 312.604.1366
ICE IM: treilly1
Skype: fi.treilly

Trading of futures, options, swaps and other derivatives is risky and is not suitable for all persons. All of these investment products are leveraged, and you can lose more than your initial deposit. Each investment product is offered only to and from jurisdictions where solicitation and sale are lawful, and in accordance with applicable laws and regulations in such jurisdiction. The information provided here should not be relied upon as a substitute for independent research before making your investment decisions. Futures International, LLC is merely providing this information for your general information and the information does not take into account any particular individual’s investment objectives, financial situation, or needs. All investors should obtain advice based on their unique situation before making any investment decision. The contents of this communication and any attachments are for informational purposes only and under no circumstances should they be construed as an offer to buy or sell, or a solicitation to buy or sell any future, option, swap or other derivative. The sources for the information and any opinions in this communication are believed to be reliable, but Futures International, LLC does not warrant or guarantee the accuracy of such information or opinions. Futures International, LLC and its principals and employees may take positions different from any positions described in this communication. Past results are not necessarily indicative of future results.