PDF attached
USDA Export Sales
Marketing year high was posted for soybean meal, one reason why futures rallied over soybean oil over the past week as SA supplies dried up. New-crop soybean sales were better than expected and soybean oil sales fell sharply from the previous week. All-wheat sales were poor while corn was within expectations. There were no surprises in sorghum and meat sales.
This summary is based on reports from exporters for the period January 21-27, 2022.
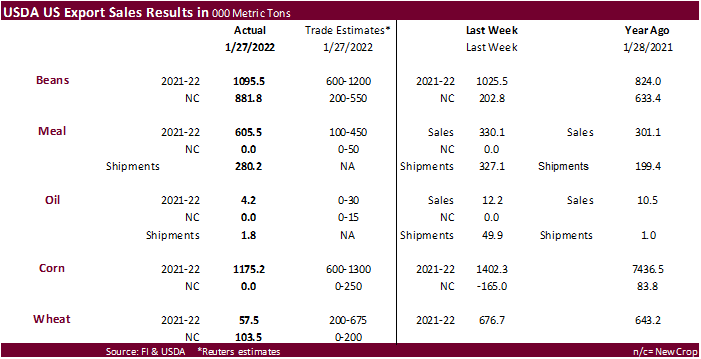
Wheat: Net sales of 57,500 metric tons (MT) for 2021/2022 were down 92 percent from the previous week and 83 percent from the prior 4-week average. Increases primarily for Colombia (52,800 MT, including 52,600 MT switched from unknown destinations), Nigeria (52,000 MT), Haiti (27,000 MT switched from unknown destinations), Nicaragua (21,000 MT), and the Dominican Republic (17,900 MT), were offset by reductions for unknown destinations (75,000 MT), the Philippines (46,900 MT), and Mexico (21,000 MT). Net sales of 103,500 MT for 2022/2023 were reported for the Philippines (50,000 MT), Mexico (38,500 MT), and unknown destinations (15,000 MT). Exports of 383,600 MT were up 6 percent from the previous week and 26 percent from the prior 4-week average. The destinations were primarily to Japan (119,500 MT), Colombia (65,800 MT), Thailand (55,400 MT), Mexico (47,200 MT), and the Philippines (29,700 MT).
Corn: Net sales of 1,175,200 MT for 2021/2022 were down 16 percent from the previous week, but up 47 percent from the prior 4-week average. Increases were primarily for Japan (475,300 MT, including 190,600 MT switched from unknown destinations and decreases of 129,800 MT), Mexico (210,100 MT, including decreases of 2,200 MT), Colombia (136,100 MT, including 50,000 MT switched from unknown destinations and decreases of 35,000 MT), Guatemala (120,700 MT, including decreases of 3,600 MT), and Canada (55,600 MT, including decreases of 400 MT). Exports of 1,166,600 MT were down 19 percent from the previous week and 1 percent from the prior 4-week average. The destinations were primarily to Mexico (346,200 MT), Japan (246,800 MT), China (205,900 MT), Colombia (124,400 MT), and Canada (122,900 MT).
Optional Origin Sales: For 2021/2022, decreases totaling 1,500 MT were for Italy. The current outstanding balance of 340,800 MT is for unknown destinations (235,000 MT), South Korea (65,000 MT), Italy (31,800 MT), and Saudi Arabia (9,000 MT). For 2022/2023, new optional origin sales of 1,500 MT were for Italy. The current outstanding balance of 1,500 MT is for Italy.
Barley: No net sales were reported for the week. Exports of 900 MT were unchanged from the previous week, but up noticeably from the prior 4-week average. The destination was to Japan.
Sorghum: Net sales of 81,100 MT for 2021/2022 resulting in increases for China (141,100 MT, including 123,000 MT switched from unknown destinations and decreases of 64,900 MT), were offset by reductions for unknown destinations (60,000 MT). Exports of 123,200 MT were up 67 percent from the previous week and 16 percent from the prior 4-week average. The destination was primarily to China (122,600 MT).
Rice: Net sales of 157,200 MT for 2021/2022–a marketing-year high–were up noticeably from the previous week and from the prior 4-week average. Increases were primarily for Japan (49,000 MT), Mexico (45,000 MT), Nicaragua (30,000 MT), South Korea (18,100 MT), and the United Kingdom (10,000 MT). Exports of 67,700 MT were up 8 percent from the previous week and 74 percent from the prior 4-week average. The destinations were primarily to Mexico (35,100 MT), Haiti (15,300 MT), Japan (13,400 MT), Canada (2,600 MT), and Jordan (200 MT).
Exports for Own Account: For 2021/2022, the current exports for own account outstanding balance is 100 MT, all Canada.
Soybeans: Net sales of 1,095,500 MT for 2021/2022 were up 7 percent from the previous week and 56 percent from the prior 4-week average. Increases primarily for Mexico (356,600 MT, including decreases of 44,500 MT), Egypt (135,000 MT), the Netherlands (132,000 MT, including 120,000 MT switched from unknown destinations), unknown destinations (90,600 MT), and Japan (88,000 MT, including 10,000 MT switched from unknown destinations and decreases of 2,400 MT), were offset by reductions for Singapore (66,000 MT) and China (28,600 MT). Net sales of 881,800 MT for 2022/2023 were reported for China (660,000 MT), unknown destinations (132,000 MT), Bangladesh (55,000 MT), Mexico (34,000 MT), and Canada (800 MT). Exports of 1,328,900 MT were down 17 percent from the previous week and 14 percent from the prior 4-week average. The destinations were primarily to China (723,400 MT), the Netherlands (132,000 MT), Taiwan (91,300 MT), Indonesia (82,100 MT), and Mexico (79,000 MT).
Export for Own Account: For 2021/2022, the current exports for own account outstanding balance is 3,000 MT, all Canada.
Soybean Cake and Meal: Net sales of 605,500 MT for 2021/2022–a marketing-year high–were up 83 percent from the previous week and up noticeably from the prior 4-week average. Increases primarily for Colombia (174,400 MT, including decreases of 400 MT), the Philippines (138,700 MT), Ireland (80,400 MT, including 24,000 MT switched from unknown destinations), Guatemala (58,100 MT), and Mexico (36,300 MT, including decreases of 7,200 MT), were offset by reductions primarily for unknown destinations (39,700 MT). Net sales reductions of 1,300 MT for 2022/2023 were reported for Canada (700 MT) and Japan (600 MT). Exports of 280,200 MT were down 14 percent from the previous week, but up 10 percent from the prior 4-week average. The destinations were primarily to the Philippines (115,100 MT), Mexico (50,000 MT), Ireland (27,800 MT), Colombia (16,500 MT), and Canada (16,300 MT).
Optional Origin Sales: For 2021/2022, the current outstanding balance of 50,000 MT is for Venezuela.
Soybean Oil: Net sales of 4,100 MT for 2021/2022 were down 66 percent from the previous week and 61 percent from the prior 4-week average. Increases reported for Canada (3,700 MT) and the Dominican Republic (400 MT), were offset by reductions for Colombia (100 MT). Exports of 1,800 MT were down 96 percent from the previous week and 95 percent from the prior 4-week average. The destinations were to Mexico (1,200 MT) and Canada (600 MT).
Cotton: Net sales of 332,100 RB for 2021/2022 were down 15 percent from the previous week, but up 10 percent from the prior 4-week average. Increases primarily for China (90,200 RB, including decreases of 9,100 RB), Vietnam (58,700 RB, including 400 RB switched from Japan and decreases of 700 RB), India (44,100 RB, including 5,200 RB switched from Turkey), Mexico (34,900 RB), and Pakistan (34,900 RB, including 2,800 RB switched from Turkey), were offset by reductions for Japan (700 RB). Net sales of 315,100 RB for 2022/2023, primarily for Bangladesh (105,600 RB), China (61,600 RB), Mexico (52,000 RB), Indonesia (37,000 RB), and Pakistan (24,200 RB), were offset by reductions for Honduras (1,100 RB). Exports of 302,100 RB–a marketing-year high–were up 53 percent from the previous week and 81 percent from the prior 4-week average. The destinations were primarily to China (132,000 RB), Pakistan (44,000 RB), Vietnam (30,600 RB), Turkey (29,300 RB), and Mexico (15,600 RB). Net sales of Pima totaling 7,900 RB were up noticeably from the previous week and from the prior 4-week average. Increases primarily for China (2,500 RB), Vietnam (1,800 RB), India (1,700 RB), Greece (1,300 RB), and Turkey (600 RB), were offset by reductions for Italy (700 RB). Net sales of 3,200 RB for 2022/2023 were reported for Egypt (2,200 RB) and Italy (1,000 RB). Exports of 14,000 RB–a marketing-year high–were up noticeably from the previous week and up 98 percent from the prior 4-week average. The destinations were primarily to India (4,500 RB), Vietnam (3,300 RB), China (3,100 RB), Egypt (1,300 RB), and Pakistan (900 RB).
Optional Origin Sales: For 2021/2022, the current outstanding balance of 61,600 RB is for Vietnam (52,800 RB) and Pakistan (8,800 RB).
Exports for Own Account: For 2021/2022, the current exports for own account outstanding balance is 100 RB, all Vietnam.
Hides and Skins: Net sales of 556,600 pieces for 2022 were primarily for China (338,000 whole cattle hides, including decreases of 8,400 pieces), Thailand (67,800 whole cattle hides, including decreases of 1,400 pieces), South Korea (56,900 whole cattle hides, including decreases of 2,200 pieces), Mexico (54,500 whole cattle hides, including decreases of 1,000 pieces), and Taiwan (12,600 whole cattle hides, including decreases of 1,100 pieces). In addition, total net sales of 2,600 kip skins were reported for China. Exports of 357,100 pieces were primarily to China (239,800 pieces), South Korea (32,300 pieces), Mexico (31,600 pieces), Thailand (28,300 pieces), and Taiwan (13,800 pieces).
Net sales of 98,800 wet blues for 2022, primarily for Vietnam (42,200 unsplit and 1,300 grain splits, including decreases of 100 unsplit), China (28,000 unsplit), Italy (9,300 grain splits and 2,300 unsplit, including decreases of 100 unsplit and 100 grain splits), Thailand (7,500 unsplit, including decreases of 500 unsplit), and Portugal (6,400 grain splits), were offset by reductions for Hong Kong (200 unsplit). Exports of 171,000 wet blues were primarily to China (58,400 unsplit), Italy 36,100 unsplit and 12,700 grain splits), Vietnam (42,600 unsplit), Thailand (10,700 unsplit), and Mexico (3,900 grain splits and 900 unsplit). Net sales of 716,900 splits for 2022, reported for Vietnam (728,500 pounds), South Korea (5,700 pounds, including decreases of 4,200 pounds), and Mexico (4,500 pounds), were offset by reductions for China (21,800 pounds). Exports of 936,300 pounds were to Vietnam (457,900 pounds), China (391,900 pounds), and Mexico (86,500 pounds).
Beef: Net sales of 20,100 MT for 2022, primarily for Japan (11,800 MT, including decreases of 600 MT), South Korea (3,500 MT, including decreases of 800 MT), Taiwan (1,600 MT, including decreases of 100 MT), China (900 MT, including decreases of 200 MT), and Mexico (800 MT), were offset by reductions for Italy (100 MT) and Bahamas (100 MT). Exports of 16,900 MT were primarily to South Korea (5,900 MT), Japan (4,700 MT), China (1,900 MT), Taiwan (1,200 MT), and Mexico (1,100 MT).
Pork: Net sales of 30,400 MT for 2022, primarily for Mexico (20,700 MT, including decreases of 300 MT), Japan (6,000 MT, including decreases of 700 MT), Canada (1,500 MT, including decreases of 400 MT), Colombia (900 MT, including decreases of 100 MT), and Honduras (400 MT, including 100 MT switched from Guatemala), were offset by reductions for China (500 MT). Exports of 32,400 MT were primarily to Mexico (16,000 MT), Japan (6,300 MT), China (3,100 MT), South Korea (2,600 MT), and Canada (1,800 MT).
U.S. EXPORT SALES FOR WEEK ENDING 1/27/2022
|
|
CURRENT MARKETING YEAR |
NEXT MARKETING YEAR |
||||||
|
COMMODITY |
NET SALES |
OUTSTANDING SALES |
WEEKLY EXPORTS |
ACCUMULATED EXPORTS |
NET SALES |
OUTSTANDING SALES |
||
|
CURRENT YEAR |
YEAR |
CURRENT YEAR |
YEAR |
|||||
|
|
THOUSAND METRIC TONS |
|||||||
|
WHEAT |
|
|
|
|
|
|
|
|
|
HRW |
71.7 |
2,036.6 |
1,358.1 |
200.9 |
4,815.0 |
6,186.8 |
0.0 |
39.5 |
|
SRW |
-17.1 |
710.6 |
445.2 |
16.2 |
1,848.1 |
1,207.6 |
38.5 |
109.0 |
|
HRS |
5.5 |
1,266.7 |
2,019.1 |
100.5 |
3,366.3 |
4,638.9 |
25.0 |
56.0 |
|
WHITE |
-2.7 |
751.0 |
2,415.2 |
65.9 |
2,300.2 |
3,485.1 |
25.0 |
67.0 |
|
DURUM |
0.0 |
54.6 |
167.2 |
0.0 |
113.1 |
490.6 |
15.0 |
48.0 |
|
TOTAL |
57.5 |
4,819.5 |
6,404.7 |
383.6 |
12,442.8 |
16,008.9 |
103.5 |
319.5 |
|
BARLEY |
0.0 |
17.1 |
11.8 |
0.9 |
13.4 |
18.7 |
0.0 |
0.0 |
|
CORN |
1,175.2 |
25,557.6 |
36,089.8 |
1,166.6 |
19,565.7 |
20,016.7 |
0.0 |
1,452.0 |
|
SORGHUM |
81.1 |
4,130.0 |
3,112.6 |
123.2 |
2,086.0 |
2,708.4 |
0.0 |
53.0 |
|
SOYBEANS |
1,095.5 |
8,868.1 |
11,131.8 |
1,328.9 |
36,361.4 |
47,391.2 |
881.8 |
2,078.7 |
|
SOY MEAL |
605.5 |
3,263.6 |
2,947.6 |
280.2 |
4,217.5 |
4,251.7 |
-1.3 |
136.9 |
|
SOY OIL |
4.1 |
178.5 |
243.2 |
1.8 |
306.3 |
340.9 |
0.0 |
0.2 |
|
RICE |
|
|
|
|
|
|
|
|
|
L G RGH |
76.9 |
215.4 |
315.5 |
33.7 |
671.5 |
841.6 |
0.0 |
0.0 |
|
M S RGH |
0.0 |
9.9 |
12.3 |
0.5 |
3.8 |
16.7 |
0.0 |
0.0 |
|
L G BRN |
10.2 |
20.0 |
11.4 |
0.4 |
28.4 |
23.3 |
0.0 |
0.0 |
|
M&S BR |
0.1 |
68.3 |
53.1 |
0.1 |
17.0 |
53.2 |
0.0 |
0.0 |
|
L G MLD |
1.3 |
76.9 |
87.7 |
17.4 |
435.4 |
331.9 |
0.0 |
0.0 |
|
M S MLD |
68.7 |
155.1 |
204.7 |
15.6 |
213.6 |
261.8 |
0.0 |
0.0 |
|
TOTAL |
157.2 |
545.6 |
684.6 |
67.7 |
1,369.8 |
1,528.5 |
0.0 |
0.0 |
|
COTTON |
|
THOUSAND RUNNING BALES |
||||||
|
UPLAND |
332.1 |
8,087.6 |
6,051.4 |
302.1 |
3,903.1 |
6,714.6 |
315.1 |
1,713.7 |
|
PIMA |
7.9 |
214.8 |
270.6 |
14.0 |
179.8 |
393.9 |
3.2 |
8.5 |
Terry Reilly
Senior Commodity Analyst – Grain and Oilseeds
Futures International
One Lincoln Center
18 W 140 Butterfield Rd.
Oakbrook Terrace, Il. 60181
W: 312.604.1366
ICE IM: treilly1
Skype: fi.treilly

Trading of futures, options, swaps and other derivatives is risky and is not suitable for all persons. All of these investment products are leveraged, and you can lose more than your initial deposit. Each investment product is offered only to and from jurisdictions where solicitation and sale are lawful, and in accordance with applicable laws and regulations in such jurisdiction. The information provided here should not be relied upon as a substitute for independent research before making your investment decisions. Futures International, LLC is merely providing this information for your general information and the information does not take into account any particular individual’s investment objectives, financial situation, or needs. All investors should obtain advice based on their unique situation before making any investment decision. The contents of this communication and any attachments are for informational purposes only and under no circumstances should they be construed as an offer to buy or sell, or a solicitation to buy or sell any future, option, swap or other derivative. The sources for the information and any opinions in this communication are believed to be reliable, but Futures International, LLC does not warrant or guarantee the accuracy of such information or opinions. Futures International, LLC and its principals and employees may take positions different from any positions described in this communication. Past results are not necessarily indicative of future results.