PDF attached
USDA Export Sales
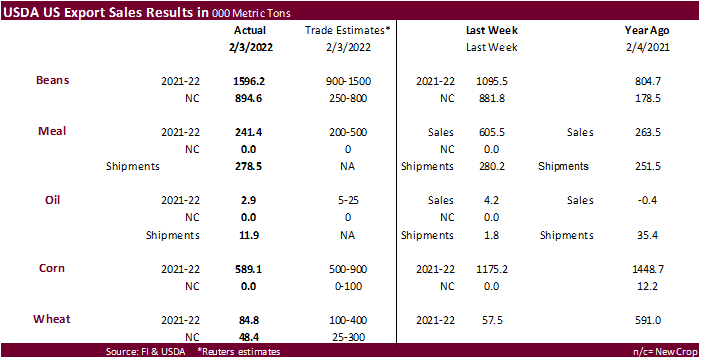
USDA export sales for soybeans topped expectations, meal was withing, and soybean oil was reported below a range of estimates. Shipments for meal and oil were ok. Soybean sales included unknown destinations (804,400 MT), China (298,100 MT, including 129,000 MT switched from unknown destinations and decreases of 5,700 MT). Corn export sales were at the low end of expectations while wheat was only 84,800 tons for old crop. Sorghum sales were 140,700 tons. Pork sales were 18,100 tons.
U.S. EXPORT SALES FOR WEEK ENDING 2/3/2022
|
|
CURRENT MARKETING YEAR |
NEXT MARKETING YEAR |
||||||
|
COMMODITY |
NET SALES |
OUTSTANDING SALES |
WEEKLY EXPORTS |
ACCUMULATED EXPORTS |
NET SALES |
OUTSTANDING SALES |
||
|
CURRENT YEAR |
YEAR |
CURRENT YEAR |
YEAR |
|||||
|
|
THOUSAND METRIC TONS |
|||||||
|
WHEAT |
|
|
|
|
|
|
|
|
|
HRW |
42.6 |
1,936.6 |
1,440.2 |
142.6 |
4,957.6 |
6,316.4 |
28.3 |
67.8 |
|
SRW |
1.4 |
652.4 |
483.5 |
59.6 |
1,907.7 |
1,224.9 |
16.1 |
125.1 |
|
HRS |
15.6 |
1,182.3 |
2,074.9 |
99.9 |
3,466.2 |
4,828.2 |
5.0 |
61.0 |
|
WHITE |
25.3 |
697.5 |
2,392.8 |
78.8 |
2,379.1 |
3,585.8 |
0.0 |
67.0 |
|
DURUM |
0.0 |
54.6 |
165.4 |
0.0 |
113.1 |
492.5 |
-1.0 |
47.0 |
|
TOTAL |
84.8 |
4,523.4 |
6,556.9 |
380.9 |
12,823.7 |
16,447.8 |
48.4 |
367.9 |
|
BARLEY |
-2.0 |
13.8 |
11.6 |
1.3 |
14.7 |
19.0 |
0.0 |
0.0 |
|
CORN |
589.1 |
24,997.3 |
35,972.7 |
1,149.4 |
20,715.1 |
21,582.5 |
0.0 |
1,452.0 |
|
SORGHUM |
140.7 |
4,112.6 |
3,167.7 |
158.1 |
2,244.1 |
2,763.3 |
0.0 |
53.0 |
|
SOYBEANS |
1,596.2 |
9,162.9 |
9,722.6 |
1,301.4 |
37,662.8 |
49,460.7 |
894.6 |
2,973.3 |
|
SOY MEAL |
241.4 |
3,226.6 |
2,959.6 |
278.5 |
4,495.4 |
4,503.1 |
-2.2 |
134.7 |
|
SOY OIL |
2.9 |
169.4 |
207.4 |
11.9 |
318.2 |
376.3 |
-0.2 |
0.0 |
|
RICE |
|
|
|
|
|
|
|
|
|
L G RGH |
128.3 |
306.7 |
276.6 |
36.9 |
708.4 |
872.6 |
0.0 |
0.0 |
|
M S RGH |
0.0 |
9.6 |
11.8 |
0.3 |
4.1 |
17.1 |
0.0 |
0.0 |
|
L G BRN |
0.0 |
19.9 |
13.1 |
0.2 |
28.6 |
23.4 |
0.0 |
0.0 |
|
M&S BR |
0.1 |
67.4 |
52.7 |
1.0 |
18.0 |
54.1 |
0.0 |
0.0 |
|
L G MLD |
36.9 |
83.8 |
90.4 |
30.0 |
465.4 |
351.9 |
0.0 |
0.0 |
|
M S MLD |
27.7 |
180.1 |
205.8 |
2.6 |
216.2 |
268.6 |
0.0 |
0.0 |
|
TOTAL |
193.0 |
667.5 |
650.5 |
71.0 |
1,440.8 |
1,587.8 |
0.0 |
0.0 |
|
COTTON |
|
THOUSAND RUNNING BALES |
||||||
|
UPLAND |
185.2 |
7,973.2 |
5,893.1 |
299.7 |
4,202.8 |
7,148.2 |
96.1 |
1,809.8 |
|
PIMA |
5.3 |
199.1 |
273.2 |
20.9 |
200.7 |
401.0 |
4.1 |
12.6 |
This summary is based on reports from exporters for the period January 28, 2022 – February 3, 2022
Wheat: Net sales of 84,800 metric tons (MT) for 2021/2022 were up 48 percent from the previous week, but down 75 percent from the prior 4-week average. Increases primarily for the Philippines (34,600 MT, including decreases of 400 MT), Mexico (33,100 MT, including decreases of 11,400 MT), Panama (24,300 MT, including 25,700 MT switched from El Salvador and decreases of 1,700 MT), unknown destinations (11,400 MT), and Costa Rica (10,400 MT, including 10,100 MT switched from Guatemala), were offset by reductions primarily for Japan (23,500 MT), El Salvador (19,800 MT), and Guatemala (15,200 MT). Net sales of 48,400 MT for 2022/2023 reported for Japan (25,000 MT), Guatemala (14,400 MT), and Mexico (10,000 MT), were offset by reductions for unknown destinations (1,000 MT). Exports of 380,900 MT were down 1 percent from the previous week, but up 9 percent from the prior 4-week average. The destinations were primarily to South Korea (97,600 MT), Japan (96,200 MT), Mexico (87,400 MT), Panama (25,300 MT), and Singapore (24,200 MT).
Corn: Net sales of 589,100 MT for 2021/2022 were down 50 percent from the previous week and 43 percent from the prior 4-week average. Increases primarily for Mexico (370,600 MT, including decreases of 20,300 MT), Japan (347,500 MT, including 156,200 MT switched from unknown destinations and decreases of 2,500 MT), Colombia (135,000 MT, including 132,000 MT switched from unknown destinations and decreases of 6,500 MT), Canada (68,000 MT, including decreases of 1,800 MT), and the Dominican Republic (51,700 MT), were offset by reductions primarily for China (375,200 MT) and unknown destinations (144,500 MT). Exports of 1,149,400 MT were down 2 percent from the previous week and 6 percent from the prior 4-week average. The destinations were primarily to Japan (331,100 MT), China (208,800 MT), Canada (168,100 MT), Mexico (165,100 MT), and Colombia (149,700 MT).
Optional Origin Sales: For 2021/2022, options were exercised to export 125,000 MT to unknown destinations from the United States. The current outstanding balance of 215,800 MT is for unknown destinations (110,000 MT), South Korea (65,000 MT), Italy (31,800 MT), and Saudi Arabia (9,000 MT). For 2022/2023, the current outstanding balance of 1,500 MT is for Italy.
Barley: Total net sales reductions of 2,000 MT for 2021/2022–a marketing-year low–were unchanged from the previous week and from the prior 4-week average. The destination was Japan. Exports of 1,300 MT–a marketing-year high–were up 49 percent from the previous week and up noticeably from the prior 4-week average. The destination was to Japan.
Sorghum: Net sales of 140,700 MT for 2021/2022 were up 74 percent from the previous week, but down 38 percent from the prior 4-week average. Increases reported for China (248,700 MT, including 111,000 MT switched from unknown destinations) and Eritrea (3,000), were offset by reductions for unknown destinations (111,000 MT). Exports of 158,100 MT were up 28 percent from the previous week and 34 percent from the prior 4-week average. The destinations were to China (124,600 MT), Eritrea (33,000 MT), and Mexico (500 MT).
Rice: Net sales of 193,000 MT for 2021/2022–a marketing-year high–were up 23 percent from the previous week and up noticeably from the prior 4-week average. Increases primarily for Colombia (120,000 MT, including 22,000 MT switched from Mexico), Haiti (41,500 MT), Panama (27,400 MT), Japan (25,100 MT), and Canada (1,100 MT, including decreases of 900 MT), were offset by reductions primarily for Mexico (19,500 MT) and the United Kingdom (4,400 MT). Exports of 71,000 MT were up 5 percent from the previous week and 67 percent from the prior 4-week average. The destinations were primarily to Panama (27,400 MT), Haiti (26,300 MT), Mexico (5,600 MT), Honduras (5,000 MT), and Canada (2,200 MT).
Exports for Own Account: For 2021/2022, the current exports for own account outstanding balance is 100 MT, all Canada.
Soybeans: Net sales of 1,596,200 MT for 2021/2022 were up 46 percent from the previous week and 81 percent from the prior 4-week average. Increases primarily for unknown destinations (804,400 MT), China (298,100 MT, including 129,000 MT switched from unknown destinations and decreases of 5,700 MT), Mexico (211,100 MT, including decreases of 900 MT), Egypt (81,700 MT), and Saudi Arabia (69,000 MT, including 28,000 MT switched from unknown destinations), were offset by reductions primarily for the United Kingdom (60,000 MT). Net sales of 894,600 MT for 2022/2023 were primarily for unknown destinations (433,000 MT), China (316,000 MT), Algeria (84,000 MT), and the United Kingdom (60,000 MT). Exports of 1,301,400 MT were down 2 percent from the previous week and 9 percent from the prior 4-week average. The destinations were primarily to China (726,600 MT), Japan (137,900 MT, including 51,700 MT – late), Mexico (110,100 MT), Egypt (93,700 MT), and Bangladesh (59,400 MT).
Export for Own Account: For 2021/2022, the current exports for own account outstanding balance is 3,000 MT, all Canada.
Late Reporting: For 2021/2022, exports totaling 51,700 MT of soybeans were reported late to Japan.
Soybean Cake and Meal: Net sales of 241,400 MT for 2021/2022 were down 60 percent from the previous week and 29 percent from the prior 4-week average. Increases primarily for Venezuela (50,000 MT), the Philippines (47,000 MT, including 45,000 MT switched from Slovenia), Ireland (40,000 MT), Saudi Arabia (30,000 MT), and Guatemala (27,100 MT, including decreases of 5,000 MT), were offset by reductions primarily for Slovenia (45,000 MT). Net sales reductions of 2,200 MT for 2022/2023 resulting in increases for Canada (1,700 MT), were more than offset by reductions for Spain (3,900 MT). Exports of 278,500 MT were unchanged from the previous week, but up 4 percent from the prior 4-week average. The destinations were primarily to the Philippines (50,000 MT), Vietnam (48,700 MT), Mexico (33,700 MT), Ecuador (32,700 MT), and Colombia (30,100 MT).
Optional Origin Sales: For 2021/2022, decreases of 50,000 MT were reported for Venezuela.
Export Adjustments: Accumulated exports of soybean cake and meal to Laos were adjusted down 211 MT for week ending January 6th and 317 MT for week ending January 27th. The correct destination for these shipments is Cambodia.
Soybean Oil: Net sales of 2,900 MT for 2021/2022 were down 31 percent from the previous week and 74 percent from the prior 4-week average. Increases were reported for Venezuela (2,500 MT) and Canada (400 MT). Total net sales reductions of 200 MT for 2022/2023 were for Canada. Exports of 11,900 MT were up noticeably from the previous week, but down 58 percent from the prior 4-week average. The destinations were primarily to Venezuela (3,500 MT), Colombia (3,500 MT), Guatemala (1,500 MT), Nicaragua (1,200 MT), and Honduras (1,000 MT).
Cotton: Net sales of 185,200 RB for 2021/2022 were down 44 percent from the previous week and 47 percent from the prior 4-week average. Increases primarily for China (100,800 RB, including decreases of 100 RB), Pakistan (20,600 RB), Vietnam (14,000 RB), Mexico (12,300 RB, including decreases of 600 RB), and Turkey (12,200 RB, including decreases of 9,200 RB), were offset by reductions for Colombia (1,500 RB). Net sales of 96,100 RB for 2022/2023 were primarily for Pakistan (43,100 RB), Mexico (28,300 RB), Indonesia (11,000 RB), the Philippines (7,000 RB), and Guatemala (4,100 RB). Exports of 299,700 RB were down 1 percent from the previous week, but up 38 percent from the prior 4-week average. The destinations were primarily to China (153,700 RB), Vietnam (33,900 RB), Mexico (23,800 RB), Pakistan (22,200 RB), and Turkey (21,000 RB). Net sales of Pima totaling 5,300 RB were down 34 percent from the previous week, but up 19 percent from the prior 4-week average. Increases primarily for China (3,600 RB, including decreases of 100 RB), Bangladesh (800 RB), Egypt (300 RB), Pakistan (200 RB), and Brazil (200 RB), were offset by reductions for Japan (100 RB). Net sales of 4,100 RB for 2022/2023 were reported for Italy (4,000 RB) and Thailand (100 RB). Exports of 20,900 RB–a marketing-year high–were up 49 percent from the previous week and up noticeably from the prior 4-week average. The destinations were primarily to China (8,500 RB), India (8,400 RB), Pakistan (1,500 RB), Vietnam (1,100 RB), and Peru (600 RB).
Optional Origin Sales: For 2021/2022, the current outstanding balance of 61,600 RB is for Vietnam (52,800 RB) and Pakistan (8,800 RB).
Exports for Own Account: For 2021/2022, the current exports for own account outstanding balance is 100 RB, all Vietnam.
Hides and Skins: Net sales of 271,000 pieces for 2022 were down 51 percent from the previous week and 75 percent from the prior 4-week average. Increases primarily for South Korea (84,500 whole cattle hides, including decreases of 1,600 pieces), China (80,800 whole cattle hides, including decreases of 74,700 pieces), Thailand (44,500 whole cattle hides, including decreases of 700 pieces), Italy (39,600 whole cattle hides, including decreases of 200 pieces), and Mexico (8,800 whole cattle hides, including decreases of 7,400 pieces), were offset by reductions primarily for Egypt (2,900 pieces). In addition, total net sales of 2,600 kip skins were reported for China. Exports of 325,300 pieces were down 9 percent from the previous and 7 percent from the prior 4-week average. Whole cattle hides exports were primarily to China (236,100 pieces), South Korea (34,000 pieces), Mexico (20,100 pieces), Thailand (14,500 pieces), and Brazil (3,800 pieces). In addition, exports of 5,500 calf skins were to Italy.
Net sales of 30,000 wet blues for 2022 were down 70 percent from the previous week and 89 percent from the prior 4-week average. Increases primarily for the Dominican Republic (7,200 unsplit and 7,200 grain splits), Italy (12,700 unsplit, including decreases of 200 grain splits), Brazil (5,000 unsplit), Thailand (4,900 unsplit, including decreases of 400 unsplit), and Vietnam (1,300 unsplit), were offset by reductions primarily for China (8,800 unsplit). Total net sales of 1,000 wet blues for 2023 were for Mexico. Exports of 71,600 wet blues were down 58 percent from the previous and 49 percent from the prior 4-week average. The destinations were to Vietnam (29,100 unsplit), China (15,000 unsplit), Italy (6,700 grain splits and 5,600 unsplit), Thailand (5,600 unsplit), and Mexico (4,300 unsplit). Net sales of 47,000 splits were reported for Vietnam (33,100 pounds, including decreases of 4,800 pounds) and South Korea (13,900 pounds). Exports of 377,700 pounds were to Vietnam.
Beef: Net sales of 19,500 MT for 2022 were down 3 percent from the previous week and 63 percent from the prior 4-week average. Increases primarily for Japan (8,600 MT, including decreases of 300 MT), South Korea (7,300 MT, including decreases of 400 MT), Canada (1,000 MT, including decreases of 300 MT), Taiwan (900 MT, including decreases of 100 MT), and Mexico (800 MT), were offset by reductions for China (300 MT), Panama (100 MT), and Chile (100 MT). Exports of 14,600 MT were down 14 percent from the previous week, but up 2 percent from the prior 4-week average. The destinations were primarily to South Korea (4,500 MT), Japan (3,500 MT), China (2,400 MT), Mexico (1,100 MT), and Taiwan (1,100 MT).
Pork: Net sales of 18,100 MT for 2022 were down 40 percent from the previous week and 71 percent from the prior 4-week average. Increases were primarily for Mexico (10,500 MT, including decreases of 900 MT), Japan (2,000 MT, including decreases of 300 MT), Canada (1,400 MT, including decreases of 500 MT), Colombia (1,200 MT), and South Korea (1,000 MT, including decreases of 300 MT). Exports of 30,400 MT were down 6 percent from the previous week, but up 3 percent from the prior 4-week average. The destinations were primarily to Mexico (14,500 MT), Japan (4,600 MT), China (4,300 MT), South Korea (2,200 MT), and Canada (1,600 MT).
Terry Reilly
Senior Commodity Analyst – Grain and Oilseeds
Futures International
One Lincoln Center
18 W 140 Butterfield Rd.
Suite 1450
Oakbrook Terrace, Il. 60181
W: 312.604.1366
ICE IM: treilly1
Skype: fi.treilly

Trading of futures, options, swaps and other derivatives is risky and is not suitable for all persons. All of these investment products are leveraged, and you can lose more than your initial deposit. Each investment product is offered only to and from jurisdictions where solicitation and sale are lawful, and in accordance with applicable laws and regulations in such jurisdiction. The information provided here should not be relied upon as a substitute for independent research before making your investment decisions. Futures International, LLC is merely providing this information for your general information and the information does not take into account any particular individual’s investment objectives, financial situation, or needs. All investors should obtain advice based on their unique situation before making any investment decision. The contents of this communication and any attachments are for informational purposes only and under no circumstances should they be construed as an offer to buy or sell, or a solicitation to buy or sell any future, option, swap or other derivative. The sources for the information and any opinions in this communication are believed to be reliable, but Futures International, LLC does not warrant or guarantee the accuracy of such information or opinions. Futures International, LLC and its principals and employees may take positions different from any positions described in this communication. Past results are not necessarily indicative of future results.