PDF attached
USDA Export Sales
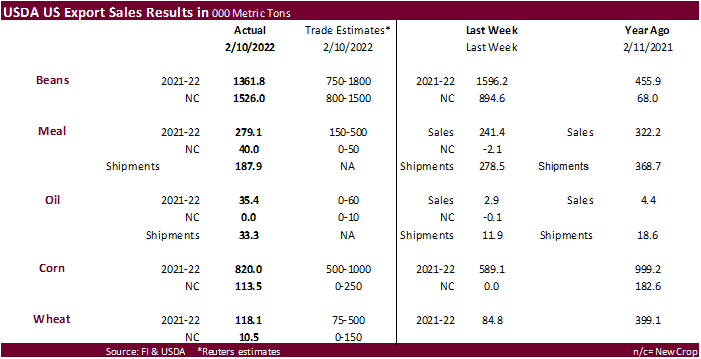
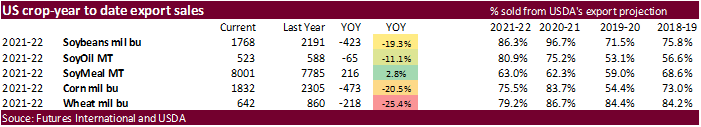
USDA Export Sales were all within expectations with exception of new-crop soybeans slightly topping the high end of a range. Year to date commitments for soybeans, corn, wheat, and soybean oil are still lagging year ago.
USDA export sales for soybeans of 1,361,800 MT included unknown destinations (371,700 MT), China (224,500 MT, including decreases of 2,300 MT), and the Netherlands (188,300 MT, including 112,600 MT switched from unknown destinations). New crop sales were a large 1,526,000 MT and included China (876,000 MT), unknown destinations (530,000 MT), and Egypt (106,000 MT). Soybean meal sales were 279,100 MT and included the Philippines, Ecuador and Morocco. Shipments were 187,900 tons. Soybean oil sales of 35,400 significantly improved and were highest since December 16. That included the 30,000 ton unknow sale we though was for India. Shipments were 33,300 tons, also excellent.
CBOT corn export sales of 820,000 tons for 2021-22 and 113,500 tons for new-crop were within expectations. Japan and Mexico were largest buyers for both crop years. China was not mentioned in the text. Sorghum sales of 148,400 MT for 2021-22 were up 5 percent from the previous week, but down 42 percent from the prior 4-week average. Increases reported for China (208,400 MT, including 65,000 MT switched from unknown destinations). Pork sales of 18,300 MT for 2022 were down 46 percent from the prior 4-weekaverage.
All-wheat USDA export sales of 118,100 tons were within expectations but still very low for this time of year. The slowdown in wheat commitments (past three weeks) has increased the gap from year to date commitments of 642 million bushels against previous year of 860 million, down 25 percent.
U.S. EXPORT SALES FOR WEEK ENDING 2/10/2022
|
|
CURRENT MARKETING YEAR |
NEXT MARKETING YEAR |
||||||
|
COMMODITY |
NET SALES |
OUTSTANDING SALES |
WEEKLY EXPORTS |
ACCUMULATED EXPORTS |
NET SALES |
OUTSTANDING SALES |
||
|
CURRENT YEAR |
YEAR AGO |
CURRENT YEAR |
YEAR AGO |
|||||
|
|
THOUSAND METRIC TONS |
|||||||
|
WHEAT |
|
|
|
|
|
|
|
|
|
HRW |
72.1 |
1,825.4 |
1,430.9 |
183.3 |
5,140.9 |
6,448.1 |
0.0 |
67.8 |
|
SRW |
14.2 |
610.9 |
439.0 |
55.7 |
1,963.4 |
1,264.0 |
10.5 |
135.6 |
|
HRS |
25.0 |
1,119.6 |
2,057.9 |
87.8 |
3,554.0 |
4,906.5 |
0.0 |
61.0 |
|
WHITE |
5.7 |
618.3 |
2,476.4 |
84.9 |
2,464.0 |
3,715.8 |
0.0 |
67.0 |
|
DURUM |
1.0 |
55.6 |
172.2 |
0.0 |
113.1 |
492.9 |
0.0 |
47.0 |
|
TOTAL |
118.1 |
4,229.8 |
6,576.3 |
411.6 |
13,235.3 |
16,827.5 |
10.5 |
378.4 |
|
BARLEY |
0.0 |
13.8 |
12.6 |
0.0 |
14.7 |
20.0 |
0.0 |
0.0 |
|
CORN |
820.0 |
24,199.8 |
35,584.7 |
1,617.6 |
22,332.7 |
22,969.6 |
113.5 |
1,565.5 |
|
SORGHUM |
148.4 |
4,119.3 |
3,094.1 |
141.6 |
2,385.7 |
2,837.0 |
-53.0 |
0.0 |
|
SOYBEANS |
1,361.8 |
9,311.7 |
9,178.4 |
1,213.0 |
38,809.9 |
50,460.9 |
1,526.0 |
4,499.3 |
|
SOY MEAL |
279.1 |
3,317.8 |
2,913.2 |
187.9 |
4,683.3 |
4,871.8 |
40.0 |
174.7 |
|
SOY OIL |
35.4 |
171.5 |
193.1 |
33.3 |
351.5 |
395.0 |
0.0 |
0.0 |
|
RICE |
|
|
|
|
|
|
|
|
|
L G RGH |
12.2 |
299.3 |
271.9 |
19.6 |
728.0 |
899.3 |
0.0 |
0.0 |
|
M S RGH |
0.0 |
9.4 |
11.7 |
0.2 |
4.3 |
17.2 |
0.0 |
0.0 |
|
L G BRN |
0.5 |
19.9 |
13.1 |
0.5 |
29.1 |
23.6 |
0.0 |
0.0 |
|
M&S BR |
0.0 |
45.1 |
97.3 |
22.4 |
40.4 |
54.4 |
0.0 |
0.0 |
|
L G MLD |
10.6 |
76.2 |
88.0 |
18.1 |
483.6 |
356.4 |
0.0 |
0.0 |
|
M S MLD |
0.7 |
179.2 |
223.5 |
1.6 |
217.8 |
282.1 |
0.0 |
0.0 |
|
TOTAL |
24.0 |
629.2 |
705.5 |
62.4 |
1,503.2 |
1,633.0 |
0.0 |
0.0 |
|
COTTON |
|
THOUSAND RUNNING BALES |
||||||
|
UPLAND |
158.5 |
7,861.6 |
5,700.8 |
270.0 |
4,472.8 |
7,460.1 |
34.7 |
1,844.5 |
|
PIMA |
3.1 |
197.6 |
276.0 |
4.6 |
205.3 |
412.8 |
0.0 |
12.6 |
This summary is based on reports from exporters for the period February 4-10, 2022.
Wheat: Net sales of 118,100 metric tons (MT) for 2021/2022 were up 39 percent from the previous week, but down 61 percent from the prior 4-week average. Increases primarily for Guatemala (38,300 MT switched from unknown destinations), Mexico (28,100 MT), Japan (26,000 MT), Colombia (18,500 MT), and El Salvador (8,200 MT switched from unknown destinations), were offset by reductions for unknown destinations (21,500 MT). Total net sales for 2022/2023 of 10,500 MT were for Peru. Exports of 411,600 MT were up 8 percent from the previous week and 9 percent from the prior 4-week average. The destinations were primarily to Mexico (93,800 MT), Taiwan (67,900 MT), the Philippines (62,900 MT), Thailand (57,700 MT), and Japan (43,400 MT).
Corn: Net sales of 820,000 MT for 2021/2022 were up 39 percent from the previous week, but down 23 percent from the prior 4-week average. Increases primarily for Japan (600,200 MT, including 175,000 MT switched from unknown destinations and decreases of 700 MT), Mexico (103,300 MT, including decreases of 38,600 MT), Canada (45,600 MT), the Dominican Republic (40,000 MT), and Colombia (32,500 MT, including decreases of 32,000 MT), were offset by reductions primarily for unknown destinations (68,900 MT). Net sales of 113,500 MT for 2022/2023 were reported for Mexico (90,000 MT) and Japan (23,500 MT). Exports of 1,617,600 MT–a marketing-year high–were up 41 percent from the previous week and 28 percent from the prior 4-week average. The destinations were primarily to Mexico (477,300 MT, including 136,300 MT – late), China (413,600 MT), Japan (291,700 MT), Canada (114,200 MT), and Colombia (64,500 MT).
Optional Origin Sales: For 2021/2022, new optional origin sales of 65,000 MT were reported for unknown destinations. Options were reported for exercised to export 60,000 MT to unknown destinations from the United States. The current outstanding balance of 220,800 MT is for unknown destinations (115,000 MT), South Korea (65,000 MT), Italy (31,800 MT), and Saudi Arabia (9,000 MT). For 2022/2023, new optional origin sales of 2,400 MT were reported for Italy. The current outstanding balance of 3,900 MT is for Italy.
Late Reporting: For 2021/2022, exports totaling 136,300 MT of corn were reported late to Mexico.
Barley: No net sales or exports were reported for the week.
Sorghum: Net sales of 148,400 MT for 2021/2022 were up 5 percent from the previous week, but down 42 percent from the prior 4-week average. Increases reported for China (208,400 MT, including 65,000 MT switched from unknown destinations) and Mexico (5,000 MT), were offset by reductions for unknown destinations (65,000 MT). Total net sales reductions for 2022/2023 of 53,000 MT were for China. Exports of 141,600 MT were down 10 percent from the previous week, but up 15 percent from the prior 4-week average. The destinations were to China (140,500 MT) and Mexico (1,100 MT).
Rice: Net sales of 24,000 MT for 2021/2022 were down 88 percent from the previous week and 80 percent from the prior 4-week average. Increases primarily for Haiti (7,300 MT), Mexico (7,000 MT, including decreases of 600 MT), Costa Rica (5,000 MT), Canada (1,800 MT), and Jordan (1,700 MT), were offset by reductions for Taiwan (300 MT) and Honduras (300 MT). Exports of 62,400 MT were down 12 percent from the previous week, but up 12 percent from the prior 4-week average. The destinations were primarily to South Korea (22,200 MT), Haiti (15,300 MT), Honduras (11,700 MT), Costa Rica (5,500 MT), and Mexico (3,300 MT).
Exports for Own Account: For 2021/2022, the current exports for own account outstanding balance is 100 MT, all Canada.
Soybeans: Net sales of 1,361,800 MT for 2021/2022 were down 15 percent from the previous week, but up 26 percent from the prior 4-week average. Increases primarily for unknown destinations (371,700 MT), China (224,500 MT, including decreases of 2,300 MT), the Netherlands (188,300 MT, including 112,600 MT switched from unknown destinations), Spain (121,500 MT, including 51,000 MT switched from unknown destinations), and Indonesia (94,500 MT, including 55,000 MT switched from unknown destinations, 200 MT switched from Vietnam, and decreases of 3,300 MT), were offset by reductions for Costa Rica (400 MT). Net sales of 1,526,000 MT for 2022/2023 were reported for China (876,000 MT), unknown destinations (530,000 MT), Egypt (106,000 MT), Mexico (10,000 MT), and Taiwan (4,000 MT). Exports of 1,213,000 MT were down 7 percent from the previous week and 19 percent from the prior 4-week average. The destinations were primarily to China (575,700 MT), the Netherlands (122,300 MT), Mexico (120,600 MT), Taiwan (68,800 MT), and Germany (66,000 MT).
Export for Own Account: For 2021/2022, the current exports for own account outstanding balance is 3,000 MT, all Canada.
Export Adjustment: Accumulated exports of soybeans to the Netherlands were adjusted down 65,997 MT for week ending January 27th. The correct destination for this shipment is Germany.
Soybean Cake and Meal: Net sales of 279,100 MT for 2021/2022 were up 16 percent from the previous week, but down 25 percent from the prior 4-week average. Increases primarily for the Philippines (95,100 MT, including decreases of 600 MT), Ecuador (68,900 MT), Morocco (31,600 MT, including decreases of 400 MT), Canada (20,400 MT, including decreases of 400 MT), and Colombia (19,400 MT), were offset by reductions primarily for Ireland (40,000 MT). Total net sales of 40,000 MT for 2022/2023 were for Ireland. Exports of 187,900 MT were down 33 percent from the previous week and 34 percent from the prior 4-week average. The destinations were primarily to the Philippines (50,000 MT), Mexico (26,400 MT), Canada (21,300 MT), Guatemala (19,000 MT), and Honduras (17,800 MT).
Soybean Oil: Net sales of 35,400 MT for 2021/2022 were up noticeably from the previous week and from the prior 4-week average. Increases were primarily for unknown destinations (30,000 MT), Mexico (3,300 MT), Honduras (1,000 MT), and the Dominican Republic (800 MT). Exports of 33,300 MT were up noticeably from the previous week and up 18 percent from the prior 4-week average. The destinations were primarily to South Korea (17,300 MT), the Dominican Republic (9,000 MT), Venezuela (3,000 MT), Mexico (2,100 MT), and Colombia (1,500 MT).
Cotton: Net sales of 158,500 RB for 2021/2022 were down 14 percent from the previous week and 46 percent from the prior 4-week average. Increases primarily for China (47,800 RB), Pakistan (23,900 RB), Vietnam (23,800 RB, including, 5,900 RB switched from South Korea and 1,000 RB switched from Japan), Turkey (22,300 RB), and Peru (11,900 RB), were offset by reductions for South Korea (5,900 RB). Net sales of 34,700 RB for 2022/2023 were primarily for Pakistan (14,100 RB), Mexico (5,400 RB), Turkey (4,400 RB), Indonesia (3,500 RB), and Portugal (2,200 RB). Exports of 270,000 RB were down 10 percent from the previous week, but up 8 percent from the prior 4-week average. The destinations were primarily to China (117,000 RB), Pakistan (46,300 RB), Vietnam (33,000 RB), Turkey (20,200 RB), and Mexico (17,800 RB). Net sales of Pima totaling 3,100 RB were down 42 percent from the previous week and 40 percent from the prior 4-week average. Increases primarily for India (1,700 RB, including decreases of 900 RB), Peru (500 RB), China (400 RB), and Vietnam (400 RB), were offset by reductions for Greece (400 RB). Exports of 4,600 RB were down 78 percent from the previous week and 61 percent from the prior 4-week average. The destinations were primarily to China (2,100 RB), Thailand (600 RB), Bangladesh (500 RB), Peru (400 RB), and India (300 RB).
Optional Origin Sales: For 2021/2022, the current outstanding balance of 61,600 RB is for Vietnam (52,800 RB) and Pakistan (8,800 RB).
Exports for Own Account: For 2021/2022, the current exports for own account outstanding balance is 100 RB, all Vietnam.
Hides and Skins: Net sales of 434,800 pieces for 2022 were up 60 percent from the previous week and 2 percent from the prior 4-week average. Increases primarily for China (219,300 whole cattle hides, including decreases of 13,600 pieces), South Korea (89,400 whole cattle hides, including decreases of 1,200 pieces), Mexico (44,000 whole cattle hides, including decreases of 500 pieces), Brazil (27,200 whole cattle hides, including decreases of 100 pieces), and Thailand (21,500 whole cattle hides, including decreases of 1,200 pieces), were offset by reductions primarily for Italy (6,600 pieces). Total net sales of 1,800 calf skins were for Italy. In addition, total net sales of 5,600 kip skins were for Italy. Exports of 415,000 pieces were up 28 percent from the previous and 12 percent from the prior 4-week average. Whole cattle hides exports were primarily to China (269,800 pieces), South Korea (52,100 pieces), Mexico (29,200 pieces), Thailand (15,800 pieces), and Indonesia (13,900 pieces).
Net sales of 151,900 wet blues for 2022 were up noticeably from the previous week and up 6 percent from the prior 4-week average. Increases were primarily for Italy (30,800 unsplit, 12,700 grain splits, including decreases of 200 unsplit and 200 grain splits), Vietnam (36,800 unsplit, including decreases of 100 unsplit), China (32,000 unsplit), India (10,800 grain splits), and Mexico (10,300 unsplit). Exports of 167,700 wet blues were up noticeably from the previous and up 19 percent from the prior 4-week average. The destinations were primarily to China (52,100 unsplit), Vietnam (45,800 unsplit), Italy (29,400 unsplit and 11,700 grain splits), Thailand (10,900 unsplit), and Mexico (4,200 grain splits and 2,800 unsplit). Net sales of 37,800 splits were reported for Vietnam (32,800 pounds), South Korea (2,500 pounds, including decreases of 6,900 pounds), and China (2,500 pounds). Exports of 449,000 pounds were to Vietnam (320,000 pounds) and China (129,000 pounds).
Beef: Net sales of 23,000 MT for 2022 were up 18 percent from the previous week and 38 percent from the prior 4-week average. Increases were primarily for South Korea (10,100 MT, including decreases of 600 MT), Japan (7,200 MT, including decreases of 200 MT), Canada (1,600 MT, including decreases of 200 MT), Mexico (1,200 MT, including decreases of 100 MT), and China (600 MT, including decreases of 1,100 MT). Exports of 16,500 MT were up 13 percent from the previous week and 10 percent from the prior 4-week average. The destinations were primarily to South Korea (4,900 MT), Japan (4,300 MT), China (2,400 MT), Taiwan (1,400 MT), and Mexico (1,200 MT).
Pork: Net sales of 18,300 MT for 2022 were up 1 percent from the previous week, but down 46 percent from the prior 4-week average. Increases were primarily for Mexico (4,800 MT, including decreases of 900 MT), South Korea (3,400 MT, including decreases of 400 MT), Japan (3,300 MT, including decreases of 1,100 MT), Canada (2,400 MT, including decreases of 400 MT), and the Dominican Republic (1,600 MT). Exports of 31,000 MT were up 2 percent from the previous week, but unchanged from the prior 4-week average. The destinations were primarily to Mexico (14,200 MT), Japan (4,900 MT), China (3,500 MT), South Korea (2,600 MT), and Canada (1,700 MT).
Terry Reilly
Senior Commodity Analyst – Grain and Oilseeds
Futures International
One Lincoln Center
18 W 140 Butterfield Rd.
Oakbrook Terrace, Il. 60181
W: 312.604.1366
ICE IM: treilly1
Skype: fi.treilly

Trading of futures, options, swaps and other derivatives is risky and is not suitable for all persons. All of these investment products are leveraged, and you can lose more than your initial deposit. Each investment product is offered only to and from jurisdictions where solicitation and sale are lawful, and in accordance with applicable laws and regulations in such jurisdiction. The information provided here should not be relied upon as a substitute for independent research before making your investment decisions. Futures International, LLC is merely providing this information for your general information and the information does not take into account any particular individual’s investment objectives, financial situation, or needs. All investors should obtain advice based on their unique situation before making any investment decision. The contents of this communication and any attachments are for informational purposes only and under no circumstances should they be construed as an offer to buy or sell, or a solicitation to buy or sell any future, option, swap or other derivative. The sources for the information and any opinions in this communication are believed to be reliable, but Futures International, LLC does not warrant or guarantee the accuracy of such information or opinions. Futures International, LLC and its principals and employees may take positions different from any positions described in this communication. Past results are not necessarily indicative of future results.