PDF attached
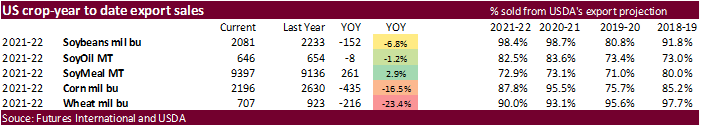
USDA export sales were on the lighter side for old crop soybeans, soybean oil and wheat. Corn export sales were within expectations and soybean meal increased from the previous week. Sorghum sales were a poor 8,500 tons. Pork sales were 24,000 tons. China posted 671,500 tons for old crop corn and 408,000 tons for new-crop, in line with USDA 24-hour sales announcements. China booked a more than expected 435,500 tons of old crop soybeans, but 121,000 tons of that was switched from unknown and a cargo switched from Vietnam. China also booked 267,000 tons of new crop soybeans and 120,000 tons 2022-23 was posted for unknown. Crop year to date soybean sales are running 7 percent below this time year ago.
U.S. EXPORT SALES FOR WEEK ENDING 4/7/2022
|
|
CURRENT MARKETING YEAR |
NEXT MARKETING YEAR |
||||||
|
COMMODITY |
NET SALES |
OUTSTANDING SALES |
WEEKLY EXPORTS |
ACCUMULATED EXPORTS |
NET SALES |
OUTSTANDING SALES |
||
|
CURRENT YEAR |
YEAR |
CURRENT YEAR |
YEAR |
|||||
|
|
THOUSAND METRIC TONS |
|||||||
|
WHEAT |
|
|
|
|
|
|
|
|
|
HRW |
1.2 |
1,334.1 |
1,146.3 |
118.4 |
6,214.4 |
7,400.3 |
99.8 |
503.8 |
|
SRW |
61.6 |
487.1 |
259.3 |
33.5 |
2,347.8 |
1,512.5 |
52.0 |
509.0 |
|
HRS |
28.9 |
816.9 |
1,251.1 |
146.7 |
4,504.1 |
6,270.3 |
48.3 |
539.4 |
|
WHITE |
4.2 |
438.6 |
1,606.9 |
41.6 |
2,905.7 |
5,010.0 |
25.1 |
286.3 |
|
DURUM |
0.2 |
15.5 |
78.1 |
0.2 |
174.1 |
594.5 |
0.0 |
64.4 |
|
TOTAL |
96.1 |
3,092.2 |
4,341.7 |
340.4 |
16,146.1 |
20,787.6 |
225.2 |
1,902.8 |
|
BARLEY |
0.1 |
5.8 |
5.0 |
0.0 |
14.7 |
24.2 |
0.0 |
8.6 |
|
CORN |
1,332.9 |
20,395.9 |
29,023.5 |
1,560.2 |
35,373.5 |
37,787.3 |
403.1 |
2,973.8 |
|
SORGHUM |
8.5 |
2,538.3 |
2,193.0 |
142.2 |
4,219.8 |
4,850.7 |
0.0 |
0.0 |
|
SOYBEANS |
548.9 |
11,507.4 |
5,264.6 |
806.5 |
45,128.2 |
55,498.0 |
458.0 |
8,921.3 |
|
SOY MEAL |
174.9 |
2,961.7 |
2,220.4 |
128.8 |
6,435.0 |
6,915.2 |
6.0 |
343.4 |
|
SOY OIL |
6.1 |
145.2 |
106.2 |
3.0 |
500.4 |
547.3 |
0.0 |
0.0 |
|
RICE |
|
|
|
|
|
|
|
|
|
L G RGH |
21.9 |
179.3 |
298.3 |
1.8 |
1,002.7 |
1,125.2 |
0.0 |
0.0 |
|
M S RGH |
0.0 |
2.7 |
5.3 |
0.5 |
11.4 |
23.5 |
0.0 |
0.0 |
|
L G BRN |
0.1 |
6.1 |
3.1 |
10.5 |
44.2 |
34.7 |
0.0 |
0.0 |
|
M&S BR |
0.1 |
23.9 |
68.6 |
20.1 |
62.6 |
85.7 |
0.0 |
0.0 |
|
L G MLD |
26.2 |
83.7 |
65.2 |
11.7 |
604.4 |
458.9 |
0.0 |
0.0 |
|
M S MLD |
1.8 |
237.0 |
252.1 |
2.7 |
265.8 |
392.9 |
0.0 |
0.0 |
|
TOTAL |
50.1 |
532.8 |
692.7 |
47.3 |
1,991.0 |
2,121.0 |
0.0 |
0.0 |
|
COTTON |
|
THOUSAND RUNNING BALES |
||||||
|
UPLAND |
59.3 |
6,906.6 |
4,812.7 |
333.8 |
7,412.8 |
10,156.5 |
132.0 |
2,660.5 |
|
PIMA |
2.1 |
134.5 |
220.1 |
18.1 |
312.9 |
529.8 |
4.1 |
34.6 |
This summary is based on reports from exporters for the period April 1-7, 2022.
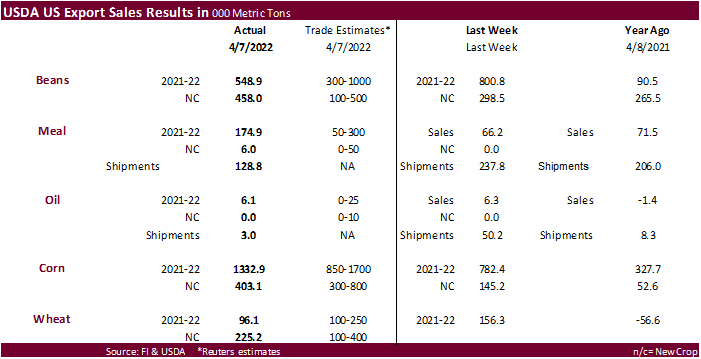
Wheat: Net sales of 96,100 metric tons (MT) for 2021/2022 were down 39 percent from the previous week and 30 percent from the prior 4-week average. Increases primarily for Mexico (56,500 MT, including decreases of 3,400 MT), Panama (25,400 MT, including 24,300 MT switched from El Salvador and 400 MT switched from Costa Rica), Nigeria (14,000 MT, including decreases of 46,000 MT), Guatemala (12,600 MT, including 7,000 MT switched from Nicaragua), and South Korea (9,500 MT), were offset by reductions primarily for El Salvador (24,300 MT) and unknown destinations (24,000 MT). Net sales of 225,200 MT for 2022/2023 were primarily for Mexico (62,300 MT), Japan (60,000 MT), Honduras (31,000 MT), unknown destinations (30,000 MT), and South Korea (25,900 MT). Exports of 340,400 MT were up 10 percent from the previous week and 7 percent from the prior 4-week average. The destinations were primarily to the Philippines (65,300 MT), Japan (59,500 MT), Mexico (47,900 MT), Guatemala (42,300 MT), and Panama (25,400 MT).
Corn: Net sales of 1,332,900 MT for 2021/2022 were up 70 percent from the previous week and 26 percent from the prior 4-week average. Increases primarily for China (671,500 MT, including decreases of 4,500 MT), Mexico (418,800 MT, including decreases of 33,300 MT), South Korea (151,000 MT, including 152,000 MT switched from unknown destinations and decreases of 3,400 MT), Colombia (108,500 MT, including 92,000 MT switched from unknown destinations and decreases of 1,400 MT), and Canada (43,100 MT, including decreases of 1,700 MT), were offset by reductions primarily for unknown destinations (226,200 MT). Net sales of 403,100 MT for 2022/2023 resulting in increases of China (408,000 MT), were offset by Canada (4,900 MT). Exports of 1,560,200 MT were down 5 percent from the previous week and 1 percent from the prior 4-week average. The destinations were primarily to China (471,500 MT), Mexico (399,100 MT), Japan (153,700 MT), Colombia (133,600 MT), and Canada (121,000 MT).
Optional Origin Sales: For 2021/2022, the current outstanding balance of 533,300 MT is for unknown destinations (365,000 MT), South Korea (65,000 MT), Morocco (60,000 MT), Italy (34,300 MT), and Saudi Arabia (9,000 MT). For 2022/2023, the current outstanding balance of 6,400 MT is for Italy.
Barley: Total net sales of 100 MT for 2021/2022 were unchanged from the previous week, but down noticeably from the prior 4-week average. The destination was South Korea. No exports were reported for the week.
Sorghum: Net sales of 8,500 MT for 2021/2022 were down noticeably from the previous week and down 55 percent from the prior 4-week average. Increases reported for China (136,700 MT, including 133,000 MT switched from unknown destinations), Mexico (3,800 MT), and Haiti (1,000 MT), were offset by reductions for unknown destinations (133,000 MT). Exports of 142,200 MT were down 40 percent from the previous week and 48 percent from the prior 4-week average. The destinations were to China (142,100 MT) and Mexico (100 MT).
Rice: Net sales of 50,100 MT for 2021/2022 were up noticeably from the previous week and up 33 percent from the prior 4-week average. Increases primarily for Colombia (15,300 MT), Costa Rica (15,000 MT), Saudi Arabia (8,700 MT, including decreases of 500 MT), El Salvador (4,400 MT, including decreases of 100 MT), and Mexico (3,300 MT), were offset by reductions for Guatemala (500 MT), Nicaragua (100 MT), and the United Kingdom (100 MT). Exports of 47,300 MT were down 41 percent from the previous week and 14 percent from the prior 4-week average. The destinations were primarily to South Korea (20,000 MT), the United Kingdom (9,900 MT), Saudi Arabia (9,200 MT), Mexico (3,300 MT), and Canada (2,700 MT).
Exports for Own Account: For 2021/2022, new exports for own account totaling 100 MT were to Canada. Exports of 100 MT to Canada were applied to new or outstanding sales.
Soybeans: Net sales of 548,900 MT for 2021/2022 were down 31 percent from the previous week and 41 percent from the prior 4-week average. Increases primarily for China (435,500 MT, including 121,000 MT switched from unknown destinations, 55,000 MT switched from Vietnam, and decreases of 13,600 MT), Germany (56,000 MT), the Netherlands (49,600 MT, including 45,500 MT switched from unknown destinations), Japan (38,500 MT, including 9,500 MT switched from unknown destinations), and South Korea (26,100 MT, including 25,000 MT switched from unknown destinations and decreases of 200 MT), were offset by reductions for unknown destinations (67,900 MT), Vietnam (55,800 MT), and Italy (600 MT). Net sales of 458,000 MT for 2022/2023 were reported for China (267,000 MT), unknown destinations (120,000 MT), Egypt (58,000 MT), Malaysia (10,000 MT), and Taiwan (3,000 MT). Exports of 806,500 MT were down 3 percent from the previous week, but up 19 percent from the prior 4-week average. The destinations were primarily to China (415,300 MT), Mexico (57,100 MT), Germany (56,000 MT), Egypt (52,900 MT), and the Netherlands (49,600 MT).
Export for Own Account: For 2021/2022, the current exports for own account outstanding balance is 3,000 MT, all Canada.
Export Adjustment: Accumulated exports of soybeans to the Netherlands were adjusted down 56,024 MT for week ending March 24th. The correct destination for this shipment is Germany.
Soybean Cake and Meal: Net sales of 174,900 MT for 2021/2022 were up noticeably from the previous week and up 21 percent from the prior 4-week average. Increases primarily for Venezuela (45,000 MT), the Philippines (43,900 MT, including decreases of 1,700 MT), Mexico (19,800 MT, including decreases of 8,200 MT), Colombia (19,200 MT, including decreases of 10,600 MT), and Ireland (12,000 MT), were offset by reductions for Guatemala (1,500 MT), Saudi Arabia (1,300 MT), the Dominican Republic (400 MT), and El Salvador (100 MT). Total net sales of 6,000 MT for 2022/2023 were for Canada. Exports of 128,800 MT–a marketing-year low–were down 46 percent from the previous week and 40 percent from the prior 4-week average. The destinations were primarily to Colombia (31,700 MT), Saudi Arabia (28,700 MT), Canada (25,900 MT), Mexico (24,600 MT), and the Dominican Republic (6,600 MT).
Late Reporting: For 2021/2022, net sales totaling 1,200 MT of soybean meal was reported late. The destination was Taiwan.
Soybean Oil: Net sales of 6,100 MT for 2021/2022 were down 2 percent from the previous week and 58 percent from the prior 4-week average. Increases primarily for Venezuela (4,000 MT), were offset by reductions for Canada (600 MT). Exports of 3,000 were down 94 percent from the previous week and 87 percent from the prior 4-week average. The destinations were primarily to Mexico (2,300 MT).
Cotton: Net sales of 59,300 RB for 2021/2022–a marketing-year low–were down 6 percent from the previous week and 76 percent from the prior 4-week average. Increases primarily for Turkey (27,100 RB), India (24,400 RB, including decreases of 16,100 RB), Indonesia (6,700 RB, including 200 RB switched from Japan), Vietnam (6,200 RB, including 900 RB switched from South Korea), and Peru (6,200 RB), were offset by reductions for China (24,800 RB) and South Korea (1,700 RB). Net sales of 132,000 RB for 2022/2023 were primarily for Mexico (62,700 RB), Turkey (17,600 RB), Peru (13,200 RB), Guatemala (11,400 RB), and South Korea (7,900 RB). Exports of 333,800 RB were down 27 percent from the previous week and 14 percent from the prior 4-week average. The destinations were primarily to China (122,700 RB), Pakistan (43,800 RB), Turkey (37,400 RB), Vietnam (32,700 RB), and Mexico (20,700 RB). Net sales of Pima totaling 2,100 RB were down 68 percent from the previous week and 71 percent from the prior 4-week average. Increases were primarily for Pakistan (900 RB), Indonesia (900 RB), and Colombia (200 RB). Net sales of 4,100 RB for 2022/2023 were reported for India (4,000 RB) and Japan (100 RB). Exports of 18,100 RB were up 49 percent from the previous week and 92 percent from the prior 4-week average. The destinations were primarily to India (5,500 RB), Peru (4,400 RB), China (3,600 RB), Honduras (1,700 RB), and Vietnam (700 RB).
Optional Origin Sales: For 2021/2022, the current outstanding balance of 57,200 RB is for Vietnam (52,800 RB) and Pakistan (4,400 RB).
Exports for Own Account: For 2021/2022, the current exports for own account outstanding balance is 100 RB, all Vietnam.
Hides and Skins: Net sales of 413,300 pieces for 2022 were down 9 percent from the previous week and 1 percent from the prior 4-week average. Increases primarily for China (193,600 whole cattle hides, including decreases of 34,600 pieces), Mexico (96,500 whole cattle hides, including decreases of 900 pieces), South Korea (71,200 whole cattle hides, including decreases of 2,100 pieces), Italy (20,600 whole cattle hides, including decreases of 300 pieces), and Indonesia (11,900 whole cattle hides, including decreases of 200 pieces), were offset by reductions for Brazil (200 pieces), Taiwan (200 pieces), Spain (100 pieces), and Germany (100 pieces). Exports of 593,300 pieces were up 26 percent from the previous week and from the prior 4-week average. Whole cattle hides exports were primarily to China (375,000 pieces), South Korea (90,600 pieces), Thailand (40,400 pieces), Mexico (37,700 pieces), and Italy (14,000 pieces).
Net sales of 79,800 wet blues for 2022 were down 7 percent from the previous week and 39 percent from the prior 4-week average. Increases reported for Thailand (23,300 unsplit), Italy (17,500 unsplit and 4,400 grain splits, including decreases of 100 unsplit and 100 grain splits), China (16,700 unsplit, including decreases of 200 unsplit), Vietnam (9,600 unsplit), and India (4,800 unsplit and 2,400 splits), were offset by reductions for Portugal (100 unsplit) and Hong Kong (100 unsplit). Total net sales reductions of 1,000 wet blues for 2023 were for Mexico. Exports of 166,400 wet blues were down 18 percent from the previous week and 5 percent from the prior 4-week average. The destinations were primarily to Italy (40,600 unsplit and 21,600 grain splits), China (38,400 unsplit), Vietnam (34,800 unsplit), Hong Kong (9,900 unsplit), and Thailand (6,500 unsplit). Net sales reductions of 19,900 splits were down noticeably from the previous week and from the prior 4-week average. Reductions were reported for South Korea (11,400 pounds) and Vietnam (8,500 pounds). Exports of 771,200 pounds were up 5 percent from the previous week and 43 percent from the prior 4-week average. The destinations were to Vietnam (566,100 pounds), South Korea (161,400 pounds), and China (43,700 pounds).
Beef: Net sales of 17,200 MT for 2022 were up 23 percent from the previous week, but down18 percent from the prior 4-week average. Increases were for South Korea (7,500 MT, including decreases of 500 MT), Japan (4,200 MT, including decreases of 600 MT), Canada (1,300 MT, including decreases of 100 MT), Mexico (1,200 MT), and Hong Kong (600 MT). Total net sales of 100 MT for 2022/2023 were for Canada. Exports of 18,600 MT were down 4 percent from the previous week and 24 percent from the prior 4-week average. The destinations were primarily to South Korea (5,800 MT), Japan (4,600 MT), China (3,000 MT), Taiwan (1,400 MT), and Mexico (900 MT).
Pork: Net sales of 24,000 MT for 2022 were down 42 percent from the previous week and 26 percent from the prior 4-week average. Increases were primarily for Mexico (6,100 MT, including decreases of 500 MT), Japan (5,400 MT, including decreases of 200 MT), China (4,000 MT, including decreases of 200 MT), South Korea (2,600 MT, including decreases of 300 MT), and Australia (1,900 MT). Exports of 31,800 MT were up 10 percent from the previous week and 11 percent from the prior 4-week average. The destinations were primarily to Mexico (14,200 MT), Japan (4,700 MT), China (4,300 MT), South Korea (2,900 MT), and the Dominican Republic (1,100 MT).
Terry Reilly
Senior Commodity Analyst – Grain and Oilseeds
Futures International
One Lincoln Center
18 W 140 Butterfield Rd.
Oakbrook Terrace, Il. 60181
W: 312.604.1366
ICE IM: treilly1
Skype: fi.treilly

Trading of futures, options, swaps and other derivatives is risky and is not suitable for all persons. All of these investment products are leveraged, and you can lose more than your initial deposit. Each investment product is offered only to and from jurisdictions where solicitation and sale are lawful, and in accordance with applicable laws and regulations in such jurisdiction. The information provided here should not be relied upon as a substitute for independent research before making your investment decisions. Futures International, LLC is merely providing this information for your general information and the information does not take into account any particular individual’s investment objectives, financial situation, or needs. All investors should obtain advice based on their unique situation before making any investment decision. The contents of this communication and any attachments are for informational purposes only and under no circumstances should they be construed as an offer to buy or sell, or a solicitation to buy or sell any future, option, swap or other derivative. The sources for the information and any opinions in this communication are believed to be reliable, but Futures International, LLC does not warrant or guarantee the accuracy of such information or opinions. Futures International, LLC and its principals and employees may take positions different from any positions described in this communication. Past results are not necessarily indicative of future results.