PDF attached
USDA Export Sales
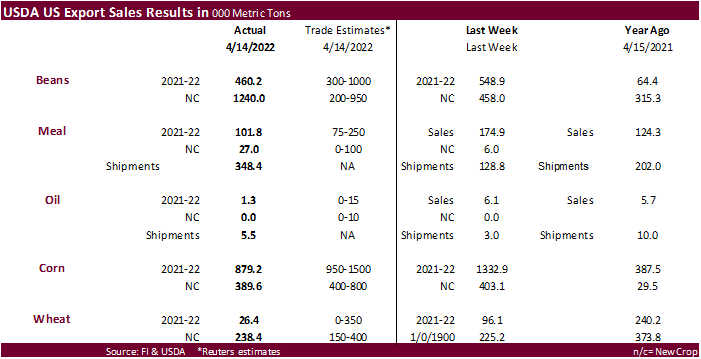
While USDA soybean 2021-22 sales came in at a low 460,200 tons, new crop was above expectations at 1.240 million tons. Old crop soybean sales included increases for China (496,400 MT, including 66,000 MT switched from unknown destinations and decreases of 5,000 MT), Indonesia (81,000 MT, including 55,000 MT switched from unknown destinations and decreases of 100 MT), Bangladesh (57,000 MT, including 55,000 MT switched from unknown destinations), and Egypt (53,700 MT, including decreases of 1,300MT). 2022-23 soybean sales included China (669,000 MT), unknown destinations (351,000 MT), and Spain (131,000 MT).
Soybean meal sales were near the lower end of expectations, but shipments were ok at 348,400 tons. Soybean oil sales were poor at 1,300 tons and shipments were 5,500 tons.
USDA corn export sales were 879,200 tons old crop and 389,600 tons new crop. 2021-22 included China (675,200 MT, including decreases of5,600 MT), South Korea (126,200 MT, including 68,000 MT switched from unknown destinations and decreases of 6,800 MT), and Mexico (75,500 MT, including decreases of 34,600 MT). 340,000 tons of new crop were booked by China. USDA sorghum export sales were a net reduction of 53,600 tons for 2021-22. Increases reported for China (11,400 MT, including decreases of 2,100MT), were more than offset by reductions for unknown destinations (65,000MT). Pork sales were 12,900 tons and didn’t include China.
All-wheat export sales were a low 26,400 tons old crop. New crop were 238,400 tons, low for this time of year.
U.S. EXPORT SALES FOR WEEK ENDING 4/14/2022
|
|
CURRENT MARKETING YEAR |
NEXT MARKETING YEAR |
||||||
|
COMMODITY |
NET SALES |
OUTSTANDING SALES |
WEEKLY EXPORTS |
ACCUMULATED EXPORTS |
NET SALES |
OUTSTANDING SALES |
||
|
CURRENT YEAR |
YEAR AGO |
CURRENT YEAR |
YEAR AGO |
|||||
|
|
THOUSAND METRIC TONS |
|||||||
|
WHEAT |
|
|
|
|
|
|
|
|
|
HRW |
-55.8 |
1,077.2 |
1,102.1 |
201.1 |
6,415.5 |
7,518.7 |
81.0 |
584.7 |
|
SRW |
17.4 |
414.6 |
245.6 |
89.9 |
2,437.8 |
1,528.9 |
78.0 |
587.0 |
|
HRS |
78.1 |
753.8 |
1,271.0 |
141.2 |
4,645.3 |
6,409.1 |
28.5 |
567.9 |
|
WHITE |
-13.7 |
353.4 |
1,332.7 |
71.4 |
2,977.1 |
5,296.9 |
50.9 |
337.2 |
|
DURUM |
0.4 |
15.5 |
69.7 |
0.4 |
174.4 |
594.9 |
0.0 |
64.4 |
|
TOTAL |
26.3 |
2,614.5 |
4,021.0 |
504.0 |
16,650.1 |
21,348.6 |
238.4 |
2,141.2 |
|
BARLEY |
0.0 |
5.8 |
4.5 |
0.0 |
14.7 |
24.7 |
0.0 |
8.6 |
|
CORN |
879.2 |
20,078.7 |
27,805.3 |
1,196.4 |
36,570.0 |
39,393.0 |
389.6 |
3,363.4 |
|
SORGHUM |
-53.6 |
2,203.9 |
1,943.8 |
280.8 |
4,500.6 |
5,107.0 |
0.0 |
0.0 |
|
SOYBEANS |
460.2 |
11,078.6 |
5,102.5 |
889.0 |
46,017.2 |
55,724.4 |
1,240.0 |
10,161.3 |
|
SOY MEAL |
101.8 |
2,715.0 |
2,142.7 |
348.4 |
6,783.4 |
7,117.2 |
27.0 |
370.4 |
|
SOY OIL |
1.2 |
141.0 |
101.9 |
5.5 |
505.9 |
557.2 |
0.0 |
0.0 |
|
RICE |
|
|
|
|
|
|
|
|
|
L G RGH |
32.7 |
202.0 |
319.9 |
10.0 |
1,012.7 |
1,183.3 |
0.0 |
0.0 |
|
M S RGH |
6.8 |
9.2 |
5.3 |
0.4 |
11.8 |
23.5 |
0.0 |
0.0 |
|
L G BRN |
0.3 |
6.1 |
3.0 |
0.3 |
44.5 |
35.2 |
0.0 |
0.0 |
|
M&S BR |
0.1 |
23.9 |
68.5 |
0.1 |
62.7 |
86.1 |
0.0 |
0.0 |
|
L G MLD |
20.3 |
93.9 |
52.7 |
10.2 |
614.5 |
483.7 |
0.0 |
0.0 |
|
M S MLD |
4.5 |
224.4 |
247.2 |
17.1 |
282.9 |
402.1 |
0.0 |
0.0 |
|
TOTAL |
64.7 |
559.4 |
696.5 |
38.1 |
2,029.1 |
2,214.0 |
0.0 |
0.0 |
|
COTTON |
|
THOUSAND RUNNING BALES |
||||||
|
UPLAND |
50.5 |
6,589.9 |
4,586.8 |
367.1 |
7,779.9 |
10,485.4 |
136.1 |
2,796.6 |
|
PIMA |
3.8 |
123.7 |
207.2 |
14.7 |
327.6 |
549.4 |
5.5 |
40.1 |
This summary is based on reports from exporters for the period April 8-14, 2022.
Wheat: Net sales of 26,300 metric tons (MT) for 2021/2022–a marketing-year low–were down 73 percent from the previous week and 79 percent from the prior 4-week average. Increases primarily for Mexico (90,500 MT, including decreases of 1,000 MT), Haiti (27,000 MT switched from unknown destinations), Ghana (26,000 MT switched from Nigeria), Cameroon (23,000 MT, including 20,000 MT switched from Nigeria), and Italy (15,000 MT), were offset by reductions primarily for Nigeria (131,000 MT). Net sales of 238,400 MT for 2022/2023 were primarily for Nigeria (86,000 MT), unknown destinations (75,000 MT), Japan (45,900 MT), Mexico (13,000 MT), and South Korea (9,500 MT). Exports of 504,000 MT were up 48 percent from the previous week and from the prior 4-week average. The destinations were primarily to Mexico (77,300 MT), Thailand (60,200 MT), Taiwan (57,100 MT), Guatemala (39,400 MT), and South Korea (38,500 MT).
Corn: Net sales of 879,200 MT for 2021/2022 were down 34 percent from the previous week and 6 percent from the prior 4-week average. Increases primarily for China (675,200 MT, including decreases of 5,600 MT), South Korea (126,200 MT, including 68,000 MT switched from unknown destinations and decreases of 6,800 MT), Mexico (75,500 MT, including decreases of 34,600 MT), Indonesia (67,200 MT, including 68,000 MT switched from unknown destinations and decreases of 800 MT), and Saudi Arabia (42,800 MT, including 40,000 MT switched from unknown destinations), were offset by reductions primarily for unknown destinations (234,000 MT). Net sales of 389,600 MT for 2022/2023 were reported for China (340,000 MT), Colombia (40,000 MT), Mexico (5,100 MT), and Canada (4,500 MT). Exports of 1,196,400 MT were down 23 percent from the previous week and 27 percent from the prior 4-week average. The destinations were primarily to China (402,400 MT), Mexico (275,900 MT), Japan (104,300 MT), Indonesia (67,200 MT), and South Korea (61,900 MT).
Optional Origin Sales: For 2021/2022, the current outstanding balance of 533,300 MT is for unknown destinations (365,000 MT), South Korea (65,000 MT), Morocco (60,000 MT), Italy (34,300 MT), and Saudi Arabia (9,000 MT). For 2022/2023, new optional origin sales of 52,000 MT were reported for Italy. The current outstanding balance of 58,400 MT is for Italy.
Barley: No net sales or exports were reported for the week.
Sorghum: Net sales reductions of 53,600 MT for 2021/2022–a marketing-year low–were down noticeably from the previous week, but up noticeably from the prior 4-week average. Increases reported for China (11,400 MT, including decreases of 2,100 MT), were more than offset by reductions for unknown destinations (65,000 MT). Exports of 280,800 MT were up 98 percent from the previous week and 15 percent from the prior 4-week average. The destinations was China.
Rice: Net sales of 64,700 MT for 2021/2022 were up 29 percent from the previous week and 63 percent from the prior 4-week average. Increases were primarily for Mexico (40,100 MT), Haiti (15,200 MT, including decreases of 100 MT), Canada (3,300 MT), Saudi Arabia (1,900 MT), and Jordan (1,800 MT). Exports of 38,100 MT were down 19 percent from the previous week and 27 percent from the prior 4-week average. The destinations were primarily to Japan (12,100 MT), Honduras (9,100 MT), Haiti (7,100 MT), Canada (3,700 MT), and Mexico (2,100 MT).
Soybeans: Net sales of 460,200 MT for 2021/2022 were down 16 percent from the previous week and 39 percent from the prior 4-week average. Increases primarily for China (496,400 MT, including 66,000 MT switched from unknown destinations and decreases of 5,000 MT), Indonesia (81,000 MT, including 55,000 MT switched from unknown destinations and decreases of 100 MT), Bangladesh (57,000 MT, including 55,000 MT switched from unknown destinations), Egypt (53,700 MT, including decreases of 1,300 MT), and Japan (51,600 MT, including 45,500 MT switched from unknown destinations and decreases of 2,600 MT), were offset by reductions for unknown destinations (326,300 MT) and Spain (66,000 MT). Net sales of 1,240,000 MT for 2022/2023 were primarily for China (669,000 MT), unknown destinations (351,000 MT), Spain (131,000 MT), the Netherlands (66,000 MT), and Mexico (20,000 MT). Exports of 889,000 MT were up 10 percent from the previous week and 27 percent from the prior 4-week average. The destinations were primarily to China (294,000 MT), Indonesia (109,700 MT), Mexico (102,300 MT), the Netherlands (84,200 MT), and Japan (67,600 MT).
Export for Own Account: For 2021/2022, the current exports for own account outstanding balance is 3,000 MT, all Canada.
Soybean Cake and Meal: Net sales of 101,800 MT for 2021/2022 were down 42 percent from the previous week and 33 percent from the prior 4-week average. Increases primarily for the Philippines (47,200 MT), Colombia (25,500 MT, including decreases of 1,100 MT), Mexico (21,600 MT), Canada (15,200 MT, including decreases of 1,100 MT), and El Salvador (6,400 MT switched from Guatemala), were offset by reductions primarily for Ireland (12,000 MT), unknown destinations (4,500 MT), Guatemala (4,100 MT), and Morocco (2,200 MT). Net sales of 27,000 MT for 2022/2023 were reported for Colombia (15,000 MT) and Ireland (12,000 MT). Exports of 348,400 MT were down noticeably from the previous week and down 88 percent from the prior 4-week average. The destinations were primarily to the Philippines (49,400 MT), Ecuador (47,000 MT), Mexico (44,600 MT), Vietnam (43,900 MT), and Colombia (25,500 MT).
Soybean Oil: Net sales of 1,200 MT for 2021/2022 were down 81 percent from the previous week and 88 percent from the prior 4-week average. Increases primarily for Guatemala (800 MT), were offset by reductions for Mexico (300 MT). Exports of 5,500 were up 84 percent from the previous week, but down 74 percent from the prior 4-week average. The destinations were primarily to Jamaica (3,500 MT) and Mexico (1,400 MT).
Cotton: Net sales of 50,500 RB for 2021/2022–a marketing-year low–were down 15 percent from the previous week and 70 percent from the prior 4-week average. Increases primarily for India (19,500 RB, including decreases of 13,500 RB), Peru (10,300 RB), Guatemala (6,200 RB), China (4,700 RB), and Turkey (2,400 RB, including decreases of 9,600 RB), were offset by reductions for Indonesia (900 RB), Honduras (500 RB), and South Korea (400 RB). Net sales of 136,100 RB for 2022/2023 were primarily for Turkey (48,400 RB), Mexico (30,100 RB), Honduras (17,400 RB), Peru (11,900 RB), and Indonesia (9,700 RB). Exports of 367,100 RB were up 10 percent from the previous week, but down 6 percent from the prior 4-week average. The destinations were primarily to China (146,800 RB), Pakistan (57,000 RB), Turkey (55,400 RB), Vietnam (42,300 RB), and Mexico (10,800 RB). Net sales of Pima totaling 3,800 RB were up 79 percent from the previous week, but down 20 percent from the prior 4-week average. Increases were primarily for Pakistan (1,500 RB), Vietnam (900 RB), Bangladesh (700 RB), Turkey (400 RB), and India (200 RB). Net sales of 5,500 RB for 2022/2023 were reported for Peru (4,300 RB), India (700 RB), Germany (400 RB), and Japan (100 RB). Exports of 14,700 RB were down 19 percent from the previous week, but up 22 percent from the prior 4-week average. The destinations were primarily to India (5,700 RB), China (5,200 RB), Turkey (1,200 RB), Peru (1,100 RB), and Taiwan (400 RB).
Optional Origin Sales: For 2021/2022, the current outstanding balance of 57,200 RB is for Vietnam (52,800 RB) and Pakistan (4,400 RB).
Exports for Own Account: For 2021/2022, the current exports for own account outstanding balance is 100 RB, all Vietnam.
Hides and Skins: Net sales of 473,700 pieces for 2022 were up 15 percent from the previous week and 18 percent from the prior 4-week average. Increases primarily for China (271,100 whole cattle hides, including decreases of 17,100 pieces), Thailand (125,700 whole cattle hides, including decreases of 1,300 pieces), Mexico (27,800 whole cattle hides, including decreases of 600 pieces), South Korea (20,300 whole cattle hides, including decreases of 700 pieces), and Indonesia (13,100 whole cattle hides, including decreases of 700 pieces), were offset by reductions for Argentina (600 pieces), Brazil (400 pieces), and Taiwan (300 pieces). Exports of 377,900 pieces were down 36 percent from the previous week and 26 percent from the prior 4-week average. Whole cattle hides exports were primarily to China (206,500 pieces), South Korea (45,400 pieces), Mexico (34,300 pieces), Thailand (34,000 pieces), and Taiwan (25,300 pieces).
Net sales of 270,800 wet blues for 2022 were up noticeably from the previous week and up 89 percent from the prior 4-week average. Increases primarily for Italy (86,200 unsplit and 9,000 grain splits, including decreases of 100 unsplit), China (58,000 unsplit, including decreases of 200 unsplit), Vietnam (53,600 unsplit), Thailand (31,800 unsplit), and Portugal (16,000 grain splits), were offset by reductions for Hong Kong (100 unsplit). Exports of 171,300 wet blues were up 3 percent from the previous week, but down 8 percent from the prior 4-week average. The destinations were primarily to Italy (41,400 unsplit and 16,200 grain splits), China (31,400 unsplit), Vietnam (30,400 unsplit), Thailand (25,700 unsplit), and Hong Kong (10,900 unsplit). Net sales of 999,000 splits were down noticeably from the previous week, but up 96 percent from the prior 4-week average. Increases were reported for Vietnam (623,400 pounds, including decreases of 17,100 pounds), South Korea (249,600 pounds, including decreases of 2,900 pounds), and China (126,000 pounds). Exports of 686,900 pounds were down 11 percent from the previous week, but up 16 percent from the prior 4-week average. The destinations were primarily to Vietnam (557,700 pounds) and South Korea (85,300 pounds).
Beef: Net sales of 15,000 MT for 2022 were down 13 percent from the previous week and 27 percent from the prior 4-week average. Increases were primarily for Japan (4,600 MT, including decreases of 700 MT), South Korea (4,100 MT, including decreases of 700 MT), China (2,500 MT, including decreases of 700 MT), Canada (1,000 MT, including decreases of 100 MT), and Taiwan (600 MT, including decreases of 100 MT). Exports of 21,000 MT were up 13 percent from the previous week, but down 16 percent from the prior 4-week average. The destinations were primarily to South Korea (6,800 MT), Japan (5,200 MT), China (3,600 MT), Taiwan (1,200 MT), and Mexico (1,000 MT).
Pork: Net sales of 12,900 MT for 2022–a marketing-year low–were down 46 percent from the previous week and 55 percent from the prior 4-week average. Increases primarily for Mexico (4,700 MT, including decreases of 600 MT), South Korea (2,800 MT, including decreases of 1,300 MT), the Philippines (1,300 MT), Canada (800 MT, including decreases of 500 MT), and the Dominican Republic (700 MT), were offset by reductions for China (100 MT). Exports of 28,200 MT were down 11 percent from the previous week and 6 percent from the prior 4-week average. The destinations were primarily to Mexico (11,600 MT), Japan (4,600 MT), China (3,800 MT), South Korea (2,700 MT), and Canada (1,300 MT).
Terry Reilly
Senior Commodity Analyst – Grain and Oilseeds
Futures International
One Lincoln Center
18 W 140 Butterfield Rd.
Oakbrook Terrace, Il. 60181
W: 312.604.1366
ICE IM: treilly1
Skype: fi.treilly

Trading of futures, options, swaps and other derivatives is risky and is not suitable for all persons. All of these investment products are leveraged, and you can lose more than your initial deposit. Each investment product is offered only to and from jurisdictions where solicitation and sale are lawful, and in accordance with applicable laws and regulations in such jurisdiction. The information provided here should not be relied upon as a substitute for independent research before making your investment decisions. Futures International, LLC is merely providing this information for your general information and the information does not take into account any particular individual’s investment objectives, financial situation, or needs. All investors should obtain advice based on their unique situation before making any investment decision. The contents of this communication and any attachments are for informational purposes only and under no circumstances should they be construed as an offer to buy or sell, or a solicitation to buy or sell any future, option, swap or other derivative. The sources for the information and any opinions in this communication are believed to be reliable, but Futures International, LLC does not warrant or guarantee the accuracy of such information or opinions. Futures International, LLC and its principals and employees may take positions different from any positions described in this communication. Past results are not necessarily indicative of future results.