PDF attached
USDA Export Sales
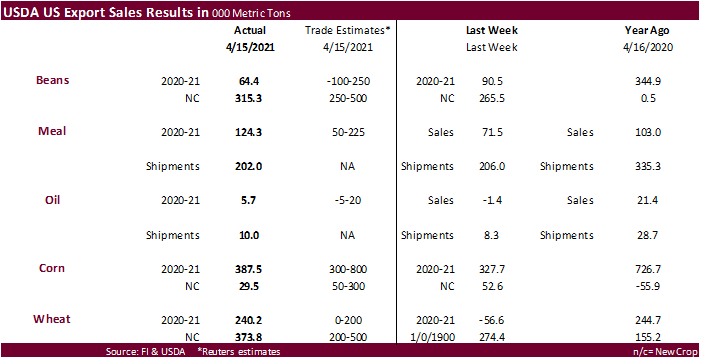
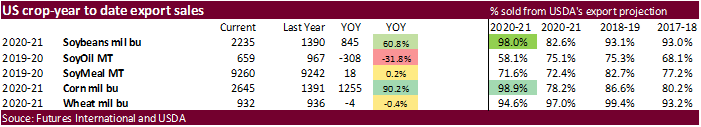
Nearly all the major commodities for USDA export sales came in within expectations. New-crop corn fell short of expectations and old crop wheat was slightly higher than expected. We are looking for USDA to take 2020-21 US corn exports up in the May USDA S&D by 50-100 million bushels.
This summary is based on reports from exporters for the period April 9-15, 2021.
Wheat: Net sales of 240,200 metric tons (MT) for 2020/2021 were down noticeably from the previous week, but up 55 percent from the prior 4-week average. Increases primarily for Mexico (137,500 MT, including decreases of 800 MT), Taiwan (46,300 MT, including decreases of 400 MT), Japan (30,300 MT), Italy (11,500 MT, including decreases of 8,000 MT), and the Philippines (11,000 MT), were offset by reductions primarily for Vietnam (9,500 MT), El Salvador (7,000 MT), and Guatemala (3,500 MT). For 2021/2022, net sales of 373,800 MT were primarily for Japan (67,500 MT), unknown destinations (65,500 MT), China (65,000 MT), Mexico (60,200 MT), and Taiwan (51,000 MT). Exports of 561,000 MT were up 20 percent from the previous week and 11 percent from the prior 4-week average. The destinations were primarily to the Philippines (131,000 MT), Thailand (108,800 MT), China (66,000 MT), South Korea (65,100 MT), and Mexico (57,300 MT).
Optional Origin Sales: For 2020/2021, new optional origin sales of 6,500 MT were reported for Spain. The current outstanding balance of 35,500 MT is for Spain.
Corn: Net sales of 387,500 MT for 2020/2021 were up 18 percent from the previous week, but down 75 percent from the prior 4-week average. Increases primarily for Mexico (366,300 MT, including 36,000 MT switched from unknown destinations and decreases of 1,400 MT ), South Korea (134,600 MT, including 68,000 MT switched from China, 65,000 MT switched from unknown destinations, and decreases of 6,100 MT), Japan (103,500 MT, including 175,700 MT switched from unknown destinations and decreases of 74,800 MT), Colombia (80,600, including 20,500 MT switched from Panama and decreases of 53,600 MT), and Taiwan (72,800 MT, including 70,000 MT switched from China and decreases of 700 MT), were offset by reductions primarily for unknown destinations (215,800 MT) and China (123,900 MT). For 2021/2022, net sales of 29,500 MT were reported for Mexico (11,200 MT), El Salvador (7,500 MT), Nicaragua (7,500 MT), and Guatemala (3,300 MT). Exports of 1,605,700 MT were down 12 percent from the previous week and 18 percent from the prior 4-week average. The destinations were primarily to China (560,100 MT), Mexico (321,100 MT), South Korea (265,000 MT – including 69,200 MT – late), Japan (244,800 MT), and Taiwan (83,900 MT).
Optional Origin Sales: For 2020/2021, the current outstanding balance of 443,800 MT is for South Korea (213,000 MT), unknown destinations (189,500 MT), the Ukraine (32,400 MT), and China (8,900 MT).
Late Reporting: For 2020/2021, exports totaling 69,200 MT of corn were reported late to South Korea.
Barley: Total net sales of 100 MT for 2020/2021 were up noticeably from the previous week, but down noticeably from the prior 4-week average. Increases were for Canada. Exports of 500 MT were up 5 percent from the previous week, but down 4 percent from the prior 4-week average. The destinations were Canada (300 MT) and South Korea (200 MT).
Sorghum: Net sales of 7,000 MT for 2020/2021 were down 99 percent from the previous week and 97 percent from the prior 4-week average. Increases reported for China (130,000 MT, including 68,000 MT switched from unknown destinations and decreases of 4,800 MT), were offset by reductions for unknown destinations (123,000 MT). For 2021/2022, total net sales of 116,000 MT were for China. Exports of 256,300 MT were down 70 percent from the previous week and 27 percent from the prior 4-week average. The destination was China.
Rice: Net sales of 96,900 MT for 2020/2021 were up noticeably from the previous week and from the prior 4-week average. Increases were primarily for Mexico (37,600 MT), Venezuela (28,600 MT, including decreases of 800 MT), the Dominican Republic (11,000 MT), Honduras (5,400 MT), and Guatemala (5,400 MT). Exports of 93,000 MT were up noticeably from the previous week and from the prior 4-week average. The destinations were primarily to Venezuela (55,600 MT), the Dominican Republic (19,700 MT), Mexico (3,900 MT), Canada (3,000 MT), and South Korea (3,000 MT).
Exports for Own Account: For 2020/2021, new exports for own account totaling 100 MT were for Canada. The current exports for own account outstanding balance is 100 MT, all Canada.
Soybeans: Net sales of 64,300 MT for 2020/2021 were down 29 percent from the previous week, but up 25 percent from the prior 4-week average. Increases primarily for Japan (58,200 MT, including 37,200 MT switched from unknown destinations and decreases of 1,500 MT), Bangladesh (55,000 MT), Indonesia (14,800 MT, including decreases of 600 MT), Canada (10,300 MT), and Colombia (8,300 MT), were offset by reductions primarily for China (51,200 MT) and unknown destinations (37,200 MT). For 2021/2022, net sales of 315,300 MT were primarily for Pakistan (130,000 MT), unknown destinations (130,000 MT), and Bangladesh (55,000 MT). Exports of 226,400 MT–a marketing-year low–were down 45 percent from the previous week and 47 percent from the prior 4-week average. The destinations were primarily to Mexico (74,000 MT), Japan (69,400 MT), China (25,500 MT), Indonesia (19,400 MT), and Taiwan (11,500 MT).
Exports for Own Account: For 2020/2021, the current exports for own account outstanding balance is 5,800 MT, all Canada.
Soybean Cake and Meal: Net sales of 124,300 MT for 2020/2021 were up 74 percent from the previous week, but down 2 percent from the prior 4-week average. Increases primarily for Mexico (32,500 MT, including decreases of 100 MT), Nicaragua (23,300 MT, including 8,300 MT switched from Honduras), Ecuador (22,500 MT), Canada (20,400 MT, including decreases of 300 MT), and the Dominican Republic (13,500 MT, including decreases of 2,100 MT), were offset by reductions primarily for El Salvador (4,800 MT), Honduras (3,000 MT), Panama (2,000 MT), and Belgium (1,800 MT). For 2021/2022, net sales of 8,200 MT resulting in increases for Canada (8,300 MT), were offset by reductions for El Salvador (100 MT). Exports of 202,000 MT were down 2 percent from the previous week and 19 percent from the prior 4-week average. The destinations were primarily to the Philippines (51,500 MT), Mexico (42,400 MT), Venezuela (36,500 MT, including 27,500 MT – late), Canada (25,700 MT), and Morocco (18,900 MT).
Late Reporting: For 2020/2021, exports totaling 27,500 MT of soybean cake and meal were reported late to Venezuela.
Soybean Oil: Net sales of 5,700 MT for 2020/2021 were down noticeably from the previous week and down 28 percent from the prior 4-week average. Increases were primarily for Jamaica (3,500 MT), the Dominican Republic (1,500 MT), Canada (400 MT), and Mexico (200 MT). Exports of 9,900 MT were up 20 percent from the previous week and 4 percent from the prior 4-week average. The destinations were primarily to the Dominican Republic (4,000 MT), Jamaica (3,500 MT), Canada (1,000 MT), Guatemala (700 MT), and Mexico (600 MT).
Cotton: Net sales of 103,100 RB for 2020/2021 were down 16 percent from the previous week and 44 percent from the prior 4-week average. Increases primarily for China (38,600 RB), Vietnam (22,600 RB, including 2,200 RB switched from Hong Kong, 300 RB switched from China, and decreases of 5,400 RB), Turkey (18,600 RB), Indonesia (9,500 RB, including decreases of 100 RB), and Pakistan (7,500 RB, including 3,700 RB switched from Turkey, 800 RB switched from India, and decreases of 200 RB), were offset by reductions for Hong Kong (2,200 RB) and Thailand (1,800 RB). For 2021/2022, net sales of 42,800 RB were primarily for China (15,400 RB), South Korea (13,200 RB), Vietnam (5,300 RB), Turkey (4,400 RB), and Peru (4,000 RB). Exports of 329,000 RB were up 5 percent from the previous week, but down 1 percent from the prior 4-week average. Exports were primarily to Vietnam (85,800 RB), China (64,600 RB), Pakistan (43,200 RB), Turkey (36,300 RB), and Mexico (25,000 RB). Net sales of Pima totaling 6,700 RB were up noticeably from the previous week and up 22 percent from the prior 4-week average. Increases were reported for India (3,800 RB, including decreases of 300 RB), Peru (2,300 RB), Bahrain (400 RB), and Japan (200 RB). Exports of 19,600 RB were up 19 percent from the previous week and 27 percent from the prior 4-week average. The destinations were primarily to India (4,600 RB), Vietnam (3,700 RB), China (3,500 RB), Peru (3,400 RB), and Bangladesh (1,300 RB).
Exports for Own Account: For 2020/2021, exports for own account totaling 3,000 RB to China (1,500 RB), Vietnam (1,300 RB), and Bangladesh (200 RB) were applied to new or outstanding sales. The current exports for own account outstanding balance of 26,200 RB is for China (21,300 RB), Vietnam (4,500 RB), and Bangladesh (400 RB).
Hides and Skins: Net sales of 358,300 pieces for 2021 were up 27 percent from the previous week, but down 10 percent from the prior 4-week average. Increases primarily for China (198,300 whole cattle hides, including decreases of 6,700 pieces), South Korea (70,400 whole cattle hides, including decreases of 1,600 pieces), Mexico (41,000 whole cattle hides, including decreases of 300 pieces), Thailand (20,700 whole cattle hides, including decreases of 700 pieces), and Japan (11,000 whole cattle hides), were offset by reductions for Turkey (200 pieces), Vietnam (200 pieces), and Brazil (100 pieces). Total net sales of 500 kip skins (including decreases of 500 kip skins) were for Belgium. Exports of 378,100 pieces for 2021 were down 6 percent from the previous week and 3 percent from the prior 4-week average. Whole cattle hides exports were primarily to China (243,600 pieces), South Korea (53,600 pieces), Mexico (34,200 pieces), Thailand (22,500 pieces), and Taiwan (7,800 pieces). Exports of 1,800 kip skins were to Belgium (1,300 kip skins) and China (500 kip skins).
Net sales of 72,200 wet blues for 2021 were up 13 percent from the previous week, but down 50 percent from the prior 4-week average. Increases reported for Thailand (32,300 unsplit, including decreases of 300 unsplit), China (22,600 unsplit), Vietnam (10,400 unsplit), Mexico (6,000 unsplit, including decreases of 300 grain splits), and Brazil (1,300 unsplit), were offset by reductions primarily for Taiwan (100 unsplit). Exports of 136,000 wet blues for 2021 were up 35 percent from the previous week and 12 percent from the prior 4-week average. The destinations were primarily to China (44,800 unsplit), Vietnam (29,400 unsplit), Italy (17,700 unsplit and 6,400 grain split), Mexico (18,000 grain splits and 3,400 unsplit), and Thailand (6,900 unsplit). Net sales of 345,800 splits were for Vietnam (252,200 pounds) and China (93,600 pounds). Exports of 517,900 pounds were to Vietnam (440,000 pounds) and China (77,900 pounds).
Beef: Net sales of 24,600 MT reported for 2021 were up 57 percent from the previous week and 38 percent from the prior 4-week average. Increases primarily for South Korea (7,800 MT, including decreases of 500 MT), Japan (6,200 MT, including decreases of 700 MT), China (3,100 MT, including decreases of 100 MT), Mexico (2,100 MT, including decreases of 100 MT), and Taiwan (1,900 MT, including decreases of 200 MT), were offset by reductions primarily for Italy (100 MT). Exports of 19,500 MT were up 2 percent from the previous week and 4 percent from the prior 4-week average. The destinations were primarily to South Korea (6,100 MT), Japan (4,900 MT), China (3,600 MT), Mexico (1,400 MT), and Taiwan (1,100 MT).
Pork: Net sales reductions of 22,100 MT reported for 2021–a marketing-year low–were down noticeably from the previous week and from the prior 4-week average. Increases were primarily for China (13,100 MT, including decreases of 1,700 MT), Japan (2,700 MT, including decreases of 100 MT), South Korea (1,500 MT, including decreases of 200 MT), Australia (1,500 MT, including decreases of 700 MT), and Canada (1,100 MT, including decreases of 800 MT), were offset by reductions for Mexico (45,100 MT – including 54,476 MT canceled). Exports of 43,900 MT–a marketing-year high–were up 14 percent from the previous week and 13 percent from the prior 4-week average. The destinations were primarily to Mexico (13,800 MT), China (13,400 MT), Japan (3,900 MT), South Korea (2,900 MT), and the Philippines (2,000 MT).
Data Cancelation: Due to an error in exporter(s) reporting, exports of 54,476 MT of pork were not reported properly in marketing year 2020. To correct marketing year 2021 figures a cancelation of 54,476 MT has been reported this week to remove the portion that should have been reported in 2020.
April 22, 2021 1 FOREIGN AGRICULTURAL SERVICE/USDA
U.S. EXPORT SALES FOR WEEK ENDING 4/15/2021
|
|
CURRENT MARKETING YEAR |
NEXT MARKETING YEAR |
||||||
|
COMMODITY |
NET SALES |
OUTSTANDING SALES |
WEEKLY EXPORTS |
ACCUMULATED EXPORTS |
NET SALES |
OUTSTANDING SALES |
||
|
CURRENT YEAR |
YEAR |
CURRENT YEAR |
YEAR |
|||||
|
|
THOUSAND METRIC TONS |
|||||||
|
WHEAT |
|
|
|
|
|
|
|
|
|
HRW |
74.1 |
1,102.1 |
1,500.7 |
118.4 |
7,518.7 |
8,134.8 |
162.2 |
644.7 |
|
SRW |
2.6 |
245.6 |
256.9 |
16.4 |
1,528.9 |
2,139.8 |
53.0 |
530.6 |
|
HRS |
158.7 |
1,271.0 |
1,269.1 |
138.8 |
6,409.1 |
6,152.9 |
56.0 |
589.0 |
|
WHITE |
12.7 |
1,332.7 |
840.0 |
286.9 |
5,296.9 |
4,249.8 |
102.6 |
585.0 |
|
DURUM |
-8.0 |
69.7 |
179.0 |
0.4 |
594.9 |
741.2 |
0.0 |
5.0 |
|
TOTAL |
240.2 |
4,021.0 |
4,045.8 |
561.0 |
21,348.6 |
21,418.6 |
373.8 |
2,354.2 |
|
BARLEY |
0.1 |
4.5 |
10.8 |
0.5 |
24.7 |
38.8 |
0.0 |
20.2 |
|
CORN |
387.5 |
27,805.3 |
13,740.0 |
1,605.7 |
39,393.0 |
21,582.4 |
29.5 |
2,131.6 |
|
SORGHUM |
7.0 |
1,943.8 |
1,529.1 |
256.3 |
5,107.0 |
1,705.3 |
116.0 |
1,136.0 |
|
SOYBEANS |
64.3 |
5,102.5 |
4,799.5 |
226.4 |
55,724.4 |
33,022.8 |
315.3 |
6,191.6 |
|
SOY MEAL |
124.3 |
2,142.7 |
2,503.2 |
202.0 |
7,117.2 |
6,738.6 |
8.2 |
289.1 |
|
SOY OIL |
5.7 |
101.9 |
301.5 |
9.9 |
557.2 |
665.1 |
0.0 |
0.6 |
|
RICE |
|
|
|
|
|
|
|
|
|
L G RGH |
79.7 |
319.9 |
291.8 |
58.1 |
1,183.3 |
1,093.8 |
0.0 |
0.0 |
|
M S RGH |
0.0 |
5.3 |
23.5 |
0.0 |
23.5 |
53.0 |
0.0 |
0.0 |
|
L G BRN |
0.3 |
3.0 |
17.3 |
0.5 |
35.2 |
42.5 |
0.0 |
0.0 |
|
M&S BR |
0.3 |
68.5 |
57.6 |
0.4 |
86.1 |
51.8 |
0.0 |
0.0 |
|
L G MLD |
12.3 |
52.7 |
60.8 |
24.9 |
483.7 |
710.4 |
0.0 |
0.0 |
|
M S MLD |
4.3 |
247.2 |
224.9 |
9.2 |
402.1 |
461.9 |
0.0 |
0.0 |
|
TOTAL |
96.9 |
696.5 |
675.9 |
93.0 |
2,214.0 |
2,413.5 |
0.0 |
0.0 |
|
COTTON |
|
THOUSAND RUNNING BALES |
||||||
|
UPLAND |
103.1 |
4,586.8 |
5,427.0 |
329.0 |
10,485.4 |
9,692.1 |
42.8 |
1,657.5 |
|
PIMA |
6.7 |
207.2 |
156.2 |
19.6 |
549.4 |
387.4 |
0.0 |
1.1 |
Terry Reilly
Senior Commodity Analyst – Grain and Oilseeds
Futures International
One Lincoln Center
18 W 140 Butterfield Rd.
Oakbrook Terrace, Il. 60181
W: 312.604.1366
ICE IM: treilly1
Skype: fi.treilly

Trading of futures, options, swaps and other derivatives is risky and is not suitable for all persons. All of these investment products are leveraged, and you can lose more than your initial deposit. Each investment product is offered only to and from jurisdictions where solicitation and sale are lawful, and in accordance with applicable laws and regulations in such jurisdiction. The information provided here should not be relied upon as a substitute for independent research before making your investment decisions. Futures International, LLC is merely providing this information for your general information and the information does not take into account any particular individual’s investment objectives, financial situation, or needs. All investors should obtain advice based on their unique situation before making any investment decision. The contents of this communication and any attachments are for informational purposes only and under no circumstances should they be construed as an offer to buy or sell, or a solicitation to buy or sell any future, option, swap or other derivative. The sources for the information and any opinions in this communication are believed to be reliable, but Futures International, LLC does not warrant or guarantee the accuracy of such information or opinions. Futures International, LLC and its principals and employees may take positions different from any positions described in this communication. Past results are not necessarily indicative of future results.