PDF attached
US Initial Jobless Claims Apr 23: 180K (est 180K; prev 184K)
US Continuing Claims Apr 16: 1408K (est 1399K; prev 1417K)
US GDP Annualized (Q/Q) Q1 A: -1.4% (est 1.0%; prev 6.9%)
US Personal Consumption Q1 A: 2.7% (est 3.5%; prev 2.5%)
US GDP Price Index Q1 A: 8.0% (est 7.2%; prev 7.1%)
US Core PCE (Q/Q) Q1 A: 5.2% (est 5.5%; prev 5.0%)
Canadian SEPH Payroll Employment Change Feb: 142.9K (prev 5.5K)
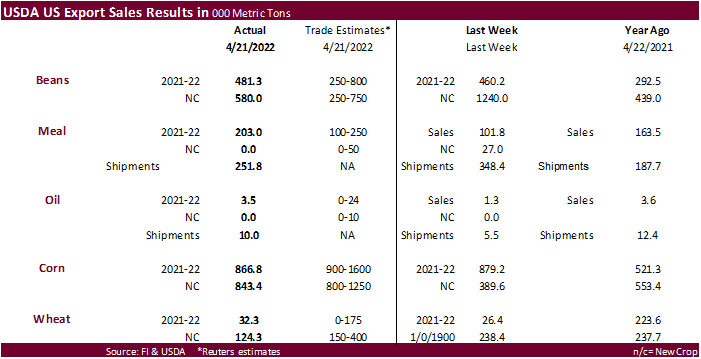
USDA Export Sales
USDA export sales were within expectations for the soybean complex, corn, and wheat. Grains and soybean oil did come in near the lower end of a range of estimates. 2021-22 corn sales included 729,200 tons for China and 2022-23 sales included 612,000 tons for China. For soybeans, 2021-22 China sales were 164,100 tons (including 121,000 MT switched from unknown destinations and decreases of 33,300 MT), and 2022-23 China sales were 580,000 tons. Sorghum sales were only 12,500 tons and pork sales were good at 31,500 tons.
U.S. EXPORT SALES FOR WEEK ENDING 4/21/2022
|
|
CURRENT MARKETING YEAR |
NEXT MARKETING YEAR |
||||||
|
COMMODITY |
NET SALES |
OUTSTANDING SALES |
WEEKLY EXPORTS |
ACCUMULATED EXPORTS |
NET SALES |
OUTSTANDING SALES |
||
|
CURRENT YEAR |
YEAR |
CURRENT YEAR |
YEAR |
|||||
|
|
THOUSAND METRIC TONS |
|||||||
|
WHEAT |
|
|
|
|
|
|
|
|
|
HRW |
-2.8 |
1,017.8 |
1,097.9 |
56.7 |
6,472.2 |
7,626.7 |
-10.8 |
573.9 |
|
SRW |
1.8 |
369.9 |
254.6 |
46.5 |
2,484.2 |
1,555.2 |
4.5 |
591.5 |
|
HRS |
22.2 |
700.1 |
1,187.7 |
75.9 |
4,721.2 |
6,553.1 |
67.5 |
635.4 |
|
WHITE |
5.4 |
312.5 |
1,083.5 |
46.2 |
3,023.4 |
5,567.5 |
63.2 |
400.3 |
|
DURUM |
5.7 |
0.5 |
72.1 |
20.7 |
195.2 |
594.9 |
0.0 |
64.4 |
|
TOTAL |
32.3 |
2,400.8 |
3,695.8 |
246.0 |
16,896.1 |
21,897.4 |
124.3 |
2,265.5 |
|
BARLEY |
-0.1 |
5.7 |
4.4 |
0.0 |
14.7 |
25.1 |
0.0 |
8.6 |
|
CORN |
866.8 |
19,383.4 |
26,411.4 |
1,562.1 |
38,132.0 |
41,308.2 |
843.4 |
4,206.8 |
|
SORGHUM |
12.5 |
2,048.4 |
1,809.7 |
168.0 |
4,668.5 |
5,348.2 |
0.0 |
0.0 |
|
SOYBEANS |
481.3 |
10,849.1 |
5,054.6 |
710.9 |
46,728.1 |
56,064.8 |
580.0 |
10,741.3 |
|
SOY MEAL |
203.0 |
2,666.2 |
2,118.6 |
251.8 |
6,987.9 |
7,304.9 |
0.0 |
370.4 |
|
SOY OIL |
3.5 |
134.5 |
93.2 |
10.0 |
515.9 |
569.6 |
0.0 |
0.0 |
|
RICE |
|
|
|
|
|
|
|
|
|
L G RGH |
1.0 |
137.8 |
311.3 |
65.2 |
1,077.9 |
1,215.9 |
0.0 |
0.0 |
|
M S RGH |
0.0 |
9.2 |
5.3 |
0.0 |
11.8 |
23.5 |
0.0 |
0.0 |
|
L G BRN |
0.3 |
6.0 |
2.9 |
0.4 |
44.9 |
35.4 |
0.0 |
0.0 |
|
M&S BR |
0.5 |
24.1 |
45.6 |
0.4 |
63.1 |
109.2 |
0.0 |
0.0 |
|
L G MLD |
1.6 |
86.3 |
37.4 |
9.1 |
623.6 |
502.2 |
0.0 |
0.0 |
|
M S MLD |
13.1 |
223.7 |
244.3 |
13.8 |
296.6 |
409.8 |
0.0 |
0.0 |
|
TOTAL |
16.4 |
487.0 |
646.7 |
88.8 |
2,117.9 |
2,296.0 |
0.0 |
0.0 |
|
COTTON |
|
THOUSAND RUNNING BALES |
||||||
|
UPLAND |
121.1 |
6,325.1 |
4,322.0 |
386.0 |
8,165.9 |
10,827.4 |
49.5 |
2,846.1 |
|
PIMA |
13.0 |
132.3 |
197.6 |
4.4 |
331.9 |
563.9 |
0.5 |
40.6 |
This summary is based on reports from exporters for the period April 15-21, 2022.
Wheat: Net sales of 32,300 metric tons (MT) for 2021/2022 were up 23 percent from the previous week, but down 65 percent from the prior 4-week average. Increases primarily for Mexico (42,400 MT, including decreases of 2,200 MT), Taiwan (33,000 MT), the Dominican Republic (23,400 MT, including 22,200 MT switched from Guatemala and decreases of 200 MT), Costa Rica (14,700 MT, including 15,000 MT switched from Colombia and decreases of 400 MT), and Chile (7,000 MT), were offset by reductions for Nigeria (37,500 MT), unknown destinations (31,900 MT), Guatemala (22,200 MT), Colombia (12,900 MT), and Italy (400 MT). Net sales of 124,300 MT for 2022/2023 primarily for the Philippines (60,000 MT), Japan (33,700 MT), Chile (23,000 MT), Italy (20,000 MT), and unknown destinations (14,500 MT), were offset by reductions for Nigeria (41,000 MT). Exports of 246,000 MT were down 51 percent from the previous week and 35 percent from the prior 4-week average. The destinations were primarily to Italy (54,600 MT), the Philippines (44,600 MT), Mexico (38,600 MT), Japan (30,900 MT), and Colombia (27,300 MT).
Corn: Net sales of 866,800 MT for 2021/2022 were down 1 percent from the previous week and 5 percent from the prior 4-week average. Increases primarily for China (729,200 MT, including decreases of 5,800 MT), Mexico (144,900 MT, including 52,000 MT switched from unknown destinations and decreases of 59,300 MT), South Korea (125,100 MT, including 66,000 MT switched from unknown destinations and decreases of 6,000 MT), Spain (55,000 MT, including 50,000 MT switched from unknown destinations), and Japan (53,100 MT, including 205,000 MT switched from unknown destinations and decreases of 92,200 MT), were offset by reductions primarily for unknown destinations (376,700 MT). Net sales of 843,400 MT for 2022/2023 were reported for China (612,000 MT), Mexico (190,800 MT), and Japan (40,600 MT). Exports of 1,562,100 MT were up 31 percent from the previous week, but unchanged from the prior 4-week average. The destinations were primarily to Japan (385,600 MT), Mexico (337,800 MT), China (266,200 MT), Colombia (73,900 MT), and South Korea (60,100 MT).
Optional Origin Sales: For 2021/2022, new optional origin sales of 200 MT were reported for Morocco. Options were exercised to export 90,200 MT to unknown destinations (60,000 MT) and Morocco (30,200 MT) from the United States. Decreases totaling 65,000 MT were reported for unknown destinations. The current outstanding balance of 378,300 MT is for unknown destinations (240,000 MT), South Korea (65,000 MT), Italy (34,300 MT), Morocco (30,000 MT), and Saudi Arabia (9,000 MT). For 2022/2023, decreases totaling 23,000 MT were reported for Italy. The current outstanding balance of 35,400 MT is for Italy.
Barley: Total net sales reductions of 100 MT for 2021/2022 were unchanged from the previous week, but down 95 percent from the prior 4-week average. The destination was South Korea. No exports were reported for the week.
Sorghum: Net sales of 12,500 MT for 2021/2022 were down noticeably from the previous week and from the prior 4-week average. Increases reported for China (41,600 MT, including 30,000 MT switched from unknown destinations), Mexico (800 MT), and South Korea (200 MT), were offset by reductions for unknown destinations (30,000 MT) and Haiti (100 MT). Exports of 168,000 MT were down 40 percent from the previous week and 33 percent from the prior 4-week average. The destinations were to China (167,800 MT) and Haiti (200 MT).
Rice: Net sales of 16,400 MT for 2021/2022 were down 75 percent from the previous week and 53 percent from the prior 4-week average. Increases were primarily for Japan (12,000 MT), Canada (1,400 MT), Costa Rica (1,000 MT), Mexico (900 MT), and Argentina (300 MT). Exports of 88,800 MT were up noticeably from the previous week and up 84 percent from the prior 4-week average. The destinations were primarily to Mexico (31,400 MT), Colombia (30,800 MT), Japan (12,000 MT), Costa Rica (11,000 MT), and Canada (2,300 MT).
Exports for Own Account: For 2021/2022, new exports for own account totaling 100 MT were to Canada. Exports of 100 MT to Canada were applied to new or outstanding sales.
Soybeans: Net sales of 481,300 MT for 2021/2022 were up 5 percent from the previous week, but down 37 percent from the prior 4-week average. Increases were primarily for China (165,100 MT, including 121,000 MT switched from unknown destinations and decreases of 33,300 MT), Mexico (88,100 MT, including decreases of 3,000 MT), Bangladesh (56,100 MT, including 55,000 MT switched from unknown destinations), Japan (48,100 MT, including 3,600 MT switched from unknown destinations and decreases of 500 MT), and Taiwan (33,900 MT, including 20,000 MT switched from unknown destinations and decreases of 100 MT). Net sales of 580,000 MT for 2022/2023 were reported for China (468,000 MT) and Mexico (112,000 MT). Exports of 710,900 MT were down 20 percent from the previous week and 10 percent from the prior 4-week average. The destinations were primarily to China (279,900 MT), Egypt (158,800 MT), Mexico (81,400 MT), Bangladesh (56,100 MT), and Taiwan (40,300 MT).
Export for Own Account: For 2021/2022, new exports for own account totaling 29,700 MT were to Canada. The current exports for own account outstanding balance is 32,800 MT, all Canada.
Late Reporting: For 2021/2022, net sales and exports totaling 18,000 MT of soybeans were reported late for Belgium (9,900 MT) and Ireland (8,100 MT).
Soybean Cake and Meal: Net sales of 203,000 MT for 2021/2022 were up noticeably from the previous week and from the prior 4-week average. Increases primarily for Colombia (49,400 MT, including decreases of 3,100 MT), the Philippines (45,500 MT, including decreases of 2,300 MT), Mexico (36,600 MT), Japan (26,400 MT), and unknown destinations (20,000 MT), were offset by reductions primarily for Costa Rica (7,300 MT), Guatemala (3,000 MT), Israel (3,000 MT), and Belgium (2,300 MT). Exports of 251,800 MT were down 16 percent from the previous week, but up 11 percent from the prior 4-week average. The destinations were primarily to Colombia (65,600 MT), Mexico (46,700 MT), Israel (27,000 MT), Morocco (26,400 MT), and Canada (21,100 MT).
Soybean Oil: Net sales of 3,500 MT for 2021/2022 were up noticeably from the previous week, but down 69 percent from the prior 4-week average. Increases were reported for Costa Rica (2,300 MT), Canada (1,100 MT), and Venezuela (100 MT). Exports of 10,000 MT were up 82 percent from the previous week, but down 44 percent from the prior 4-week average. The destinations were primarily to Venezuela (6,600 MT) and Mexico (2,800 MT).
Cotton: Net sales of 121,100 RB for 2021/2022 were up noticeably from the previous week and up 19 percent from the prior 4-week average. Increases primarily for China (61,400 RB, including decreases of 7,600 RB), Vietnam (25,300 RB, including 1,700 RB switched from China, 700 RB switched from South Korea, and 500 RB switched from Japan), India (12,700 RB, including decreases of 5,500 RB), Pakistan (11,600 RB), and Turkey (4,700 RB), were offset by reductions for Ecuador (600 RB), South Korea (400 RB), Japan (300 RB), and Colombia (100 RB). Net sales of 49,500 RB for 2022/2023 primarily for El Salvador (28,800 RB), Honduras (11,400 RB), Peru (5,100 RB), Guatemala (4,500 RB), and Vietnam (4,400 RB), were offset by reductions for China (11,200 RB). Exports of 386,000 RB were up 5 percent from the previous week and 4 percent from the prior 4-week average. The destinations were primarily to China (117,900 RB), Vietnam (67,400 RB), Pakistan (57,600 RB), Turkey (43,300 RB), and Mexico (17,500 RB). Net sales of Pima totaling 13,000 RB were up noticeably from the previous week and from the prior 4-week average. Increases were reported for China (10,300 RB), Vietnam (1,700 RB), India (700 RB), Colombia (200 RB), and Malaysia (100 RB). Net sales of 500 RB for 2022/2023 were reported for Japan (300 RB) and Peru (200 RB). Exports of 4,400 RB were down 70 percent from the previous week and 69 percent from the prior 4-week average. The destinations were primarily to Peru (2,000 RB), China (1,600 RB), Vietnam (400 RB), Turkey (200 RB), and Bangladesh (100 RB).
Optional Origin Sales: For 2021/2022, the current outstanding balance of 57,200 RB is for Vietnam (52,800 RB) and Pakistan (4,400 RB).
Exports for Own Account: For 2021/2022, the current exports for own account outstanding balance is 100 RB, all Vietnam.
Hides and Skins: Net sales of 383,800 pieces for 2022 were down 19 percent from the previous week and 8 percent from the prior 4-week average. Increases primarily for China (161,800 whole cattle hides, including decreases of 12,400 pieces), South Korea (66,200 whole cattle hides, including decreases of 400 pieces), Mexico (54,600 whole cattle hides, including decreases of 700 pieces), Thailand (39,700 whole cattle hides, including decreases of 1,600 pieces), and Taiwan (20,400 whole cattle hides, including decreases of 4,500 pieces), were offset by reductions for Indonesia (300 pieces). In addition, total net sales reductions of 300 kip skins were reported for Italy. Exports of 417,000 pieces were up 10 percent from the previous week, but down 14 percent from the prior 4-week average. Whole cattle hides exports were primarily to China (251,200 pieces), Mexico (44,600 pieces), Thailand (35,200 pieces), South Korea (27,700 pieces), and Italy (15,800 pieces). In addition, total exports of 3,500 kip skins were to Italy.
Net sales of 61,400 wet blues for 2022 were down 77 percent from the previous week and 52 percent from the prior 4-week average. Increases reported for Vietnam (31,000 unsplit, including decreases of 900 unsplit), China (21,700 unsplit), India (7,800 unsplit, including decreases of 5,500 grain splits), and Italy (6,800 unsplit, including decreases of 200 unsplit and 100 grain splits), were offset by reductions for Brazil (100 unsplit), Thailand (100 unsplit), the Dominican Republic (100 unsplit), and Portugal (100 unsplit). Exports of 128,100 wet blues were down 25 percent from the previous week and 29 percent from the prior 4-week average. The destinations were primarily to Italy (33,100 unsplit and 8,100 grain splits), Vietnam (37,700 unsplit), Thailand (19,300 unsplit), China (14,000 unsplit), and Brazil (6,800 unsplit). Net sales of 123,200 splits were down 88 percent from the previous week and 84 percent from the prior 4-week average. Increases were reported for China (43,000 pounds), Taiwan (41,000 pounds), Vietnam (36,200 pounds, including decreases of 12,300 pounds), and South Korea (3,000 pounds, including decreases of 600 pounds). Exports of 476,200 pounds were down 31 percent from the previous week and 30 percent from the prior 4-week average. The destination was primarily to Vietnam (396,200 pounds).
Beef: Net sales of 11,400 MT for 2022 were down 24 percent from the previous week and 34 percent from the prior 4-week average. Increases primarily for Japan (4,100 MT, including decreases of 500 MT), China (1,500 MT, including decreases of 100 MT), South Korea (1,300 MT, including decreases of 600 MT), Mexico (1,000 MT), and Taiwan (1,000 MT, including decreases of 300 MT), were offset by reductions for the United Arab Emirates (100 MT). Total net sales of 100 MT for 2023 were reported for Japan. Exports of 17,600 MT were down 16 percent from the previous week and 11 percent from the prior 4-week average. The destinations were primarily to South Korea (4,400 MT), Japan (4,300 MT), China (3,200 MT), Taiwan (1,300 MT), and Mexico (1,300 MT).
Pork: Net sales of 31,500 MT for 2022 were up noticeably from the previous week and up 19 percent from the prior 4-week average. Increases were primarily for Mexico (21,600 MT, including decreases of 300 MT), Japan (3,600 MT, including decreases of 100 MT), Canada (2,100 MT, including decreases of 400 MT), South Korea (1,500 MT, including decreases of 200 MT), and Colombia (1,100 MT, including decreases of 200 MT). Exports of 29,900 MT were up 6 percent from the previous week, but unchanged from the prior 4-week average. The destinations were primarily to Mexico (13,200 MT), China (3,800 MT), Japan (3,200 MT), South Korea (2,900 MT), and Colombia (2,000 MT).
Terry Reilly
Senior Commodity Analyst – Grain and Oilseeds
Futures International
One Lincoln Center
18 W 140 Butterfield Rd.
Oakbrook Terrace, Il. 60181
W: 312.604.1366
ICE IM: treilly1
Skype: fi.treilly

Trading of futures, options, swaps and other derivatives is risky and is not suitable for all persons. All of these investment products are leveraged, and you can lose more than your initial deposit. Each investment product is offered only to and from jurisdictions where solicitation and sale are lawful, and in accordance with applicable laws and regulations in such jurisdiction. The information provided here should not be relied upon as a substitute for independent research before making your investment decisions. Futures International, LLC is merely providing this information for your general information and the information does not take into account any particular individual’s investment objectives, financial situation, or needs. All investors should obtain advice based on their unique situation before making any investment decision. The contents of this communication and any attachments are for informational purposes only and under no circumstances should they be construed as an offer to buy or sell, or a solicitation to buy or sell any future, option, swap or other derivative. The sources for the information and any opinions in this communication are believed to be reliable, but Futures International, LLC does not warrant or guarantee the accuracy of such information or opinions. Futures International, LLC and its principals and employees may take positions different from any positions described in this communication. Past results are not necessarily indicative of future results.