PDF attached
USDA Export Sales
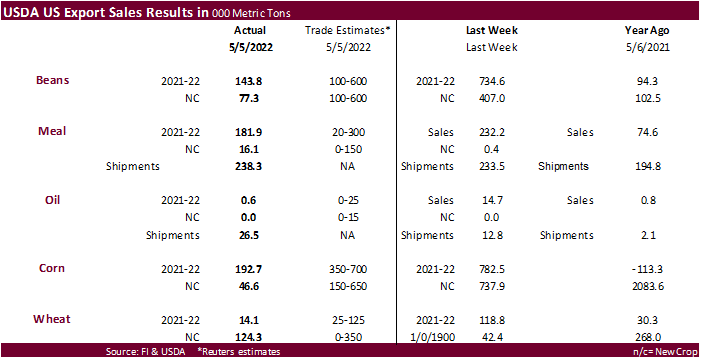
USDA export sales were poor all around. Soybean, corn, wheat, cotton and beef sales were all a marketing year low. China was largely absent for most commodities. There were several switches of destinations and small decreases posted for soybeans. Combined soybean meal sales nearly beat out soybean sales this week. Soybean meal shipments were 238,300 tons. SBO sales of 600 tons were poor and shipments were 26,500 tons. Corn sales were only 192,700 tons for 2021-22 and wheat sales for new-crop were low at 124,300 tons. Sorghum sales slowed to 27,800 tons. Pork sales were 26,300 tons and included China for 4,700 tons.
U.S. EXPORT SALES FOR WEEK ENDING 5/5/2022
|
|
CURRENT MARKETING YEAR |
NEXT MARKETING YEAR |
||||||
|
COMMODITY |
NET SALES |
OUTSTANDING SALES |
WEEKLY EXPORTS |
ACCUMULATED EXPORTS |
NET SALES |
OUTSTANDING SALES |
||
|
CURRENT YEAR |
YEAR |
CURRENT YEAR |
YEAR |
|||||
|
|
THOUSAND METRIC TONS |
|||||||
|
WHEAT |
|
|
|
|
|
|
|
|
|
HRW |
8.9 |
750.7 |
682.5 |
119.7 |
6,759.3 |
8,002.0 |
10.5 |
601.9 |
|
SRW |
3.1 |
224.4 |
208.5 |
92.6 |
2,651.0 |
1,627.4 |
63.0 |
666.0 |
|
HRS |
-16.4 |
644.1 |
874.9 |
25.6 |
4,815.5 |
6,828.8 |
24.0 |
672.9 |
|
WHITE |
18.6 |
296.2 |
707.5 |
2.4 |
3,092.5 |
5,915.9 |
26.8 |
427.1 |
|
DURUM |
0.0 |
0.5 |
48.6 |
0.0 |
195.5 |
631.8 |
0.0 |
64.4 |
|
TOTAL |
14.1 |
1,916.0 |
2,521.9 |
240.3 |
17,513.8 |
23,006.0 |
124.3 |
2,432.2 |
|
BARLEY |
0.0 |
5.7 |
2.7 |
0.0 |
14.8 |
25.9 |
0.0 |
8.6 |
|
CORN |
192.7 |
16,949.6 |
22,696.2 |
1,504.3 |
41,541.1 |
45,047.5 |
46.6 |
4,991.3 |
|
SORGHUM |
27.8 |
1,681.2 |
1,521.3 |
270.8 |
5,151.6 |
5,708.0 |
0.0 |
0.0 |
|
SOYBEANS |
143.7 |
10,692.0 |
4,765.0 |
471.7 |
47,763.5 |
56,614.1 |
77.3 |
11,225.6 |
|
SOY MEAL |
181.9 |
2,608.5 |
1,999.0 |
238.3 |
7,459.8 |
7,701.0 |
16.1 |
386.9 |
|
SOY OIL |
0.6 |
110.5 |
76.8 |
26.5 |
555.2 |
592.8 |
0.0 |
0.0 |
|
RICE |
|
|
|
|
|
|
|
|
|
L G RGH |
9.2 |
134.7 |
259.4 |
8.5 |
1,098.1 |
1,301.3 |
2.0 |
2.0 |
|
M S RGH |
0.0 |
8.6 |
5.3 |
0.1 |
12.3 |
23.5 |
0.0 |
0.0 |
|
L G BRN |
0.5 |
4.0 |
2.8 |
2.4 |
47.8 |
36.2 |
0.0 |
0.0 |
|
M&S BR |
0.1 |
9.9 |
45.5 |
0.0 |
77.4 |
109.7 |
0.0 |
0.0 |
|
L G MLD |
17.4 |
88.5 |
27.8 |
21.0 |
647.5 |
528.4 |
0.0 |
0.0 |
|
M S MLD |
1.9 |
200.6 |
221.2 |
14.0 |
315.0 |
447.1 |
0.0 |
0.0 |
|
TOTAL |
29.2 |
446.2 |
562.0 |
46.0 |
2,198.0 |
2,446.3 |
2.0 |
2.0 |
|
COTTON |
|
THOUSAND RUNNING BALES |
||||||
|
UPLAND |
27.5 |
5,793.8 |
3,706.2 |
364.5 |
8,957.1 |
11,561.2 |
90.6 |
3,029.9 |
|
PIMA |
2.1 |
108.3 |
168.7 |
8.3 |
361.4 |
607.9 |
2.9 |
47.5 |
This summary is based on reports from exporters for the period April 29-May 5, 2022.
Wheat: Net sales of 14,100 metric tons (MT) for 2021/2022–a marketing-year low–were down 88 percent from the previous week and 79 percent from the prior 4-week average. Increases primarily for Colombia (40,000 MT), unknown destinations (11,500 MT), South Korea (3,000 MT, including decreases of 22,500 MT), the Dominican Republic (1,600 MT), and Mexico (1,200 MT, including decreases of 3,100 MT), were offset by reductions primarily for Nigeria (36,300 MT), Chile (5,800 MT), and Japan (1,500 MT). Net sales of 124,300 MT for 2022/2023 were reported for Mexico (63,000 MT), unknown destinations (26,800 MT), South Korea (24,500 MT), Chile (7,000 MT), and Guatemala (3,000 MT). Exports of 240,300 MT were down 36 percent from the previous week and 35 percent from the prior 4-week average. The destinations were primarily to Indonesia (55,100 MT), Japan (51,600 MT), Mexico (47,700 MT), Nigeria (27,500 MT), and the Dominican Republic (17,800 MT).
Corn: Net sales of 192,700 MT for 2021/2022–a marketing-year low–were down 75 percent from the previous week and 80 percent from the prior 4-week average. Increases primarily for Japan (132,600 MT, including 23,300 MT switched from unknown destinations and decreases of 900 MT), South Korea (131,700 MT, including 133,000 MT switched from unknown destinations and decreases of 2,900 MT), Spain (73,700 MT, including 68,000 MT switched from unknown destinations), Colombia (57,100 MT, including 50,000 MT switched from unknown destinations and decreases of 57,700 MT), and Canada (41,400 MT, including decreases of 300 MT), were offset by reductions primarily for unknown destinations (304,000 MT). Net sales of 46,600 MT for 2022/2023 were reported for Mexico (22,400 MT), unknown destinations (22,000 MT), and Canada (2,200 MT). Exports of 1,504,300 MT were down 21 percent from the previous week and 3 percent from the prior 4-week average. The destinations were primarily to Mexico (349,000 MT), Japan (320,600 MT), China (260,200 MT), South Korea (131,300 MT), and Colombia (125,600 MT).
Optional Origin Sales: For 2021/2022, the current outstanding balance of 378,300 MT is for unknown destinations (240,000 MT), South Korea (65,000 MT), Italy (34,300 MT), Morocco (30,000 MT), and Saudi Arabia (9,000 MT). For 2022/2023, the current outstanding balance of 35,400 MT is for Italy.
Barley: No net sales or exports were reported for the week.
Sorghum: Net sales of 27,800 MT for 2021/2022 were down 69 percent from the previous week, but up noticeably from the prior 4-week average. Increases reported for China (80,800 MT, including 68,000 MT switched from unknown destinations and decreases of 400 MT) and Mexico (15,000 MT), were offset by reductions for unknown destinations (68,000 MT). Exports of 270,800 MT were up 28 percent from the previous week and 35 percent from the prior 4-week average. The destination was to China.
Rice: Net sales of 29,200 MT for 2021/2022 were up noticeably from the previous week, but down 18 percent from the prior 4-week average. Increases primarily for Haiti (13,500 MT), Canada (3,700 MT), Mexico (3,700 MT), El Salvador (3,100 MT), and Guatemala (2,300 MT), were offset by reductions for Yemen (300 MT). Total net sales of 2,000 MT for 2022/2023 were reported for Guatemala. Exports of 46,000 MT were up 35 percent from the previous week, but down 12 percent from the prior 4-week average. The destinations were primarily to Haiti (15,200 MT), Japan (12,200 MT), Honduras (8,500 MT), Canada (3,700 MT), and Mexico (1,700 MT).
Soybeans: Net sales of 143,700 MT for 2021/2022–a marketing-year low–were down 80 percent from the previous week and 74 percent from the prior 4-week average. Increases primarily for Indonesia (66,200 MT, including 55,000 MT switched from unknown destinations and decreases of 7,600 MT), Japan (61,200 MT, including 59,200 MT switched from unknown destinations and decreases of 1,400 MT), Mexico (20,600 MT, including decreases of 2,700 MT), Venezuela (8,000 MT), and Malaysia (5,300 MT, including decreases of 100 MT), were offset by reductions for unknown destinations (30,200 MT) and Peru (5,000 MT). Net sales of 77,300 MT for 2022/2023 were reported for unknown destinations (66,000 MT), Panama (6,300 MT), and Taiwan (5,000 MT). Exports of 471,700 MT were down 16 percent from the previous week and 37 percent from the prior 4-week average. The destinations were primarily to China (147,500 MT), Mexico (89,500 MT), Indonesia (72,400 MT), Taiwan (66,900 MT), and Japan (64,500 MT).
Export for Own Account: For 2021/2022, the current exports for own account outstanding balance is 62,400 MT, all Canada.
Soybean Cake and Meal: Net sales of 181,900 MT for 2021/2022 were down 22 percent from the previous week, but up 10 percent from the prior 4-week average. Increases primarily for Mexico (55,200 MT, including decreases of 1,500 MT), Ecuador (32,300 MT, including decreases of 2,200 MT), Honduras (19,100 MT, including decreases 6,200 MT), the Dominican Republic (18,600 MT), and Guatemala (15,800 MT), were offset by reductions primarily for unknown destinations (3,000 MT), Costa Rica (1,200 MT), and Laos (1,000 MT). Net sales of 16,100 MT for 2022/2023 reported for Panama (16,500 MT), were offset by reductions for Canada (400 MT). Exports of 238,300 MT were up 2 percent from the previous week and 4 percent from the prior 4-week average. The destinations were primarily to the Philippines (48,300 MT), Ecuador (35,300 MT), Mexico (35,200 MT), Honduras (23,100 MT), and the Dominican Republic (22,500 MT).
Soybean Oil: Net sales of 600 MT for 2021/2022 were down 96 percent from the previous week and 90 percent from the prior 4-week average. Increases were primarily for Canada (500 MT). Exports of 26,500 MT were up noticeably from the previous week and from the prior 4-week average. The destinations were to South Korea (23,400 MT), Hong Kong (1,900 MT), Mexico (700 MT), and Canada (500 MT).
Cotton: Net sales of 27,500 RB for 2021/2022–a marketing-year low–were down 88 percent from the previous week and 76 percent from the prior 4-week average. Increases primarily for India (19,800 RB), Peru (3,100 RB), Pakistan (2,600 RB), Guatemala (2,400 RB), and Vietnam (1,400 RB switched from China), were offset by reductions for China (3,300 RB), Turkey (1,900 RB), Ecuador (700 RB), and Thailand (300 RB). Net sales of 90,600 RB for 2022/2023 primarily for El Salvador (28,400 RB), Guatemala (25,300 RB), Pakistan (11,000 RB), Peru (10,700 RB), and Mexico (7,800 RB), were offset by reductions for Costa Rica (900 RB). Exports of 364,500 RB were down 15 percent from the previous week and 4 percent from the prior 4-week average. The destinations were primarily to China (107,700 RB), Turkey (60,700 RB), Pakistan (50,500 RB), Vietnam (46,700 RB), and Mexico (26,300 RB). Net sales of Pima totaling 2,100 RB were down 38 percent from the previous week and 63 percent from the prior 4-week average. Increases reported for Thailand (1,600 RB, including 400 RB switched from Vietnam), India (1,500 RB, including 1,100 RB switched from Italy), and Ethiopia (500 RB), were offset by reductions for Italy (1,100 RB) and Vietnam (400 RB). Total net sales of 2,900 RB for 2022/2023 were reported for Peru. Exports of 8,300 RB were down 61 percent from the previous week and 43 percent from the prior 4-week average. The destinations were primarily to India (2,800 RB), Vietnam (1,700 RB), Pakistan (1,300 RB), Peru (1,200 RB), and Thailand (600 RB).
Optional Origin Sales: For 2021/2022, options were exercised to export 1,200 RB to Pakistan from the United States. The current outstanding balance of 56,000 RB is for Vietnam (52,800 RB) and Pakistan (3,200 RB).
Exports for Own Account: For 2021/2022, the current exports for own account outstanding balance is 100 RB, all Vietnam.
Hides and Skins: Net sales of 294,200 pieces for 2022 were down 39 percent from the previous week and 33 percent from the prior 4-week average. Increases primarily for China (188,600 whole cattle hides, including decreases of 18,200 pieces), South Korea (43,100 whole cattle hides, including decreases of 3,500 pieces), Mexico (33,800 whole cattle hides, including decreases of 1,000 pieces), Brazil (24,700 whole cattle hides), and Thailand (6,700 whole cattle hides, including decreases of 1,200 pieces), were offset by reductions primarily for Italy (2,200 pieces) and Taiwan (700 pieces). Exports of 439,900 pieces were up 3 percent from the previous week, but down 3 percent from the prior 4-week average. Whole cattle hides exports were primarily to China (262,100 pieces), South Korea (52,100 pieces), Thailand (38,700 pieces), Mexico (37,800 pieces), and Italy (22,800 pieces).
Net sales of 27,400 wet blues for 2022 were down 69 percent from the previous week and 78 percent from the prior 4-week average. Increases primarily for Thailand (9,500 unsplit, including decreases of 500 unsplit), Mexico (6,900 unsplit), Vietnam (5,200 unsplit, including decreases of 12,300 unsplit), China (2,500 unsplit, including decreases of 6,400 unsplit), and the Dominican Republic (2,400 unsplit), were offset by reductions for Portugal (800 grain splits) and Italy (100 grain splits). Exports of 170,900 wet blues were up 4 percent from the previous week and 8 percent from the prior 4-week average. The destinations were primarily to Italy (50,800 unsplit and 8,900 grain splits), Vietnam (59,200 unsplit), China (33,900 unsplit), Thailand (7,500 unsplit), and Portugal (5,600 grain splits). Net sales reductions of 18,100 splits were down noticeably from the previous week and from the prior 4-week average. Reductions were reported for Vietnam (15,300 pounds) and South Korea (2,800 pounds). Exports of 271,100 pounds were down 44 percent from the previous week and 55 percent from the prior 4-week average. The destination was to Vietnam.
Beef: Net sales of 28,400 MT for 2022–a marketing-year high–were up 95 percent from the previous week and from the prior 4-week average. Increases were primarily for South Korea (12,000 MT, including decreases of 700 MT), Japan (7,200 MT, including decreases of 500 MT), Mexico (3,600 MT), Canada (1,100 MT), and Indonesia (900 MT). Exports of 19,700 MT were down 3 percent from the previous week, but up 2 percent from the prior 4-week average. The destinations were primarily to South Korea (6,000 MT), Japan (5,800 MT), China (2,500 MT), Taiwan (1,300 MT), and Mexico (1,200 MT).
Pork: Net sales of 26,300 MT for 2022 were up 10 percent from the previous week and 14 percent from the prior 4-week average. Increases were primarily for Mexico (9,600 MT, including decreases of 700 MT), China (4,700 MT, including decreases of 300 MT), South Korea (3,800 MT, including decreases of 700 MT), Japan (3,000 MT, including decreases of 200 MT), and Colombia (2,600 MT). Exports of 33,100 MT–a marketing-year high–were up 3 percent from the previous week and 9 percent from the prior 4-week average. The destinations were primarily to Mexico (14,600 MT), China (4,300 MT), South Korea (4,000 MT), Japan (3,900 MT), and Colombia (1,500 MT).
May 12, 2022 1 FOREIGN AGRICULTURAL SERVICE/USDA
SUMMARY OF EXPORT TRANSACTIONS
Reported Under the Daily Reporting System
For Period Ending MAY 5, 2022
*NO SALES WERE REPORTED DURING THE ABOVE PERIOD.
Terry Reilly
Senior Commodity Analyst – Grain and Oilseeds
Futures International
One Lincoln Center
18 W 140 Butterfield Rd.
Oakbrook Terrace, Il. 60181
W: 312.604.1366
ICE IM: treilly1
Skype: fi.treilly

Trading of futures, options, swaps and other derivatives is risky and is not suitable for all persons. All of these investment products are leveraged, and you can lose more than your initial deposit. Each investment product is offered only to and from jurisdictions where solicitation and sale are lawful, and in accordance with applicable laws and regulations in such jurisdiction. The information provided here should not be relied upon as a substitute for independent research before making your investment decisions. Futures International, LLC is merely providing this information for your general information and the information does not take into account any particular individual’s investment objectives, financial situation, or needs. All investors should obtain advice based on their unique situation before making any investment decision. The contents of this communication and any attachments are for informational purposes only and under no circumstances should they be construed as an offer to buy or sell, or a solicitation to buy or sell any future, option, swap or other derivative. The sources for the information and any opinions in this communication are believed to be reliable, but Futures International, LLC does not warrant or guarantee the accuracy of such information or opinions. Futures International, LLC and its principals and employees may take positions different from any positions described in this communication. Past results are not necessarily indicative of future results.