PDF attached
US Initial Jobless Claims May 13: 242K (est 251K; prev 264K)
US Continuing Claims May 6: 1799K (est 1820K; prevR 1807K)
WTI crude was 36 cents lower earlier and USD higher by about 42 points. US wheat and corn are lower on follow through selling after an agreement was reached to extend the Black Sea grain deal by 60 days. Russia said the deal was a “a qualified result.” The next issue that will be worked on will be easing restrictions on Russia’s state agricultural bank, and lifting restrictions on agricultural machinery & parts, insurance and reinsurance. Russia sees 2023-24 grain exports at 50-55 million tons, down from 55-60 million tons for 2022-23. The 2023 wheat crop was seen at 78 million tons. A freight train carrying grain derailed in Crimea, blocking shipments of grain to Sevastopol along the Black Sea shoreline. September Paris wheat fell 3.25 euros to 222.25 per tons. Day 2 of the Kansas wheat crop tour showed the average yield at 27.5 bu/ac, below 37 year ago. USDA is at 29.0 bu/ac for the entire state. Iraq said wheat reserves stand at 6 months of supply. South Korea’s MFG group seeks 70,000 tons of corn on May 18 for arrival around October 20. Soybean complex is again under pressure. Oil Share is seeing a reversal with July meal down about $6.10 and July SBO off 20 points. Japan bought 113,555 tons of food wheat.
Offshore values are delayed due to newswire(s) late release of Rotterdam prices
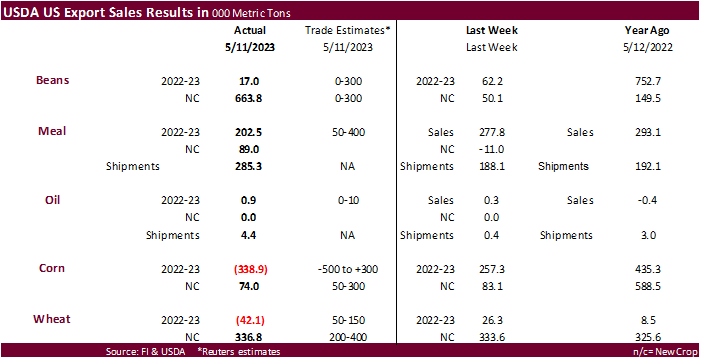
Overall export sales were poor for 2022-23 delivery. New-crop soybean sales were above expectations and within for all-wheat. 2022-23 soybean sales were only 17,000 tons while new-crop 663,800 tons (unknown destinations (390,000 MT) and China (187,000 MT). 202,500 tons of 2022-23 soybean meal sales included the Philippines and Columbia. Soybean oil sales were only 900 tons. Corn net sales reductions of 339,000 tons for 2022-23 was a marketing-year low. Increases primarily for Japan (35,500 MT), Colombia (18,900 MT), Guatemala (15,400 MT), and the Netherlands (15,000 MT), were more than offset by reductions primarily for China (271,200 MT), unknown destinations (85,600 MT), and Mexico (30,800 MT). All-wheat sales posted a net reduction of 42,100 tons and new crop of 336,800 tons were primarily for the Philippines, Mexico and unknown. Sorghum sales were 3,700 tons and pork at 31,900 tons (China 5,200).
Export Sales Highlights
This summary is based on reports from exporters for the period May 5-11, 2023.
Wheat: Net sales reductions of 42,100 metric tons (MT) for 2022/2023–a marketing-year low–were down noticeably from the previous week and from the prior 4-week average. Increases primarily for Nigeria (25,100 MT switched from unknown destinations), Colombia (7,700 MT, including 7,000 MT switched from unknown destinations), Taiwan (5,900 MT), the Philippines (2,300 MT), and Thailand (500 MT), were more than offset by reductions primarily for unknown destinations (53,000 MT), Mexico (17,600 MT), and Vietnam (12,000 MT). Net sales of 336,800 MT for 2023/2024 were primarily for the Philippines (80,000 MT), unknown destinations (78,500 MT), Mexico (64,200 MT), Taiwan (46,400 MT), and Japan (21,200 MT). Exports of 216,600 MT were up 6 percent from the previous week, but down 13 percent from the prior 4-week average. The destinations were primarily to Japan (47,400 MT), the Philippines (47,300 MT), Mexico (42,900 MT), Nigeria (25,100 MT), and Algeria (19,700 MT).
Corn: Net sales reductions of 339,000 MT for 2022/2023–a marketing-year low–were down noticeably from the previous week and from the prior 4-week average. Increases primarily for Japan (35,500 MT, including decreases of 6,800 MT), Colombia (18,900 MT, including decreases of 11,900 MT), Guatemala (15,400 MT, including 7,500 MT switched from Costa Rica, 6,200 MT switched from El Salvador, and decreases of 600 MT), the Netherlands (15,000 MT), and Germany (8,200 MT), were more than offset by reductions primarily for China (271,200 MT), unknown destinations (85,600 MT), Mexico (30,800 MT), Venezuela (27,700 MT), and Costa Rica (24,300 MT). Net sales of 74,000 MT for 2023/2024 were reported for Mexico (61,000 MT), Trinidad and Tobago (7,100 MT), Honduras (5,300 MT), and Guatemala (600 MT). Exports of 1,086,500 MT were down 5 percent from the previous week and 17 percent from the prior 4-week average. The destinations were primarily to Mexico (414,000 MT), China (409,900 MT), Japan (93,800 MT), the Dominican Republic (40,600 MT), and Costa Rica (22,200 MT).
Barley: No net sales or exports were reported for the week.
Sorghum: Total net sales reductions of 3,700 MT for 2022/2023–a marketing-year low–were down noticeably from the previous week and from the prior 4-week average. Decreases were for China. Exports of 53,100 MT were up 5 percent from the previous week, but down 24 percent from the prior 4-week average. The destination was to China.
Rice: Net sales reductions of 31,700 MT for 2022/2023–a marketing-year low–were down noticeably from the previous week and from the prior 4-week average. Increases primarily for Haiti (20,500 MT), Canada (15,000 MT, including decreases of 100 MT), Mexico (200 MT), Belgium (100 MT), and Guam (100 MT), were more than offset by reductions primarily for Iraq (40,000 MT) and Japan (27,200 MT). Net sales of 73,200 MT for 2023/2024 were reported for Iraq (40,000 MT), Japan (27,200 MT), and Guatemala (6,000 MT). Exports of 55,400 MT were up noticeably from the previous week and up 50 percent from the prior 4-week average. The destinations were primarily to Mexico (26,500 MT), El Salvador (12,500 MT), Haiti (6,900 MT), Guatemala (6,300 MT), and Canada (1,000 MT).
Soybeans: Net sales of 17,000 MT for 2022/2023 were down 73 percent from the previous week and 89 percent from the prior 4-week average. Increases primarily for Mexico (34,200 MT), unknown destinations (33,600 MT), Colombia (30,900 MT, including 7,000 MT switched from unknown destinations and decreases of 500 MT), Japan (11,700 MT, including decreases of 100 MT), and the Philippines (10,900 MT), were offset by reductions for China (119,200 MT), Costa Rica (16,300 MT), and Canada (300 MT). Net sales of 663,800 MT for 2023/2024 were reported for unknown destinations (390,000 MT), China (187,000 MT), Mexico (65,000 MT), Costa Rica (16,300 MT), and Panama (5,500 MT). Exports of 189,100 MT were down 54 percent from the previous week and 60 percent from the prior 4-week average. The destinations were primarily to Mexico (79,700 MT), Egypt (34,300 MT), the Philippines (11,900 MT), Indonesia (11,600 MT), and Venezuela (8,500 MT).
Optional Origin Sales: For 2022/2023, the current outstanding balance of 300 MT, all South Korea.
Export for Own Account: For 2022/2023, the current exports for own account outstanding balance of 1,600 MT are for Canada (1,400 MT) and Taiwan (200 MT).
Soybean Cake and Meal: Net sales of 202,500 MT for 2022/2023 were down 27 percent from the previous week, but up 7 percent from the prior 4-week average. Increases primarily for the Philippines (52,000 MT, including decreases of 200 MT), Colombia (27,700 MT), Guatemala (26,800 MT, including 12,000 MT switched from El Salvador), unknown destinations (25,000 MT), and Venezuela (18,900 MT, including 18,000 MT switched from Colombia), were offset by reductions primarily for Nicaragua (14,000 MT) and El Salvador (11,100 MT). Net sales of 89,000 MT for 2023/2024 were primarily for unknown destinations (45,000 MT) and New Zealand (30,000 MT). Exports of 285,300 MT were up 52 percent from the previous week and 24 percent from the prior 4-week average. The destinations were primarily to the Philippines (51,200 MT), Venezuela (46,400 MT), Tunisia (33,000 MT), Mexico (25,400 MT), and Guatemala (21,800 MT).
Soybean Oil: Net sales of 900 MT for 2022/2023 were up noticeably from the previous week, but down 77 percent from the prior 4-week average. Increases were primarily for Canada (400 MT). Exports of 4,400 MT were down noticeably from the previous week, but down 21 percent from the prior 4-week average. The destinations were to Jamaica (3,500 MT), Mexico (500 MT), and Canada (400 MT).
Cotton: Net sales of 132,400 RB for 2022/2023 were down 46 percent from the previous week and 28 percent from the prior 4-week average. Increases primarily for China (62,000 RB, including 1,100 RB switched from Singapore), Vietnam (24,000 RB, including 1,300 RB switched from Japan, 100 RB switched from Taiwan, and decreases of 800 RB), Pakistan (18,900 RB, including decreases of 900 RB), Turkey (7,600 RB), and Indonesia (5,200 RB, including 300 RB switched from Japan and decreases of 2,200 RB), were offset by reductions for Singapore (1,100 RB) and South Korea (100 RB). Net sales of 28,100 RB for 2023/2024 were reported for Bangladesh (12,000 RB), South Korea (6,600 RB), Turkey (4,400 RB), Indonesia (3,300 RB), and Thailand (1,800 RB). Exports of 332,700 RB were unchanged from the previous week, but down 7 percent from the prior 4-week average. The destinations were primarily to Pakistan (71,700 RB), China (64,500 RB), Vietnam (59,100 RB), Turkey (54,500 RB), and Bangladesh (17,200 RB). Net sales of Pima totaling 9,500 RB for 2022/2023 were down 38 percent from the previous week and 54 percent from the prior 4-week average. Increases were primarily for China (3,300 RB), Vietnam (2,600 RB), India (1,600 RB), Peru (1,300 RB), and Thailand (600 RB). Exports of 14,600 RB were down 28 percent from the previous week and 29 percent from the prior 4-week average. The destinations were primarily to China (5,700 RB), India (5,700 RB), Egypt (1,300 RB), Turkey (800 RB), and Indonesia (500 RB).
Optional Origin Sales: For 2022/2023, the current outstanding balance of 1,100 RB, all Malaysia.
Export for Own Account: For 2022/2023, the current exports for own account outstanding balance of 112,800 RB are for China (80,600 RB), Vietnam (22,100 RB), Pakistan (5,000 RB), South Korea (2,400 RB), India (1,500 RB), and Turkey (1,200 RB).
Hides and Skins: Net sales of 419,000 pieces for 2023 were down 30 percent from the previous week and 5 percent from the prior 4-week average. Increases primarily for China (282,000 whole cattle hides, including decreases of 7,100 pieces), Mexico (58,700 whole cattle hides, including decreases of 2,100 pieces), Brazil (32,100 whole cattle hides, including decreases of 400 pieces), South Korea (27,600 whole cattle hides, including decreases of 2,500 pieces), and Japan (7,200 whole cattle hides), were offset by reductions for Indonesia (100 pieces). Total net sales of 200 calf skins were for Italy. In addition, net sales of 8,300 kip skins resulting in increases for Belgium (8,700 kip skins), were offset by reductions for China (400 pieces). Exports of 346,400 pieces were down 6 percent from the previous week and 9 percent from the prior 4-week average. Whole cattle hides exports were primarily to China (225,300 pieces), South Korea (49,600 pieces), Mexico (44,700 pieces), Brazil (12,400 pieces), and Thailand (7,200 pieces). Exports of 2,500 kip skins were to China.
Net sales of 181,300 wet blues for 2023 were up noticeably from the previous week and 28 percent from the prior 4-week average. Increases were primarily for Italy (69,000 unsplit, including decreases of 100 unsplit), Brazil (30,000 unsplit), Taiwan (28,500 unsplit), Vietnam (25,200 unsplit, including decreases of 100 unsplit), and China (15,200 unsplit, including decreases of 1,200 unsplit). Exports of 124,200 wet blues were up 4 percent from the previous week and 13 percent from the prior 4-week average. The destinations were primarily to Vietnam (50,500 unsplit), Italy (30,400 unsplit), China (13,100 unsplit), Hong Kong (8,000 unsplit), and Thailand (7,500 unsplit). Net sales of 4,500 splits resulting in increases for Vietnam (6,400 pounds) and South Korea (2,300 pounds), were offset by reductions for Taiwan (4,200 pounds). Exports of 152,100 pounds were to Vietnam (115,300 pounds) and Taiwan (36,800 pounds).
Beef: Net sales of 17,400 MT for 2023 were up 5 percent from the previous week and 7 percent from the prior 4-week average. Increases primarily for Japan (4,600 MT, including decreases of 300 MT), South Korea (3,500 MT, including decreases of 400 MT), China (2,900 MT, including decreases of 100 MT), Mexico (2,500 MT), and Taiwan (1,600 MT, including decreases of 100 MT), were offset by reductions for Indonesia (200 MT) and Chile (100 MT). Exports of 18,300 MT were up 24 percent from the previous week and 11 percent from the prior 4-week average. The destinations were primarily to South Korea (4,600 MT), Japan (3,800 MT), China (3,400 MT), Taiwan (2,000 MT), and Mexico (1,300 MT).
Pork: Net sales of 31,900 MT for 2023 were up 6 percent from the previous week, but down 25 percent from the prior 4-week average. Increases were primarily for Mexico (15,500 MT, including decreases of 300 MT), China (5,200 MT, including decreases of 200 MT), Japan (2,700 MT, including decreases of 300 MT), Colombia (1,600 MT, including decreases of 100 MT), and Canada (1,000 MT, including decreases of 1,000 MT). Exports of 36,800 MT were unchanged from the previous week and from the prior 4-week average. The destinations were primarily to Mexico (15,400 MT), China (6,600 MT), Japan (4,100 MT), South Korea (3,100 MT), and Canada (2,100 MT).
May 18, 2023 1 FOREIGN AGRICULTURAL SERVICE/USDA
U.S. EXPORT SALES FOR WEEK ENDING 5/11/2023
|
|
CURRENT MARKETING YEAR |
NEXT MARKETING YEAR |
||||||
|
COMMODITY |
NET SALES |
OUTSTANDING SALES |
WEEKLY EXPORTS |
ACCUMULATED EXPORTS |
NET SALES |
OUTSTANDING SALES |
||
|
CURRENT YEAR |
YEAR AGO |
CURRENT YEAR |
YEAR AGO |
|||||
|
|
THOUSAND METRIC TONS |
|||||||
|
WHEAT |
|
|
|
|
|
|
|
|
|
HRW |
-10.5 |
386.5 |
592.0 |
86.0 |
4,723.1 |
6,883.2 |
90.6 |
371.5 |
|
SRW |
-27.2 |
315.6 |
200.2 |
24.8 |
2,584.5 |
2,678.1 |
98.5 |
751.8 |
|
HRS |
2.0 |
680.2 |
553.7 |
50.9 |
5,073.9 |
4,968.9 |
79.8 |
524.7 |
|
WHITE |
-5.7 |
508.2 |
232.8 |
35.2 |
4,162.5 |
3,133.4 |
67.8 |
277.5 |
|
DURUM |
-0.8 |
92.1 |
0.5 |
19.7 |
359.8 |
195.5 |
0.0 |
36.9 |
|
TOTAL |
-42.1 |
1,982.6 |
1,579.1 |
216.6 |
16,903.9 |
17,859.1 |
336.8 |
1,962.4 |
|
BARLEY |
0.0 |
3.5 |
5.2 |
0.0 |
8.5 |
15.3 |
0.0 |
6.0 |
|
CORN |
-339.0 |
10,451.4 |
16,004.8 |
1,086.5 |
27,603.2 |
42,899.5 |
74.0 |
2,700.4 |
|
SORGHUM |
-3.7 |
437.4 |
1,421.9 |
53.1 |
1,202.8 |
5,343.6 |
0.0 |
63.0 |
|
SOYBEANS |
17.0 |
3,112.8 |
10,487.5 |
189.1 |
47,669.8 |
48,720.7 |
663.8 |
2,550.6 |
|
SOY MEAL |
202.5 |
2,497.7 |
2,709.5 |
285.3 |
7,725.3 |
7,651.9 |
89.0 |
404.4 |
|
SOY OIL |
0.9 |
56.4 |
107.1 |
4.4 |
62.2 |
558.2 |
0.0 |
0.6 |
|
RICE |
|
|
|
|
|
|
|
|
|
L G RGH |
-0.9 |
135.4 |
139.7 |
44.3 |
570.9 |
1,101.2 |
6.0 |
6.0 |
|
M S RGH |
0.0 |
33.2 |
8.6 |
0.5 |
23.8 |
12.3 |
0.0 |
5.0 |
|
L G BRN |
0.2 |
3.5 |
5.3 |
0.2 |
17.3 |
48.3 |
0.0 |
0.0 |
|
M&S BR |
0.0 |
21.2 |
9.9 |
0.0 |
23.8 |
77.5 |
0.0 |
0.0 |
|
L G MLD |
-10.6 |
118.5 |
74.3 |
8.1 |
569.9 |
663.3 |
40.0 |
40.0 |
|
M S MLD |
-20.4 |
90.1 |
197.3 |
2.1 |
222.8 |
319.7 |
27.2 |
40.2 |
|
TOTAL |
-31.7 |
401.8 |
435.1 |
55.4 |
1,428.6 |
2,222.3 |
73.2 |
91.2 |
|
COTTON |
|
THOUSAND RUNNING BALES |
||||||
|
UPLAND |
132.4 |
3,719.3 |
5,561.5 |
332.7 |
8,912.3 |
9,300.3 |
28.1 |
1,524.2 |
|
PIMA |
9.5 |
83.9 |
100.3 |
14.6 |
223.3 |
371.7 |
0.0 |
4.7 |
| Terry Reilly Senior Commodity Analyst – Grain and Oilseeds |
| Futures International One Lincoln Center 18W140 Butterfield Rd. Suite 1450 Oakbrook terrace, Il. 60181 |
| Work: 312.604.1366 ICE IM: treilly1 Skype IM: fi.treilly |
| treilly@futures-int.com
|
| DISCLAIMER: The contents of this communication and any attachments are for informational purposes only and under no circumstances should they be construed as an offer to buy or sell, or a solicitation to buy or sell any future, option, swap or other derivative. The sources for the information and any opinions in this communication are believed to be reliable, but Futures International, LLC does not warrant or guarantee the accuracy of such information or opinions. This communication may contain links to third party websites which are not under the control of FI and FI is not responsible for their content. Trading of futures, options, swaps and other derivatives is risky and is not suitable for all persons. All of these investment products are leveraged, and you can lose more than your initial deposit. Each investment product is offered only to and from jurisdictions where solicitation and sale are lawful, and in accordance with applicable laws and regulations in such jurisdiction. The information provided here should not be relied upon as a substitute for independent research before making your investment decisions. Futures International, LLC is merely providing this information for your general information and the information does not take into account any particular individual’s investment objectives, financial situation, or needs. All investors should obtain advice based on their unique situation before making any investment decision. Futures International, LLC and its principals and employees may take positions different from any positions described in this communication. Past results are not necessarily indicative of future results. |