PDF attached
USDA export sales
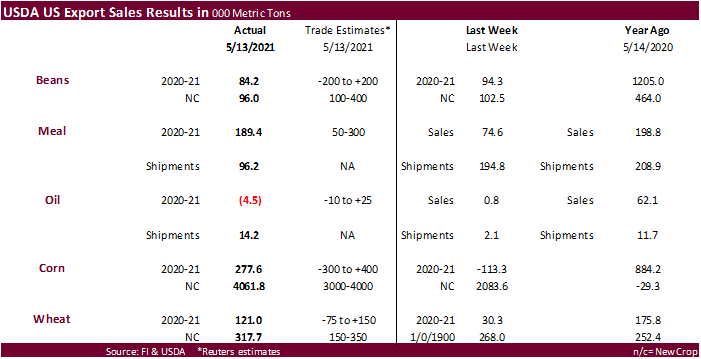
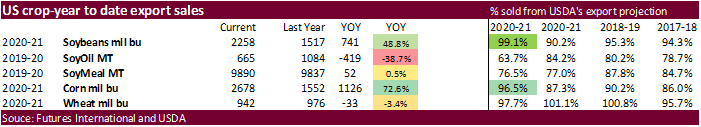
New-crop corn sales were likely a record for around this time of year at 4,061,800 MT and were primarily for China (3,740,000 MT) and Mexico (199,800 MT). Old crop sales for corn and soybeans continue to wane with corn at 277,600 tons (some looking for net reductions) and soybeans at 84.2 million tons. Note current crop year weekly corn exports were a marketing year high of 2,239,900 MT. New-crop soybean sales were only 96,000 tons. Soybean meal sales were 189,400 tons and soybean oil sales were a net reduction of 4,500 tons. Old crop wheat sales were good at 121,000 tons as we wind down the year, and new-crop was 317,700 tons, an improvement from the previous week. Beef net export sales were a marketing year high of 56,900 MT with bulk of countries included the Netherlands (33,700 MT), China (9,200 MT), and Japan (5,900 MT, including decreases of 500 MT). Pork net export sales were 19,000 MT.
This summary is based on reports from exporters for the period May 7-May 13, 2021.
Wheat: Net sales of 121,000 metric tons (MT) for 2020/2021 were up noticeably from the previous week and up 21 percent from the prior 4-week average. Increases primarily for Indonesia (66,500 MT, including 6,500 MT switched from Vietnam), Nigeria (60,100 MT, including 60,000 MT switched from unknown destinations and decreases of 2,300 MT), Mexico (54,500 MT, including decreases of 400 MT), Nicaragua (30,000 MT, switched from unknown destinations), and the Dominican Republic (15,300 MT, including 14,600 MT switched from unknown destinations), were offset by reductions primarily for unknown destinations (118,900 MT). For 2021/2022, net sales of 317,700 MT were primarily for unknown destinations (123,300 MT), Japan (60,800 MT), Mexico (39,600 MT), the Philippines (33,000 MT), and Taiwan (30,300 MT). Exports of 568,600 MT were up 9 percent from the previous week and 3 percent from the prior 4-week average. The destinations were primarily to the Philippines (110,900 MT), Nigeria (106,100 MT), China (68,200 MT), South Korea (56,900 MT), and Japan (55,200 MT).
Optional Origin Sales: For 2020/2021, the current outstanding balance of 63,900 MT is for Spain.
Corn: Net sales of 277,600 MT for 2020/2021 were down noticeably from the previous week, but up 19 percent from the prior 4-week average. Increases primarily for Mexico (294,100 MT, including 24,000 MT switched from unknown destinations and decreases of 12,600 MT), Japan (65,300 MT, including 7,400 MT switched from unknown destinations and decreases of 4,600 MT), South Korea (64,600 MT, including 68,000 MT switched from unknown destinations and decreases of 3,400 MT), Venezuela (41,500 MT, including 16,500 MT switched from unknown destinations), and Panama (21,300 MT), were offset by reductions primarily for unknown destinations (195,300 MT). For 2021/2022, net sales of 4,061,800 MT primarily for China (3,740,000 MT) and Mexico (199,800 MT), were offset by reductions for Nicaragua (31,200 MT). Exports of 2,239,900 MT–a marketing-year high– were up 45 percent from the previous week and 23 percent from the prior 4-week average. The destinations were primarily to China (1,009,700 MT), Mexico (467,100 MT), Japan (310,900 MT), Colombia (113,000 MT), and Israel (111,200 MT).
Optional Origin Sales: For 2020/2021, the current outstanding balance of 268,500 MT is for unknown destinations (189,500 MT) and South Korea (79,000 MT).
Late Reporting: For 2020/2021, exports totaling 16,500 MT of corn were reported late to Venezuela.
Barley: No net sales were reported for the week. Exports of 600 MT were up 68 percent from the previous week and 40 percent from the prior 4-week average. The destination was to South Korea.
Sorghum: Net sales of 119,800 MT for 2020/2021 were up 69 percent from the previous week and up noticeably from the prior 4-week average. Increases were for China (119,800 MT, including decreases of 5,200 MT). Total net sales for 2021/2022, of 53,000 MT were for China. Exports of 59,800 MT were down 68 percent from the previous week and 72 percent from the prior 4-week average. The destination was to China.
Rice: Net sales of 96,200 MT for 2020/2021 were up noticeably from the previous week and up 98 percent from the prior 4-week average. Increases were primarily for Mexico (42,300 MT), Venezuela (28,500 MT), Haiti (18,200 MT), Canada (3,400 MT), and Saudi Arabia (1,800 MT). Total net sales for 2021/2022, of 700 MT were for Guatemala. Exports of 69,400 MT were up noticeably from the previous week, but down 15 percent from the prior 4-week average. The destinations were primarily to Venezuela (56,300 MT), South Korea (3,100 MT), Mexico (2,500 MT), Canada (2,200 MT), and Japan (1,200 MT).
Exports for Own Account: For 2020/2021, new exports for own account totaling 100 MT were for Canada. The current exports for own account outstanding balance is 100 MT, all Canada.
Soybeans: Net sales of 84,200 MT for 2020/2021 were down 11 percent from the previous week and 45 percent from the prior 4-week average. Increases primarily for Japan (57,800 MT, including 42,300 MT switched from unknown destinations and decreases of 1,300 MT), Egypt (55,000 MT, including 50,000 MT switched from unknown destinations), South Korea (25,800 MT, including 25,000 MT switched from unknown destinations), Vietnam (12,600 MT, including decreases of 100 MT), and Canada (12,200 MT), were offset by reductions primarily for unknown destinations (101,300 MT). For 2021/2022, net sales of 96,000 MT were primarily for Mexico (47,500 MT) and unknown destinations (47,500 MT). Exports of 335,600 MT were up 18 percent from the previous week and 20 percent from the prior 4-week average. The destinations were primarily to Mexico (103,400 MT), Japan (67,600 MT), Egypt (55,000 MT), Indonesia (30,900 MT), and South Korea (26,000 MT).
Exports for Own Account: For 2020/2021, the current exports for own account outstanding balance is 5,800 MT, all Canada.
Late Reporting: For 2020/2021, exports totaling 6,000 MT of soybeans were reported late to Venezuela.
Soybean Cake and Meal: Net sales of 189,400 MT for 2020/2021 were up noticeably from the previous week and up 34 percent from the prior 4-week average. Increases primarily for Canada (41,700 MT, including decreases of 600 MT), Ecuador (30,000 MT), Morocco (25,000 MT), Guatemala (23,900 MT, including decreases of 800 MT), and Mexico (21,600 MT, including decreases of 100 MT), were offset by reductions primarily for Nicaragua (5,000 MT) and Belgium (800 MT). For 2021/2022, net sales of 77,600 MT were for Mexico (24,900 MT), Honduras (15,100 MT), El Salvador (14,600 MT), Guatemala (14,000 MT), and Costa Rica (9,000 MT). Exports of 96,200 MT were down 51 percent from the previous week and from the prior 4-week average. The destinations were primarily to Mexico (28,100 MT), Canada (18,500 MT), Guatemala (14,400 MT), Morocco (6,500 MT), and Honduras (5,100 MT).
Soybean Oil: Net sales reductions of 4,500 MT for 2020/2021–a marketing year low– were down noticeably from the previous week and from the prior 4-week average. Increases reported for Canada (800 MT) and Mexico (100 MT), were more than offset by reductions for Nicaragua (2,200 MT), El Salvador (2,100 MT), Trinidad and Tobago (700 MT), and Guatemala (500 MT). Exports of 14,200 MT were up noticeably from the previous week and up 25 percent from the prior 4-week average. The destinations were primarily to Guatemala (8,000 MT) and Venezuela (5,000 MT).
Cotton: Net sales of 108,000 RB for 2020/2021 were up 99 percent from the previous week and 45 percent from the prior 4-week average. Increases primarily for China (24,800 RB, including decreases of 9,500 RB), Turkey (23,300 RB, including decreases of 1,300 RB), Vietnam (20,800 RB, including decreases of 1,800 RB), Pakistan (14,300 RB), and Taiwan (6,100 RB), were offset by reductions for El Salvador (3,500 RB). For 2021/2022, net sales of 21,800 RB were primarily for Turkey (6,600 RB), Peru (5,600 RB), El Salvador (4,800 RB), Pakistan (2,200 RB), and Thailand (1,400 RB). Exports of 345,400 RB were up 25 percent from the previous week, but down 2 percent from the prior 4-week average. Exports were primarily to Vietnam (101,100 RB), China (59,400 RB), Pakistan (43,000 RB), Turkey (37,000 RB), and Mexico (20,800 RB). Net sales of Pima totaling 8,100 RB were up noticeably from the previous week and up 21 percent from the prior 4-week average. Increases primarily for India (4,700 RB), Thailand (1,100 RB), Turkey (900 RB), Vietnam (800 RB), and Peru (400 RB), were offset by reductions for Japan (300 RB) and the United Kingdom (200 RB). Total net sales for 2021/2022 of 100 RB were for Thailand. Exports of 7,700 RB were down 60 percent from the previous week and 61 percent from the prior 4-week average. The destinations were primarily to India (1,600 RB), Austria (1,300 RB), Vietnam (1,200 RB), China (900 RB), and Peru (500 RB).
Exports for Own Account: For 2020/2021, the current exports for own account outstanding balance of 17,500 RB is for Vietnam (9,500 RB), China (7,600 RB), and Bangladesh (400 RB).
Hides and Skins: Net sales of 246,000 pieces for 2021 were down 36 percent from the previous week and 23 percent from the prior 4-week average. Increases primarily for China (164,400 whole cattle hides, including decreases of 3,600 pieces), South Korea (46,600 whole cattle hides, including decreases of 1,700 pieces), Mexico (19,200 whole cattle hides, including decreases of 900 pieces), Thailand (11,400 whole cattle hides, including decreases of 700 pieces), and Taiwan (3,000 whole cattle hides, including decreases of 100 pieces), were offset by reductions for Indonesia (400 pieces) and Spain (100 pieces). Total net sales reductions of 300 kip skins were for Belgium. Exports of 329,700 pieces were down 23 percent from the previous week and 18 percent from the prior 4-week average. Whole cattle hides exports were primarily to China (180,300 pieces), South Korea (65,000 pieces), Thailand (25,700 pieces), Mexico (22,300 pieces), and Brazil (9,900 pieces). Exports of 2,600 kip skins were to Belgium.
Net sales of 48,300 wet blues for 2021 were down 27 percent from the previous week and 61 percent from the prior 4-week average. Increases primarily for Italy (21,400 unsplit, including decreases of 300 unsplit), China (8,900 unsplit), Vietnam (8,800 unsplit, including decreases of 100 unsplit), Mexico (4,100 unsplit and 100 grain splits, including decreases of 1,000 unsplit), and Brazil (3,600 unsplit), were offset by reductions for Thailand (300 unsplit). Exports of 140,500 wet blues were down 2 percent from the previous week, but unchanged from the prior 4-week average. The destinations were primarily to Italy (38,500 unsplit and 9,000 grain splits), Vietnam (35,100 unsplit), China (31,400 unsplit), Thailand (16,700 unsplit), and Mexico (2,600 unsplit and 1,900 grain split). Net sales of 118,100 splits resulting in increases for Taiwan (129,000 pounds) and China (1,400 pounds, including decreases of 4,000 pounds), were offset by reductions for Vietnam (12,300 pounds). Exports of 522,900 pounds were to Vietnam (278,200 pounds) and China (244,700 pounds).
Beef: Net sales of 56,900 MT reported for 2021–a marketing-year high–were up noticeably from the previous week and from the prior 4-week average. Increases primarily for the Netherlands (33,700 MT), China (9,200 MT), Japan (5,900 MT, including decreases of 500 MT), South Korea (4,500 MT, including decreases of 300 MT), and Taiwan (2,200 MT, including decreases of 100 MT), were offset by reductions for Belgium (100 MT). Exports of 53,100 MT–a marketing-year high–were up noticeably from the previous week and from the prior 4-week average. The destinations were primarily to the Netherlands (33,700 MT), Japan (5,900 MT), South Korea (5,100 MT), China (2,900 MT), and Taiwan (1,400 MT).
Pork: Net sales of 19,000 MT reported for 2021 were up 29 percent from the previous week, but down 1 percent from the prior 4-week average. Increases were primarily for Mexico (8,300 MT, including decreases of 700 MT), Japan (3,600 MT, including decreases of 200 MT), China (3,100 MT, including decreases of 700 MT), Canada (1,000 MT, including decreases of 500 MT), and South Korea (1,000 MT, including decreases of 500 MT), were offset by reduction primarily for Australia (200 MT) and New Zealand (100 MT). Exports of 34,600 MT were down 17 percent from the previous week and 24 percent from the prior 4-week average. The destinations were primarily to China (11,100 MT), Mexico (10,600 MT), Japan (4,500 MT), South Korea (2,400 MT), and Canada (1,100 MT).
May 20, 2021 1 FOREIGN AGRICULTURAL SERVICE/USDA
U.S. EXPORT SALES FOR WEEK ENDING 5/13/2021
FAX 202-690-3275
|
|
CURRENT MARKETING YEAR |
NEXT MARKETING YEAR |
||||||
|
COMMODITY |
NET SALES |
OUTSTANDING SALES |
WEEKLY EXPORTS |
ACCUMULATED EXPORTS |
NET SALES |
OUTSTANDING SALES |
||
|
CURRENT YEAR |
YEAR AGO |
CURRENT YEAR |
YEAR AGO |
|||||
|
|
THOUSAND METRIC TONS |
|||||||
|
WHEAT |
|
|
|
|
|
|
|
|
|
HRW |
32.0 |
584.2 |
1,170.2 |
130.3 |
8,132.3 |
8,768.4 |
155.1 |
1,058.4 |
|
SRW |
39.4 |
186.3 |
193.8 |
61.6 |
1,689.0 |
2,254.9 |
13.3 |
781.0 |
|
HRS |
47.7 |
685.3 |
1,185.7 |
237.4 |
7,066.2 |
6,688.9 |
68.8 |
973.5 |
|
WHITE |
1.8 |
569.9 |
742.1 |
139.3 |
6,055.2 |
4,567.8 |
79.5 |
756.0 |
|
DURUM |
0.0 |
48.6 |
100.8 |
0.0 |
631.8 |
883.3 |
1.0 |
8.4 |
|
TOTAL |
121.0 |
2,074.3 |
3,392.6 |
568.6 |
23,574.6 |
23,163.3 |
317.7 |
3,577.3 |
|
BARLEY |
0.0 |
2.1 |
9.8 |
0.6 |
26.5 |
40.3 |
0.0 |
22.2 |
|
CORN |
277.6 |
20,733.8 |
12,804.5 |
2,239.9 |
47,287.4 |
26,606.6 |
4,061.8 |
8,936.6 |
|
SORGHUM |
119.8 |
1,581.3 |
1,282.8 |
59.8 |
5,767.8 |
2,389.7 |
53.0 |
1,244.0 |
|
SOYBEANS |
84.2 |
4,513.6 |
6,406.7 |
335.6 |
56,949.7 |
34,890.4 |
96.0 |
7,022.0 |
|
SOY MEAL |
189.4 |
2,092.3 |
2,250.5 |
96.2 |
7,797.2 |
7,586.6 |
77.6 |
560.3 |
|
SOY OIL |
-4.5 |
58.0 |
296.3 |
14.2 |
607.0 |
787.8 |
0.0 |
0.6 |
|
RICE |
|
|
|
|
|
|
|
|
|
L G RGH |
58.9 |
260.5 |
262.2 |
57.8 |
1,359.1 |
1,186.7 |
0.7 |
0.7 |
|
M S RGH |
12.0 |
16.9 |
37.2 |
0.5 |
24.0 |
59.2 |
0.0 |
0.0 |
|
L G BRN |
0.1 |
2.7 |
20.5 |
0.2 |
36.4 |
46.4 |
0.0 |
0.0 |
|
M&S BR |
0.4 |
45.4 |
56.9 |
0.5 |
110.2 |
59.2 |
0.0 |
0.0 |
|
L G MLD |
19.9 |
44.4 |
66.2 |
3.3 |
531.7 |
760.6 |
0.0 |
0.0 |
|
M S MLD |
4.8 |
219.0 |
178.9 |
7.0 |
454.2 |
531.8 |
0.0 |
0.0 |
|
TOTAL |
96.2 |
588.8 |
622.0 |
69.4 |
2,515.6 |
2,643.9 |
0.7 |
0.7 |
|
COTTON |
|
THOUSAND RUNNING BALES |
||||||
|
UPLAND |
108.0 |
3,468.9 |
5,481.1 |
345.4 |
11,906.5 |
10,810.1 |
21.8 |
1,828.9 |
|
PIMA |
8.1 |
169.1 |
136.5 |
7.7 |
615.6 |
410.2 |
0.1 |
4.0 |
Terry Reilly
Senior Commodity Analyst – Grain and Oilseeds
Futures International
One Lincoln Center
18 W 140 Butterfield Rd.
Oakbrook Terrace, Il. 60181
W: 312.604.1366
ICE IM: treilly1
Skype: fi.treilly

Trading of futures, options, swaps and other derivatives is risky and is not suitable for all persons. All of these investment products are leveraged, and you can lose more than your initial deposit. Each investment product is offered only to and from jurisdictions where solicitation and sale are lawful, and in accordance with applicable laws and regulations in such jurisdiction. The information provided here should not be relied upon as a substitute for independent research before making your investment decisions. Futures International, LLC is merely providing this information for your general information and the information does not take into account any particular individual’s investment objectives, financial situation, or needs. All investors should obtain advice based on their unique situation before making any investment decision. The contents of this communication and any attachments are for informational purposes only and under no circumstances should they be construed as an offer to buy or sell, or a solicitation to buy or sell any future, option, swap or other derivative. The sources for the information and any opinions in this communication are believed to be reliable, but Futures International, LLC does not warrant or guarantee the accuracy of such information or opinions. Futures International, LLC and its principals and employees may take positions different from any positions described in this communication. Past results are not necessarily indicative of future results.