PDF attached
US Weekly Initial Jobless Claims Jun 19: 411K (est 380K; prev 412K)
US Continuing Claims Jun 12: 3390K (est 3460K; prevR 3534K; prev 3518K)
US Durable Goods Orders May P: 2.3% (est 2.8%; prevR -0.8%; prev -1.3%)
US Durable Goods Ex-Transportation May P: 0.3% (est 0.7%; prevR 1.7%; prev 1.0%)
US Cap Goods Orders Nondef Ex-Air May P: -0.1% (est 0.6%; prevR 2.7%; prev 2.2%)
US Cap Goods Ship Nondef Ex-Air May P: 0.9% (est 0.8%; prevR 1.0%; prev 0.9%)
US GDP Annualized (Q/Q) Q1 T: 6.4% (est 6.4%; prev 6.45)
US GDP Price Index Q1 T: 4.3% (est 4.3%; prev 4.3%)
US Core PCE (Q/Q) Q1 T: 2.5% (est 2.5%; prev 2.5%)
US Advance Goods Trade Balance (USD) May: -88.1B (est -87.5B; prevR -85.7B; prev -85.2B)
US Retail Inventories (M/M) May: -0.8% (est -0.5%; prev 1.6%)
US Wholesale Inventories (M/M) May P: 1.1% (est 0.8%; prevR 1.0%; prev 0.8%)
US Personal Consumption Q1 T: 11.4% (est 11.4%; prev 11.3%)
Canada Wholesale Sales Rise 1.1% In May – StatCcan Flash
Canada Factory Sales Rise 1.0% In May- StatCan Flash
Canada Non-Farm Payrolls Rose 166.9K In April To 16.3 Mln
Soybean meal sales of 387,600 tons exceeded expectations and included increases primarily for the Philippines (146,500 MT), Ecuador (109,800 MT, including decreases of 16,800 MT), Italy (30,000 MT), Honduras (20,300 MT), and El Salvador (19,500 MT, including 5,800 MT switched from Guatemala and 2,700 MT switched from Nicaragua). Soybean export sales were 141,700 tons old crop and only 47,300 tons new crop. China bought a cargo of old crop soybeans. Look for new-crop soybean sales to increase next week after China shopped around. Soybean oil sales were 2,400 tons and shipments low at 6,800 tons. Corn sales were 216,300 tons old and 310,800 tons new. Combined they were ok. Corn sales for old crop included a lot of switches, including China (180,100 MT, including 132,000 MT switched from unknown destinations). Corn new crop included 242,800 tons for unknown. All wheat sales were within expectations at 374,200 tons.
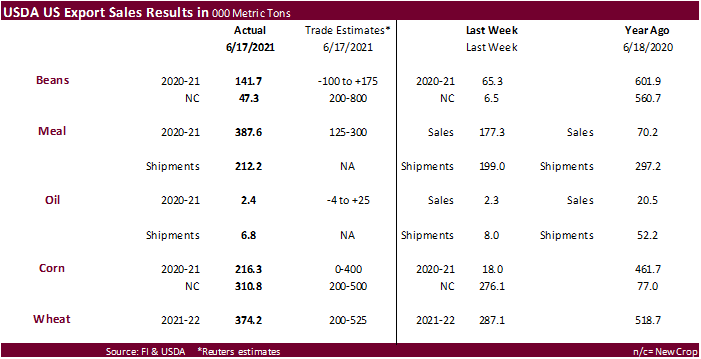
This summary is based on reports from exporters for the period June 11-June 17, 2021.
Wheat: Net sales of 374,100 metric tons (MT) were reported for delivery in marketing year 2021/2022. Increases primarily for unknown destinations (110,600 MT), Mexico (94,500 MT, including decreases of 100 MT), Nigeria (76,600 MT), Japan (73,000 MT, including decreases of 500 MT), and the Dominican Republic (15,100 MT, including 14,400 MT switched from unknown destinations), were offset by reductions primarily for the Philippines (7,400 MT) and Guatemala (3,300 MT). Exports of 590,800 MT were primarily to the Philippines (154,600 MT), Mexico (112,700 MT), Nigeria (81,000 MT), Japan (67,200 MT), and Thailand (58,500 MT).
Corn: Net sales of 216,300 MT for 2020/2021 were up noticeably from the previous week, but down 33 percent from the prior 4-week average. Increases primarily for China (180,100 MT, including 132,000 MT switched from unknown destinations, 70,300 MT switched from Taiwan, and decreases of 30,100 MT), Japan (149,100 MT, including 99,200 MT switched from unknown destinations and decreases of 2,100 MT), Mexico (102,500 MT, including decrease of 20,600 MT), El Salvador (34,200 MT, including 18,400 MT switched from Guatemala and 8,300 MT switched from Nicaragua), and Honduras (22,400 MT, including decreases of 22,200 MT), were offset by reductions primarily for unknown destinations (205,800 MT) and Taiwan (70,100 MT). For 2021/2022, net sales of 310,800 MT primarily for unknown destinations (242,800 MT) and Japan (50,000 MT), were offset by reductions for Mexico (30,000 MT). Exports of 1,689,700 MT were up 2 percent from the previous week, but down 7 percent from the prior 4-week average. The destinations were primarily to China (1,068,100 MT), Mexico (332,500 MT), Japan (139,800 MT), Guatemala (45,300 MT), and El Salvador (29,200 MT).
Optional Origin Sales: For 2020/2021, the current outstanding balance of 30,500 MT is for unknown destinations. For 2021/2022, the current outstanding balance of 60,000 MT is for unknown destinations.
Barley: No net sales were reported for the week. Exports of 1,000 MT were to Japan (600 MT) and South Korea (400 MT).
Sorghum: No net sales or exports were reported for the week.
Rice: Net sales of 78,000 MT for 2020/2021 were up noticeably from the previous week and from the prior 4-week average. Increases primarily for Mexico (31,400 MT), Venezuela (26,000 MT), Haiti (12,200 MT), Jordan (3,200 MT), and Canada (1,700 MT), were offset by reductions for El Salvador (500 MT). Exports of 42,700 MT were down 45 percent from the previous week and 32 percent from the prior 4-week average. The destinations were primarily to South Korea (24,800 MT), Mexico (7,400 MT), Japan (2,700 MT), Canada (2,400 MT), and Saudi Arabia (1,900 MT).
Soybeans: Net sales of 141,700 MT for 2020/2021 were up noticeably from the previous week and from the prior 4-week average. Increases primarily for Japan (83,700 MT, including 48,000 MT switched from unknown destinations), Indonesia (66,200 MT, including 55,000 MT switched from unknown destinations and decreases of 1,500 MT), China (66,000 MT), Malaysia (9,300 MT, including decreases of 100 MT), and Vietnam (8,900 MT), were offset by reductions for unknown destinations (103,000 MT). For 2021/2022, net sales of 47,300 MT primarily for Mexico (54,400 MT), unknown destinations (52,100 MT), Malaysia (6,000 MT), and Canada (500), were offset by reductions for China (66,000 MT). Exports of 243,200 MT were up 64 percent from the previous week and 3 percent from the prior 4-week average. The destinations were primarily to Indonesia (88,300 MT), Mexico (65,200 MT), Japan (53,300 MT), Canada (13,900 MT), and Vietnam (8,200 MT).
Exports for Own Account: For 2020/2021, the current exports for own account outstanding balance is 5,800 MT, all Canada.
Soybean Cake and Meal: Net sales of 387,600 MT for 2020/2021 were up noticeably from the previous week and from the prior 4-week average. Increases primarily for the Philippines (146,500 MT), Ecuador (109,800 MT, including decreases of 16,800 MT), Italy (30,000 MT), Honduras (20,300 MT), and El Salvador (19,500 MT, including 5,800 MT switched from Guatemala and 2,700 MT switched from Nicaragua), were offset by reductions primarily for Guatemala (4,200 MT) and Belgium (1,200 MT). For 2021/2022, net sales of 22,000 MT were for unknown destinations (19,000 MT) and the Philippines (3,000 MT). Exports of 212,200 MT were up 7 percent from the previous week, but down 1 percent from the prior 4-week average. The destinations were primarily to the Philippines (53,400 MT), Ecuador (32,300 MT), Canada (25,600 MT), Venezuela (16,500 MT), and Guatemala (14,500 MT).
Soybean Oil: Net sales of 2,400 MT for 2020/2021 were up 8 percent from the previous week and 17 percent from the prior 4-week average. Increases were reported for Mexico (1,300 MT), Canada (1,000 MT), and India (100 MT). Exports of 6,800 MT were down 15 percent from the previous week and 26 percent from the prior 4-week average. The destinations were primarily to Jamaica (4,000 MT) and Canada (1,500 MT).
Cotton: Net sales of 74,700 RB for 2020/2021 were down 33 percent from the previous week and 48 percent from the prior 4-week average. Increases primarily for Pakistan (36,500 RB), China (14,000 RB, including decreases of 14,100 RB), Peru (10,200 RB), Vietnam (7,100 RB, including 1,400 RB switched from Japan), and Bangladesh (4,600 RB), were offset by reductions for Singapore (4,600 RB) and Japan (1,100 RB). For 2021/2022, net sales of 148,900 RB primarily for Pakistan (93,900 RB), Vietnam (26,300 RB), Peru (17,100 RB), Mexico (9,500 RB), and Guatemala (5,300 RB), were offset by reductions for China (7,900 RB). Exports of 206,000 RB were down 32 percent from the previous week and 34 percent from the prior 4-week average. Exports were primarily to Vietnam (39,600 RB), China (38,800 RB), Pakistan (34,900 RB), Turkey (30,800 RB), and Bangladesh (16,600 RB). Net sales of Pima totaling 9,100 RB were up noticeably from the previous week and up 39 percent from the prior 4-week average. Increases were primarily for India (6,500 RB), Peru (900 RB), Bangladesh (600 RB), Turkey (600 RB), and China (400 RB). Exports of 15,000 RB were up 25 percent from the previous week, but unchanged from the prior 4-week average. The destinations were primarily to India (7,700 RB), China (2,200 RB), Peru (1,800 RB), Turkey (1,100 RB), and Thailand (800 RB).
Exports for Own Account: For 2020/2021, the current exports for own account outstanding balance of 11,100 RB is for China (6,200 RB), Vietnam (4,500 RB), and Bangladesh (400 RB).
Hides and Skins: Net sales of 388,400 pieces for 2021 were up 61 percent from the previous week, but down 1 percent from the prior 4-week average. Increases primarily for China (294,500 whole cattle hides, including decreases of 2,500 pieces), South Korea (40,900 whole cattle hides, including decreases of 900 pieces), Mexico (21,100 whole cattle hides, including decreases of 500 pieces), Thailand (9,300 whole cattle hides, including decreases of 700 pieces), and Brazil (6,200 whole cattle hides, including decreases of 100 pieces), were offset by reductions for Japan (900 pieces). Total net sales reductions of 200 calf skins were reported for Italy. In addition, total net sales of 5,600 kip skins were reported for Belgium. Exports of 343,900 pieces were down 3 percent from the previous week and 8 percent from the prior 4-week average. Whole cattle hides exports were primarily to China (202,000 pieces), South Korea (58,500 pieces), Mexico (29,600 pieces), Thailand (25,400 pieces), and Taiwan (13,600 pieces). In addition, exports of 1,800 calf skins were to Italy.
Net sales of 208,400 wet blues for 2021 were up noticeably from the previous week and up 50 percent from the prior 4-week average. Increases were primarily for Mexico (45,200 unsplit and 26,000 grain splits), China (34,800 unsplit), Taiwan (32,900 unsplit), Vietnam (27,300 unsplit), and Italy (22,300 unsplit, including decreases of 700 pieces). Exports of 128,600 wet blues were down 33 percent from the previous week and 11 percent from the prior 4-week average. The destinations were primarily to Italy (32,300 unsplit and 3,600 grain splits), China (31,800 unsplit), Vietnam (27,300 unsplit), Mexico (13,000 unsplit and 12,000 grain splits), and Thailand (6,300 unsplit). Net sales of 85,900 splits reported for Taiwan (126,000 pounds), were offset by reductions for China (40,100 pounds). Exports of 298,700 pounds were to Vietnam (160,000 pounds) and China (138,700 pounds).
Beef: Net sales of 16,900 MT reported for 2021 were up 31 percent from the previous week, but down 3 percent from the prior 4-week average. Increases primarily for South Korea (6,700 MT, including decreases of 400 MT), Japan (4,000 MT, including decreases of 500 MT), China (1,600 MT, including decreases of 100 MT), Taiwan (1,400 MT, including decreases of 200 MT), and Hong Kong (900 MT, including decreases 100 MT), were offset by reductions for the Philippines (100 MT). For 2022, total net sales of 400 MT were for Japan. Exports of 18,200 MT were up 2 percent from the previous week and 3 percent from the prior 4-week average. The destinations were primarily to Japan (4,700 MT), South Korea (4,700 MT), China (4,100 MT), Mexico (1,100 MT), and Taiwan (1,100 MT).
Pork: Net sales of 28,600 MT reported for 2021 were down 2 percent from the previous week and 4 percent from the prior 4-week average. Increases were primarily for Mexico (11,500 MT, including decreases of 900 MT), Canada (5,200 MT, including decreases of 400 MT), Japan (3,200 MT, including decreases of 500 MT), China (2,000 MT, including decreases of 800 MT), and South Korea (1,800 MT, including decreases of 500 MT). Exports of 33,600 MT were down 12 percent from the previous week and 10 percent from the prior 4-week average. The destinations were primarily to Mexico (15,700 MT), China (7,400 MT), Japan (3,700 MT), South Korea (1,700 MT), and Canada (1,500 MT).
U.S. EXPORT SALES FOR WEEK ENDING 06/17/2021
FAX 202-690-3275
|
|
CURRENT MARKETING YEAR |
NEXT MARKETING YEAR |
||||||
|
COMMODITY |
NET SALES |
OUTSTANDING SALES |
WEEKLY EXPORTS |
ACCUMULATED EXPORTS |
NET SALES |
OUTSTANDING SALES |
||
|
CURRENT YEAR |
YEAR |
CURRENT YEAR |
YEAR |
|||||
|
|
THOUSAND METRIC TONS |
|||||||
|
WHEAT |
|
|
|
|
|
|
|
|
|
HRW |
180.4 |
1,558.0 |
1,987.9 |
209.4 |
419.6 |
602.6 |
0.0 |
0.0 |
|
SRW |
33.6 |
1,030.9 |
600.7 |
18.3 |
22.9 |
43.2 |
0.0 |
0.0 |
|
HRS |
94.3 |
1,495.7 |
1,643.4 |
240.9 |
326.2 |
319.3 |
0.0 |
0.0 |
|
WHITE |
65.8 |
1,055.1 |
1,027.6 |
122.2 |
230.7 |
248.9 |
0.0 |
0.0 |
|
DURUM |
0.0 |
8.4 |
223.5 |
0.0 |
26.3 |
85.0 |
0.0 |
0.0 |
|
TOTAL |
374.1 |
5,148.1 |
5,483.0 |
590.8 |
1,025.7 |
1,299.0 |
0.0 |
0.0 |
|
BARLEY |
0.0 |
23.7 |
40.2 |
1.0 |
1.1 |
0.5 |
0.0 |
0.0 |
|
CORN |
216.3 |
13,269.2 |
9,509.7 |
1,689.7 |
56,262.9 |
32,442.7 |
310.8 |
15,680.7 |
|
SORGHUM |
0.0 |
889.2 |
830.3 |
0.0 |
6,336.9 |
3,181.8 |
0.0 |
1,594.9 |
|
SOYBEANS |
141.7 |
3,623.4 |
7,892.5 |
243.2 |
58,136.2 |
36,687.7 |
47.3 |
7,609.3 |
|
SOY MEAL |
387.6 |
2,136.8 |
2,142.3 |
212.2 |
8,869.1 |
8,778.0 |
22.0 |
671.5 |
|
SOY OIL |
2.4 |
24.8 |
233.8 |
6.8 |
650.8 |
952.7 |
0.0 |
0.6 |
|
RICE |
|
|
|
|
|
|
|
|
|
L G RGH |
56.4 |
242.7 |
99.5 |
6.9 |
1,476.8 |
1,279.8 |
0.0 |
0.0 |
|
M S RGH |
0.0 |
15.8 |
24.2 |
0.1 |
25.1 |
72.3 |
0.0 |
0.0 |
|
L G BRN |
0.1 |
13.1 |
11.8 |
0.3 |
38.6 |
56.3 |
0.0 |
0.0 |
|
M&S BR |
0.1 |
23.0 |
34.6 |
22.3 |
133.6 |
84.4 |
0.0 |
0.0 |
|
L G MLD |
15.3 |
44.4 |
59.0 |
3.5 |
604.6 |
827.6 |
0.0 |
0.0 |
|
M S MLD |
6.0 |
160.0 |
134.9 |
9.7 |
532.1 |
602.0 |
0.0 |
0.0 |
|
TOTAL |
78.0 |
499.0 |
364.1 |
42.7 |
2,810.8 |
2,922.3 |
0.0 |
0.0 |
|
COTTON |
|
THOUSAND RUNNING BALES |
||||||
|
UPLAND |
74.7 |
2,656.8 |
4,651.5 |
206.0 |
13,364.7 |
12,274.2 |
148.9 |
2,293.2 |
|
PIMA |
9.1 |
129.7 |
125.8 |
15.0 |
690.4 |
443.9 |
0.0 |
4.0 |
Terry Reilly
Senior Commodity Analyst – Grain and Oilseeds
Futures International
One Lincoln Center
18 W 140 Butterfield Rd.
Oakbrook Terrace, Il. 60181
W: 312.604.1366
ICE IM: treilly1
Skype: fi.treilly

Trading of futures, options, swaps and other derivatives is risky and is not suitable for all persons. All of these investment products are leveraged, and you can lose more than your initial deposit. Each investment product is offered only to and from jurisdictions where solicitation and sale are lawful, and in accordance with applicable laws and regulations in such jurisdiction. The information provided here should not be relied upon as a substitute for independent research before making your investment decisions. Futures International, LLC is merely providing this information for your general information and the information does not take into account any particular individual’s investment objectives, financial situation, or needs. All investors should obtain advice based on their unique situation before making any investment decision. The contents of this communication and any attachments are for informational purposes only and under no circumstances should they be construed as an offer to buy or sell, or a solicitation to buy or sell any future, option, swap or other derivative. The sources for the information and any opinions in this communication are believed to be reliable, but Futures International, LLC does not warrant or guarantee the accuracy of such information or opinions. Futures International, LLC and its principals and employees may take positions different from any positions described in this communication. Past results are not necessarily indicative of future results.