PDF attached
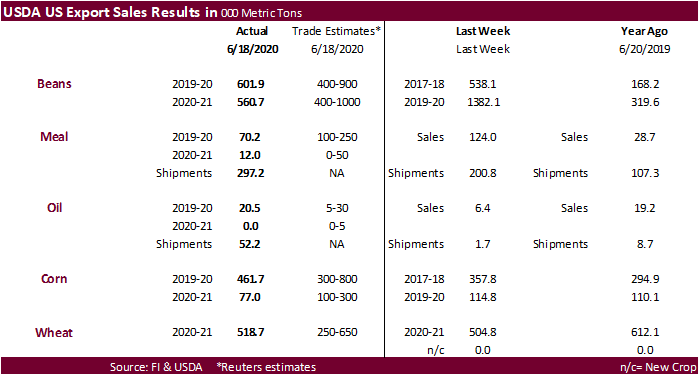
USDA export sales for soybeans, soybean oil and wheat were within expectations. Corn was at the lower end of the trade and soybean meal sales were below expectations. Shipments of meal of nearly 300,000 tons were ok and soybean oil shipments were robust at 52,200 tons.
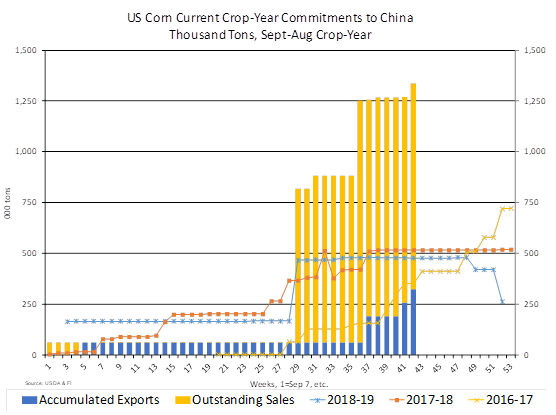
· China booked a cargo of corn.
· China booked 172,500 tons of 2019-20 soybeans, and 393,000 tons of new-crop.
· Sorghum sales showed net reductions of 1,000 tons.
· Pork sales were 24,100 tons.
This summary is based on reports from exporters for the period June 12-18, 2020.
- Wheat: Net sales of 518,700 metric tons (MT) were reported for delivery in marketing year 2020/2021. Increases primarily for Japan (88,000 MT), Nigeria (83,100 MT, including decreases of 4,600 MT), South Korea (78,900 MT), Mexico (74,200 MT), and Italy (42,400 MT, including 21,000 MT switched from unknown destinations and decreases of 100 MT), were offset by reductions for unknown destinations (37,900 MT), Sri Lanka (20,000 MT), and Vietnam (13,700 MT). Exports of 710,100 MT were primarily to China (92,200 MT), Japan (80,000 MT), Nigeria (77,900 MT), Yemen (70,000 MT), and Indonesia (66,000 MT).
- Corn: Net sales of 461,700 MT for 2019/2020 were up 29 percent from the previous week, but down 11 percent from the prior 4-week average. Increases primarily for Mexico (295,700 MT, including 52,500 MT switched from unknown destinations and decreases of 16,200 MT), Peru (87,400 MT, including 83,000 MT switched from unknown destinations), China (66,100 MT), South Korea (65,500 MT, including decreases of 1,700 MT), and Japan (36,900 MT, including decreases of 10,000 MT), were offset by reductions primarily for unknown destinations (180,500 MT). For 2020/2021, net sales of 77,000 MT were reported for Costa Rica (59,600 MT), Taiwan (11,000 MT), Honduras (3,500 MT), and Guatemala (2,900 MT). Exports of 1,313,000 MT were up 50 percent from the previous week and 16 percent from the prior 4-week average. The destinations were primarily to Mexico (397,400 MT), South Korea (201,500 MT, including 132,800 MT late – see below), Japan (146,400 MT, including 13,500 MT late – see below), Israel (88,200 MT), and Peru (87,000 MT). Optional Origin Sales: For 2019/2020, options were exercised to export 65,000 MT to South Korea from the United States. The current outstanding balance of 325,000 MT is for South Korea (195,000 MT), Vietnam (65,000 MT), and Taiwan (65,000 MT). For 2020/2021, the current outstanding balance of 195,000 MT is for Vietnam. Late Reporting: For 2019/2020, exports to South Korea (132,800 MT) and Japan (13,500 MT) were reported late.
- Barley: No net sales or exports for 2020/2021 were reported for the week.
- Sorghum: Net sales reductions of 1,000 MT for 2019/2020 were down 69 percent from the previous week and down noticeably from the prior 4-week average. Increases reported for China (59,000 MT, including 60,000 MT switched from unknown destinations and decreases of 6,100 MT), were more than offset by reductions for unknown destinations (60,000 MT). Exports of 110,000 MT were down 49 percent from the previous week and 36 percent from the prior 4-week average. The destination was China.
- Rice: Net sales reductions of 13,900 MT for 2019/2020 were down noticeably from the previous week and from the prior 4-week average. Increases primarily for Israel (3,300 MT), Jordan (2,000 MT), Canada (1,900 MT), Saudi Arabia (1,000 MT), and New Zealand (1,000 MT), were more than offset by reductions for Nicaragua (24,600 MT). Exports of 60,700 MT were down 5 percent from the previous week, but up 12 percent from the prior 4-week average. The destinations were primarily to Nicaragua (26,600 MT), Japan (12,900 MT), Colombia (7,300 MT), South Korea (3,400 MT), and Canada (3,000 MT). Exports for Own Account: For 2019/2020, the current exports for own account outstanding balance is 100 MT, all Canada.
- Soybeans: Net sales of 601,900 MT for 2019/2020 were up 12 percent from the previous week, but down 10 percent from the prior 4-week average. Increases were primarily for China (172,500 MT, including decreases of 600 MT), unknown destinations (92,000 MT), Egypt (67,200 MT), Spain (55,000 MT), and Algeria (35,000 MT). For 2020/2021, net sales of 560,700 MT were primarily for China (393,000 MT), unknown destinations (66,000 MT), Switzerland (60,000 MT), and Taiwan (25,800 MT). Exports of 302,400 MT were down 22 percent from the previous week and 19 percent from the prior 4-week average. The destinations were primarily to China (83,800 MT), Egypt (57,200 MT), Japan (49,800 MT, including 38,700 MT late – see below), Mexico (32,100 MT), and Indonesia (20,000 MT). Exports for Own Account: For 2019/2020, the current exports for own account outstanding balance is 2,100 MT, all Canada. Late Reporting: For 2019/2020, exports totaling 38,700 MT were reported late. The destination was to Japan.
- Soybean Cake and Meal: Net sales of 70,200 MT for 2019/2020–a marketing-year low–were down 43 percent from the previous week and 72 percent from the prior 4-week average. Increases primarily for Canada (15,800 MT, including decreases of 1,400 MT), Morocco (13,000 MT), Mexico (12,500 MT), the Philippines (8,100 MT), and Indonesia (8,100 MT), were offset by reductions primarily for unknown destinations (4,700 MT), the French West Indies (3,900 MT), and Nicaragua (1,000 MT). For 2020/2021, net sales of 12,000 MT for Ecuador (12,000 MT), Guatemala (500 MT), the Philippines (500 MT), and Canada (300 MT), were offset by reductions for Mexico (1,300 MT). Exports of 297,200 MT were up 48 percent from the previous week and 33 percent from the prior 4-week average. The destinations were primarily to the Philippines (71,100 MT), Mexico (42,200 MT), Ecuador (33,000 MT), Morocco (32,500 MT) and Libya (31,700 MT). Late Reporting: For 2019/2020, net sales totaling 500 MT were reported late. These sales were reported for Colombia. Exports totaling 600 MT were reported late. The destination was to Colombia.
- Soybean Oil: Net sales of 20,500 MT for 2019/2020 primarily for unknown destinations (15,000 MT), Guatemala (6,200 MT, including decreases of 8,000 MT), the Dominican Republic (700 MT, including decreases of 1,700 MT), and Mexico (300 MT, including decreases of 300 MT), were offset by reductions for Colombia (1,200 MT) and Canada (400 MT). Exports of 52,200 MT were up noticeably from the previous week and up 85 percent from the prior 4-week average. The destinations were primarily to South Korea (20,000 MT), Colombia (9,200 MT), Guatemala (8,200 MT), Venezuela (6,000 MT), and the Dominican Republic (5,600 MT).
- Cotton: Net sales of 102,700 RB for 2019/2020 were up 5 percent from the previous week, but down 23 percent from the prior 4-week average. Increases primarily reported for China (94,500 RB, including decreases of 1,300 RB), Turkey (4,100 RB), Vietnam (3,600 RB, including 1,500 RB switched from Hong Kong and decreases of 1,000 MT), Bangladesh (2,800 RB, including decreases of 400 RB), and Pakistan (1,500 RB, including decreases of 700 RB), were offset by reductions for Peru (2,200 RB), Hong Kong (1,500 RB), and Thailand (900 RB). For 2020/2021, net sales of 67,900 RB reported for China (36,500 RB), Vietnam (33,400 RB), Peru (2,200 RB), and Bangladesh (400 RB), were offset by reductions for Turkey (4,100 RB) and Indonesia (600 RB). Exports of 316,100 RB were down 9 percent from the previous week, but up 10 percent from the prior 4-week average. Exports were primarily to China (130,700 RB), Vietnam (59,400 RB), Turkey (38,400 RB), Pakistan (38,200 RB), and Bangladesh (9,200 RB). Net sales of Pima totaling 4,200 RB were down 16 percent from the previous week and 12 percent from the prior 4-week average. Increases were primarily for India (1,100 RB), Thailand (900 RB), China (900 RB), Pakistan (600 RB), and Peru (500 RB). Exports of 9,600 RB were up 61 percent from the previous week and 58 percent from the prior 4-week average. The destinations were primarily to China (4,400 RB), India (2,200 RB), Bangladesh (900 RB), Peru (600 RB), and Honduras (400 RB). Exports for Own Account: For 2019/2020, new exports for own account totaling 900 RB to China. The current exports for own account outstanding balance of 18,900 RB is for China (9,400 RB), Indonesia (8,200 RB), Bangladesh (1,000 RB), and Vietnam (300 RB). Export Adjustments: Accumulated exports of Pima to Turkey were adjusted down 85 RB for week ending February 20th. These exports were canceled.
- Hides and Skins: Net sales of 605,200 pieces for 2020 were up 73 percent from the previous week and 25 percent from the prior 4-week average. Increases primarily for China (488,500 whole cattle hides, including decreases of 7,900 pieces), South Korea (68,800 whole cattle hides, including decreases of 1,600 pieces), Mexico (19,000 whole cattle hides, including decreases of 100 pieces), Taiwan (7,500 whole cattle hides, including decreases of 100 pieces), and Thailand (7,400 whole cattle hides, including decreases of 800 pieces). Additionally, net sales reductions of 600 calf skins were reported for Italy. Exports of 352,600 pieces reported for 2020 were down 32 percent from the previous week and 22 percent from the prior 4-week average. Whole cattle hides exports were primarily to China (297,400 pieces), South Korea (30,400 pieces), Mexico (8,300 pieces), Thailand (6,500 pieces), and Indonesia (3,900 pieces). In addition, exports of 1,400 calf skins–a marketing-year low–were to Italy.
· Net sales of 58,700 wet blues for 2020 were up noticeably from the previous week, but down 33 percent from the prior 4-week average. Increases were reported for China (23,700 unsplit, including decreases of 300 unsplit), Italy (15,000 grain splits, 1,500 unsplit, including decreases of 200 unsplit), Thailand (14,400 unsplit), Mexico (3,200 unsplit, including decreases of 200 unsplit), and Brazil (900 unsplit). Exports of 73,300 wet blues for 2020 were down 6 percent from the previous week and 10 percent from the prior 4-week average. The destinations were primarily to Italy (49,300 unsplit and 1,700 grain splits), Thailand (5,600 unsplit), China (4,800 unsplit), Vietnam (4,400 unsplit), and Mexico (3,200 unsplit). Net sales of 121,800 splits were for Vietnam. Exports of 120,000 pounds were to Vietnam.
· Beef: Net sales of 24,400 MT reported for 2020 were up 21 percent from the previous week and 52 percent from the prior 4-week average. Increases were primarily for South Korea (8,200 MT, including decreases of 400 MT), Japan (5,900 MT, including decreases of 1,000 MT), Taiwan (2,700 MT, including decreases of 200 MT), Mexico (2,300 MT), and Hong Kong (1,400 MT, including decreases of 100 MT). Exports of 18,600 MT were up noticeably from the previous week and up 84 percent from the prior 4-week average. The destinations were primarily to Japan (6,400 MT), South Korea (5,400 MT), Canada (1,800 MT), Mexico (1,300 MT), and Taiwan (1,300 MT).
· Pork: Net sales of 24,100 MT reported for 2020 were down 38 percent from the previous week, but up 3 percent from the prior 4-week average. Increases were primarily for Mexico (8,100 MT, including decreases of 300 MT), China (4,500 MT, including decreases of 900 MT), Japan (2,500 MT, including decreases of 300 MT), Australia (1,900 MT), and Canada (1,700 MT, including decreases of 500 MT). Exports of 29,500 MT were down 12 percent from the previous week and 10 percent from the prior 4-week average. The destinations were primarily to China (10,300 MT), Mexico (8,800 MT), Japan (3,100 MT), Canada (2,400 MT), and South Korea (2,300 MT).
U.S. EXPORT SALES FOR WEEK ENDING 6/18/2020
|
|
CURRENT MARKETING YEAR |
NEXT MARKETING YEAR |
||||||
|
COMMODITY |
NET SALES |
OUTSTANDING SALES |
WEEKLY EXPORTS |
ACCUMULATED EXPORTS |
NET SALES |
OUTSTANDING SALES |
||
|
CURRENT YEAR |
YEAR |
CURRENT YEAR |
YEAR |
|||||
|
|
THOUSAND METRIC TONS |
|||||||
|
WHEAT |
|
|
|
|
|
|
|
|
|
HRW |
263.3 |
1,987.9 |
2,134.4 |
314.1 |
602.6 |
687.5 |
0.0 |
0.0 |
|
SRW |
55.3 |
600.7 |
945.7 |
25.7 |
43.2 |
51.6 |
0.0 |
0.0 |
|
HRS |
65.5 |
1,643.4 |
1,393.7 |
189.2 |
319.3 |
298.3 |
0.0 |
0.0 |
|
WHITE |
112.7 |
1,027.6 |
1,070.4 |
144.5 |
318.9 |
137.7 |
0.0 |
0.0 |
|
DURUM |
21.9 |
223.5 |
173.9 |
36.5 |
85.0 |
54.5 |
0.0 |
0.0 |
|
TOTAL |
518.7 |
5,483.0 |
5,718.1 |
710.1 |
1,369.0 |
1,229.6 |
0.0 |
0.0 |
|
BARLEY |
0.0 |
40.2 |
48.6 |
0.0 |
0.5 |
2.2 |
0.0 |
0.0 |
|
CORN |
461.7 |
9,509.7 |
6,143.6 |
1,313.0 |
32,442.7 |
42,596.4 |
77.0 |
3,630.2 |
|
SORGHUM |
-1.0 |
830.3 |
301.5 |
110.0 |
3,181.8 |
1,257.1 |
0.0 |
388.0 |
|
SOYBEANS |
601.9 |
7,892.5 |
10,544.2 |
302.4 |
36,908.5 |
37,052.2 |
560.7 |
6,095.1 |
|
SOY MEAL |
70.2 |
2,142.3 |
2,551.7 |
297.2 |
8,778.0 |
8,705.0 |
12.0 |
355.9 |
|
SOY OIL |
20.5 |
233.8 |
153.0 |
52.2 |
952.7 |
632.2 |
0.0 |
11.0 |
|
RICE |
|
|
|
|
|
|
|
|
|
L G RGH |
-24.6 |
99.5 |
190.4 |
34.0 |
1,279.8 |
1,229.5 |
0.0 |
57.0 |
|
M S RGH |
0.0 |
24.2 |
21.5 |
2.1 |
72.3 |
81.8 |
0.0 |
5.7 |
|
L G BRN |
0.1 |
11.8 |
3.0 |
0.9 |
56.3 |
38.4 |
0.0 |
0.0 |
|
M&S BR |
0.1 |
34.6 |
0.1 |
3.5 |
84.4 |
146.9 |
0.0 |
0.0 |
|
L G MLD |
2.8 |
59.0 |
187.6 |
2.7 |
827.6 |
780.5 |
0.0 |
0.0 |
|
M S MLD |
7.7 |
134.9 |
135.8 |
17.6 |
602.0 |
513.4 |
0.0 |
0.0 |
|
TOTAL |
-13.9 |
364.1 |
538.4 |
60.7 |
2,922.3 |
2,790.6 |
0.0 |
62.7 |
|
COTTON |
|
THOUSAND RUNNING BALES |
||||||
|
UPLAND |
102.7 |
4,651.5 |
3,828.3 |
316.1 |
12,274.2 |
11,292.8 |
67.9 |
3,243.9 |
|
PIMA |
4.2 |
125.8 |
136.1 |
9.6 |
443.9 |
589.6 |
0.0 |
33.9 |
Terry Reilly
Senior Commodity Analyst – Grain and Oilseeds
Futures International │190 S LaSalle St., Suite 410│Chicago, IL 60603
W: 312.604.1366
AIM: fi_treilly
ICE IM: treilly1
Skype: fi.treilly

Trading of futures, options, swaps and other derivatives is risky and is not suitable for all persons. All of these investment products are leveraged, and you can lose more than your initial deposit. Each investment product is offered only to and from jurisdictions where solicitation and sale are lawful, and in accordance with applicable laws and regulations in such jurisdiction. The information provided here should not be relied upon as a substitute for independent research before making your investment decisions. Futures International, LLC is merely providing this information for your general information and the information does not take into account any particular individual’s investment objectives, financial situation, or needs. All investors should obtain advice based on their unique situation before making any investment decision. The contents of this communication and any attachments are for informational purposes only and under no circumstances should they be construed as an offer to buy or sell, or a solicitation to buy or sell any future, option, swap or other derivative. The sources for the information and any opinions in this communication are believed to be reliable, but Futures International, LLC does not warrant or guarantee the accuracy of such information or opinions. Futures International, LLC and its principals and employees may take positions different from any positions described in this communication. Past results are not necessarily indicative of future results.