PDF attached
USDA export sales
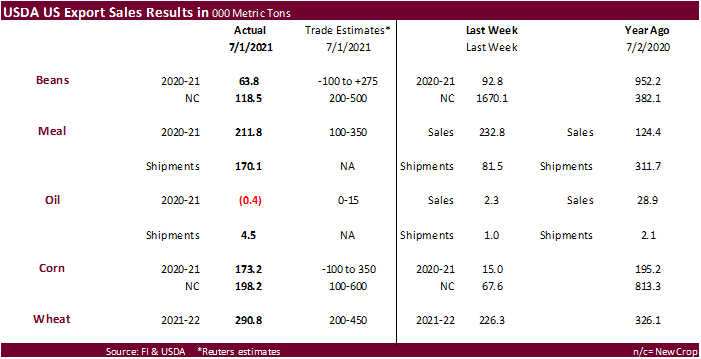
Sales were viewed as bearish to neutral. US soybean export sales came in on the light side of expectations. Old crop soybean commitments are running at nearly 100 percent of USDA’s export projection. Shipments need to improve in order to reach USDA’s projection, but we could see exports surpass 2.280 billion bushels. Soybean meal export sales were within expectations and shipments improved to 170,100 tons. Soybean oil sales showed a net reduction of 400 tons while shipments were again slow at 4,500 tons. USDA corn export sales were only 173,200 tons old crop and 198,200 tons new crop. Some were looking for better new-crop sales. All-wheat exports sales were 290,800 tons, lower end of expectations and seasonal slow for this time of year. Pork sales were 43,800 tons.
U.S. EXPORT SALES FOR WEEK ENDING 07/01/2021
|
|
CURRENT MARKETING YEAR |
NEXT MARKETING YEAR |
||||||
|
COMMODITY |
NET SALES |
OUTSTANDING SALES |
WEEKLY EXPORTS |
ACCUMULATED EXPORTS |
NET SALES |
OUTSTANDING SALES |
||
|
CURRENT YEAR |
YEAR |
CURRENT YEAR |
YEAR |
|||||
|
|
THOUSAND METRIC TONS |
|||||||
|
WHEAT |
|
|
|
|
|
|
|
|
|
HRW |
100.8 |
1,514.1 |
1,825.6 |
136.0 |
655.4 |
1,007.8 |
0.0 |
0.0 |
|
SRW |
11.9 |
932.4 |
610.8 |
119.3 |
151.1 |
117.9 |
0.0 |
0.0 |
|
HRS |
119.3 |
1,609.8 |
1,583.8 |
72.0 |
425.1 |
587.5 |
0.0 |
0.0 |
|
WHITE |
53.6 |
1,079.4 |
1,105.5 |
52.4 |
283.6 |
341.1 |
0.0 |
0.0 |
|
DURUM |
5.3 |
8.4 |
179.0 |
5.3 |
31.6 |
131.2 |
0.0 |
0.0 |
|
TOTAL |
290.8 |
5,144.1 |
5,304.7 |
385.1 |
1,546.8 |
2,185.5 |
0.0 |
0.0 |
|
BARLEY |
0.3 |
23.7 |
40.2 |
0.3 |
1.4 |
1.5 |
0.0 |
0.0 |
|
CORN |
173.2 |
11,034.3 |
7,541.8 |
1,286.3 |
58,685.9 |
34,966.9 |
198.2 |
15,946.5 |
|
SORGHUM |
0.0 |
893.1 |
846.2 |
0.0 |
6,337.0 |
3,364.3 |
0.0 |
1,594.9 |
|
SOYBEANS |
63.8 |
3,410.3 |
8,229.8 |
221.2 |
58,494.0 |
37,544.2 |
118.5 |
9,397.9 |
|
SOY MEAL |
211.8 |
2,329.9 |
1,905.6 |
170.0 |
9,120.6 |
9,282.1 |
55.8 |
911.8 |
|
SOY OIL |
-0.4 |
21.2 |
239.7 |
4.5 |
656.3 |
978.5 |
0.0 |
0.6 |
|
RICE |
|
|
|
|
|
|
|
|
|
L G RGH |
10.5 |
224.5 |
99.2 |
7.0 |
1,532.3 |
1,318.4 |
0.0 |
0.0 |
|
M S RGH |
0.0 |
8.4 |
23.6 |
0.0 |
25.5 |
72.9 |
0.0 |
7.0 |
|
L G BRN |
0.3 |
11.9 |
11.2 |
0.6 |
39.5 |
57.2 |
0.0 |
0.7 |
|
M&S BR |
0.1 |
22.9 |
31.6 |
0.1 |
133.8 |
86.4 |
0.0 |
0.0 |
|
L G MLD |
5.4 |
46.5 |
55.6 |
4.1 |
611.8 |
834.9 |
0.0 |
0.0 |
|
M S MLD |
3.7 |
117.5 |
115.7 |
22.3 |
570.6 |
625.2 |
-0.3 |
12.3 |
|
TOTAL |
19.9 |
431.8 |
336.9 |
34.1 |
2,913.6 |
2,995.0 |
-0.3 |
20.0 |
|
COTTON |
|
THOUSAND RUNNING BALES |
||||||
|
UPLAND |
52.1 |
2,182.8 |
4,156.3 |
294.8 |
13,933.5 |
12,880.4 |
177.0 |
2,604.1 |
|
PIMA |
5.4 |
107.7 |
121.5 |
19.2 |
720.0 |
455.7 |
0.0 |
4.1 |
This summary is based on reports from exporters for the period June 25-July 1, 2021.
Wheat: Net sales of 290,800 metric tons (MT) were reported for delivery in marketing year 2021/2022. Increases primarily for the Philippines (120,000 MT, including 60,000 MT switched from Indonesia), Mexico (85,500 MT, including decreases of 900 MT), South Korea (82,500 MT), China (69,500 MT, including 65,000 MT switched from unknown destinations), and Taiwan (54,900 MT, including decreases of 900 MT), were offset by reductions primarily for Indonesia (60,000 MT) and unknown destinations (49,900 MT). Exports of 385,100 MT were primarily to Mexico (85,700 MT, including 100 MT – late), China (67,200 MT), South Korea (55,000 MT), Taiwan (50,900 MT), and Nigeria (46,400 MT).
Late Reporting: For 2020/2021, net sales totaling 5,300 MT of durum wheat were reported late for Italy. Exports of 5,300 MT of durum wheat were reported late to Italy and exports of 100 MT of soft red winter wheat were reported late to Mexico.
Corn: Net sales of 173,200 MT for 2020/2021 were up noticeably from the previous week and up 58 percent from the prior 4-week average. Increases primarily for Mexico (136,600 MT, including decreases of 4,600 MT), Japan (83,000 MT, including 82,600 MT switched from unknown destinations and decreases of 7,200 MT), Colombia (36,800 MT, including 42,000 MT switched from unknown destinations and decreases of 300 MT), the Dominican Republic (20,200 MT), and Canada (10,600 MT, including decreases of 300 MT), were offset by reductions primarily for unknown destinations (124,600 MT). For 2021/2022, net sales of 198,200 MT were primarily for Mexico (65,300 MT), South Korea (65,000 MT), Japan (23,200 MT), Taiwan (13,200 MT), and Honduras (8,500 MT). Exports of 1,286,300 MT were up 13 percent from the previous week, but down 16 percent from the prior 4-week average. The destinations were primarily to China (405,100 MT), Mexico (329,900 MT), Japan (294,700 MT), Saudi Arabia (72,400 MT), and Colombia (58,800 MT).
Optional Origin Sales: For 2020/2021, options were exercised to export 65,000 MT to South Korea from other than the United States. The current outstanding balance of 30,500 MT is for unknown destinations. For 2021/2022, the current outstanding balance of 60,000 MT is for unknown destinations.
Late Reporting: For 2020/2021, exports totaling 18,100 MT of corn were reported late to the Dominican Republic.
Barley: Total net sales for 2020/2021 of 300 MT were for China. Exports of 300 MT were unchanged from the previous week, but up 14 percent from the prior 4-week average. The destination was to Canada.
Sorghum: No net sales or exports were reported for the week.
Rice: Net sales of 19,900 MT for 2020/2021 were up 27 percent from the previous week, but down 51 percent from the prior 4-week average. Increases primarily for Nicaragua (10,000 MT), Jordan (3,200 MT), Saudi Arabia (1,600 MT), Canada (1,400 MT), and Guatemala (1,000 MT), were offset by reductions for Honduras (500 MT). Total net sales reductions for 2021/2022 of 300 MT were for Taiwan. Exports of 34,100 MT were down 50 percent from the previous week and 47 percent from the prior 4-week average. The destinations were primarily to Japan (15,700 MT), Honduras (5,500 MT), Mexico (2,600 MT), South Korea (2,400 MT), and Canada (2,200 MT).
Exports for Own Account: For 2020/2021, the current exports for own account outstanding balance is 100 MT, all Canada.
Soybeans: Net sales of 63,800 MT for 2020/2021 were down 31 percent from the previous week and 19 percent from the prior 4-week average. Increases primarily for Mexico (38,000 MT, including 47,500 MT switched from unknown destinations and decreases of 13,100 MT), Japan (37,700 MT, including 18,800 MT switched from unknown destinations and decreases of 9,300 MT), China (18,100 MT, including decreases of 1,300 MT), Taiwan (16,900 MT), and Colombia (12,400 MT, including 11,500 MT switched from unknown destinations and decreases of 300 MT), were offset by reductions primarily for unknown destinations (77,500 MT). For 2021/2022, net sales of 118,500 MT were primarily for Japan (77,800 MT), unknown destinations (20,100 MT), Colombia (15,000 MT), Malaysia (3,000 MT), and Taiwan (2,000 MT). Exports of 221,200 MT were up 49 percent from the previous week and 8 percent from the prior 4-week average. The destinations were primarily to Mexico (91,700 MT), Japan (44,900 MT), Colombia (19,000 MT), Indonesia (15,600 MT), and Costa Rica (13,100 MT).
Exports for Own Account: For 2020/2021, the current exports for own account outstanding balance is 5,800 MT, all Canada.
Soybean Cake and Meal: Net sales of 211,800 MT for 2020/2021 were down 9 percent from the previous week and from the prior 4-week average. Increases primarily for Japan (62,700 MT), Colombia (45,100 MT), Poland (30,000 MT), Mexico (25,600 MT, including decreases of 9,400 MT), and Ecuador (9,500 MT), were offset by reductions primarily for the Dominican Republic (1,000 MT). For 2021/2022, net sales of 55,800 MT were reported for Ecuador (30,000 MT), the Philippines (25,000 MT), and Canada (800 MT). Exports of 170,000 MT were up noticeably from the previous week, but unchanged from the prior 4-week average. The destinations were primarily to the Philippines (48,100 MT), Mexico (38,200 MT), Canada (23,000 MT), Honduras (21,900 MT), and the Dominican Republic (13,000 MT).
Soybean Oil: Net sales reductions of 400 MT for 2020/2021 were down noticeably from the previous week and from the prior 4-week average. Increases for Canada (2,300 MT) and Mexico (300 MT), were more than offset by reductions for Colombia (3,000 MT). Exports of 4,500 MT were up noticeably from the previous week, but down 48 percent from the prior 4-week average. The destinations were to Venezuela (3,000 MT), Mexico (1,000 MT), and Canada (400 MT).
Cotton: Net sales of 52,100 RB for 2020/2021 were up 22 percent from the previous week, but down 38 percent from the prior 4-week average. Increases primarily for Pakistan (24,000 RB, including 600 RB switched from the United Arab Emirates and decreases of 300 RB), China (7,400 RB, including decreases of 200 RB), Vietnam (4,700 RB, including 900 RB switched from China and decreases of 1,100 RB), Turkey (4,500 RB, including decreases of 1,500 RB), and South Korea (4,400 RB, including decreases of 100 RB), were offset by reductions for the United Arab Emirates (600 RB) and Ecuador (300 RB). For 2021/2022, net sales of 177,000 RB were primarily for Pakistan (58,500 RB), Turkey (32,800 RB), El Salvador (20,900 RB), Indonesia (19,100 RB), and Thailand (11,900 RB). Exports of 294,800 RB were up 8 percent from the previous week and 13 percent from the prior 4-week average. Exports were primarily to Vietnam (71,300 RB), Pakistan (58,600 RB), China (42,400 RB), Turkey (42,300 RB), and Mexico (31,800 RB). Net sales of Pima totaling 5,400 RB were up noticeably from the previous week and up 24 percent from the prior 4-week average. Increases were primarily for Thailand (2,100 RB), Peru (2,000 RB), and Pakistan (900 RB). Exports of 19,200 RB were up 84 percent from the previous week and 42 percent from the prior 4-week average. The destinations were primarily to India (7,000 RB), Pakistan (4,300 RB), China (3,700 RB), Vietnam (2,200 RB), and Peru (1,200 RB).
Exports for Own Account: For 2020/2021, the outstanding balance of 4,700 RB is for China.
Hides and Skins: Net sales of 397,400 pieces for 2021 were down 59 percent from the previous week and 23 percent from the prior 4-week average. Increases were primarily for China (234,000 whole cattle hides, including decreases of 9,400 pieces), South Korea (55,200 whole cattle hides, including decreases of 3,600 pieces), Ethiopia (39,200 whole cattle hides), Mexico (34,700 whole cattle hides, including decreases of 3,000 pieces), and Brazil (11,700 whole cattle hides). Net sales of 1,000 kip skins, resulting in increases for China (1,300 kip skins), were offset by reductions for Belgium (300 kip skins). Exports of 385,400 pieces were up 10 percent from the previous week and from the prior 4-week average. Whole cattle hides exports were primarily to China (258,900 pieces), South Korea (46,900 pieces), Thailand (29,300 pieces), Mexico (25,000 pieces), and Brazil (8,800 pieces). In addition, exports of 2,600 kip skins were to Belgium.
Net sales of 121,000 wet blues for 2021 were up 6 percent from the previous week, but down 4 percent from the prior 4-week average. Increases primarily for Italy (58,000 unsplit), China (24,400 unsplit), Vietnam (22,700 unsplit), Taiwan (11,900 unsplit), and Brazil (4,000 unsplit), were offset by reductions for Thailand (100 unsplit). Exports of 118,400 wet blues were down 24 percent from the previous week and 19 percent from the prior 4-week average. The destinations were to China (32,000 unsplit), Vietnam (28,500 unsplit), Italy (19,800 unsplit and 3,200 grain splits), Thailand (19,900 unsplit), and Mexico (8,200 grain splits and 6,800 unsplit). Net sales of 90,500 splits reported for China (47,200 pounds, including decreases of 1,400 pounds) and Taiwan (43,300 pounds). Exports of 320,000 pounds were to Vietnam (200,000 pounds) and China (120,000 pounds).
Beef: Net sales of 23,700 MT reported for 2021 were up 96 percent from the previous week and 64 percent from the prior 4-week average. Increases were primarily for South Korea (10,400 MT, including decreases of 400 MT), Japan (5,800 MT, including decreases of 400 MT), China (2,700 MT, including decreases of 100 MT), Mexico (1,500 MT), and Canada (700 MT, including decreases of 100 MT). Total net sales for 2022 of 100 MT were for Japan. Exports of 17,800 MT were down 6 percent from the previous week and from the prior 4-week average. The destinations were primarily to Japan (5,000 MT), South Korea (4,700 MT), China (3,200 MT), Taiwan (1,100 MT), and Mexico (1,000 MT).
Pork: Net sales of 43,800 MT reported for 2021 were up 53 percent from the previous week and 65 percent from the prior 4-week average. Increases primarily for China (16,300 MT, including decreases of 300 MT), Mexico (13,800 MT, including decreases of 600 MT), Japan (8,400 MT, including decrease of 200 MT), Colombia (1,800 MT, including decreases of 100 MT), and Canada (1,700 MT, including decreases of 400 MT), were offset by reductions for Nicaragua (100 MT), New Zealand (100 MT), and Australia (100 MT). Exports of 30,500 MT were down 6 percent from the previous week and 7 percent from the prior 4-week average. The destinations were primarily to Mexico (13,000 MT), China (6,500 MT), Japan (3,100 MT), South Korea (2,400 MT), and Canada (1,500 MT).
Terry Reilly
Senior Commodity Analyst – Grain and Oilseeds
Futures International
One Lincoln Center
18 W 140 Butterfield Rd.
Oakbrook Terrace, Il. 60181
W: 312.604.1366
ICE IM: treilly1
Skype: fi.treilly

Trading of futures, options, swaps and other derivatives is risky and is not suitable for all persons. All of these investment products are leveraged, and you can lose more than your initial deposit. Each investment product is offered only to and from jurisdictions where solicitation and sale are lawful, and in accordance with applicable laws and regulations in such jurisdiction. The information provided here should not be relied upon as a substitute for independent research before making your investment decisions. Futures International, LLC is merely providing this information for your general information and the information does not take into account any particular individual’s investment objectives, financial situation, or needs. All investors should obtain advice based on their unique situation before making any investment decision. The contents of this communication and any attachments are for informational purposes only and under no circumstances should they be construed as an offer to buy or sell, or a solicitation to buy or sell any future, option, swap or other derivative. The sources for the information and any opinions in this communication are believed to be reliable, but Futures International, LLC does not warrant or guarantee the accuracy of such information or opinions. Futures International, LLC and its principals and employees may take positions different from any positions described in this communication. Past results are not necessarily indicative of future results.