PDF attached
USDA Export Sales
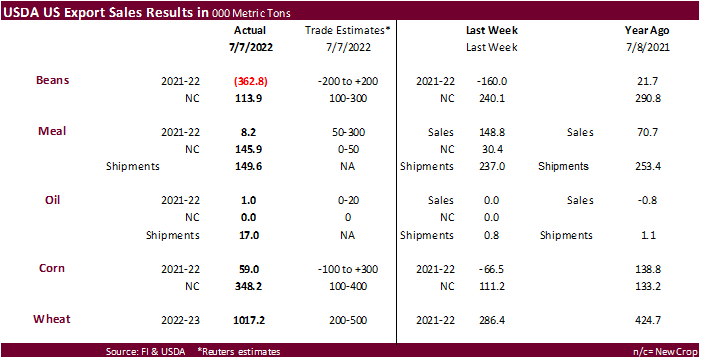
Big wheat sales with net increases for China (265,300), South Korea and Mexico. US wheat futures for all three markets are higher. We think the wheat sales are largest since 10/24/2013 when USDA reported 1,308,837 tons.
US corn sales were good on combined basis. China bought 90,500 tons of new-crop corn. Soybean sales were poor, especially for old crop with net reductions of 362,800 tons. Increases for current crop year soybeans (mostly EU) were offset by reductions primarily for unknown destinations (367,600 MT), China (130,800 MT), Egypt (68,900 MT), and Costa Rica (16,000 MT). Soybean meal sales were ok while soybean oil sales were again poor. The report was seen friendly for meal over oil, wheat, and new-crop corn.
This summary is based on reports from exporters for the period July 1-7, 2022.
Wheat: Net sales of 1,017,200 metric tons (MT) for 2022/2023 were up noticeably from the previous week and from the prior 4-week average. Increases primarily for China (265,300 MT), South Korea (148,400 MT), Mexico (91,300 MT, including decreases of 1,000 MT), unknown destinations (74,300 MT), and Guatemala (69,800 MT, including 35,300 MT switched from El Salvador), were offset by reductions for El Salvador (34,900 MT) and Nigeria (4,500 MT). Total net sales of 30,000 MT for 2023/2024 were reported for Brazil. Exports of 270,000 MT were down 6 percent from the previous week and 13 percent from the prior 4-week average. The destination were primarily to South Korea (81,200 MT), Mexico (69,100 MT), Guatemala (36,200 MT), Taiwan (28,500 MT), and Peru (23,900 MT).
Corn: Net sales of 59,000 MT for 2021/2022 were down noticeably from the previous week and down 72 percent from the prior 4-week average. Increases primarily for Japan (124,100 MT, including 120,400 MT switched from unknown destinations), Mexico (57,000 MT, including decreases of 600 MT), Morocco (30,200 MT – late), El Salvador (11,500 MT), and Nicaragua (7,500 MT), were offset by reductions primarily for unknown destinations (113,400 MT) and Canada (54,600 MT). Net sales of 348,200 MT for 2022/2023 were primarily for Japan (130,600 MT), China (90,500 MT), Colombia (60,000 MT), Mexico (36,500 MT), and El Salvador (15,000 MT). Exports of 916,100 MT were down 11 percent from the previous week and 24 percent from the prior 4-week average. The destinations were primarily to China (404,900 MT), Mexico (227,200 MT), Japan (223,900 MT, including 400 MT – late), Morocco (30,200 MT – late), and Canada (13,800 MT).
Optional Origin Sales: For 2021/2022, the current outstanding balance of 108,300 MT is for unknown destinations (65,000 MT), Italy (34,300 MT), and Saudi Arabia (9,000 MT). For 2022/2023, the current outstanding balance of 35,400 MT is for Italy.
Late Reporting: For 2021/20222, net sales totaling 30,200 MT of corn were reported late for Morocco. Exports totaling 30,600 MT of corn were reported late for Morocco (30,200 MT) and Japan (400 MT).
Barley: No net sales were reported for the week. Exports of 500 MT were up noticeably from the previous week, but down 7 percent from the prior 4-week average. The destination was to Japan.
Sorghum: Net sales reductions of 2,600 MT for 2021/2022 were down noticeably from the previous week and from the prior 4-week average. Increases reported for China (77,700 MT, including 68,000 MT switched from unknown destinations), were more than offset by reductions for unknown destinations (78,000 MT) and Mexico (2,300 MT). Exports of 186,200 MT were up noticeably from the previous week and up 74 percent from the prior 4-week average. The destinations were primarily to China (147,800 MT) and Mexico (38,100 MT).
Rice: Net sales of 27,400 MT for 2021/2022 were down 10 percent from the previous week and 25 percent from the prior 4-week average. Increases primarily for Mexico (16,800 MT), Haiti (8,200 MT), Canada (1,800 MT, including decreases of 100 MT), Guatemala (500 MT), and the Netherlands Antilles (300 MT), were offset by reductions for Costa Rica (300 MT). Exports of 47,300 MT were up 43 percent from the previous week, but down 20 percent from the prior 4-week average. The destinations were primarily to Mexico (19,600 MT), Costa Rica (14,700 MT), Japan (8,100 MT), Canada (2,800 MT, including 100 MT – late), and Taiwan (700 MT).
Late Reporting: For 2021/20222, exports totaling 100 MT of long grain, brown rice were reported late for Canada.
Soybeans: Net sales reductions of 362,900 MT for 2021/2022 were a marketing-year low. Increases primarily for the Netherlands (67,600 MT, including 63,000 MT switched from unknown destinations), Germany (64,100 MT), Algeria (42,900 MT, including 45,000 MT switched from unknown destinations and decreases of 2,100 MT), Vietnam (14,800 MT), and Peru (12,400 MT, including 10,500 MT switched from unknown destinations), were more than offset by reductions primarily for unknown destinations (367,600 MT), China (130,800 MT), Egypt (68,900 MT), and Costa Rica (16,000 MT). Net sales of 113,900 MT for 2022/2023 were primarily for China (90,000 MT), Costa Rica (16,000 MT), and Japan (7,700 MT). Exports of 440,900 MT were down 13 percent from the previous week and 16 percent from the prior 4-week average. The destinations were primarily to China (84,800 MT), Mexico (68,900 MT), the Netherlands (67,600 MT), Germany (64,100 MT), and Egypt (57,100 MT).
Export for Own Account: For 2021/2022, the current exports for own account outstanding balance is 6,300 MT, all Canada.
Late Reporting: For 2021/2022, exports totaling 1,200 MT of soybeans was reported late for Taiwan.
Export Adjustment: Accumulated exports of soybeans to the Netherlands were adjusted down 64,059 MT for week ending June 23rd. The correct destination for this shipment is Germany.
Soybean Cake and Meal: Net sales of 8,200 MT for 2021/2022 were down 95 percent from the previous week and 92 percent from the prior 4-week average. Increases primarily for Canada (8,700 MT, including decreases of 600 MT), Mexico (7,500 MT), El Salvador (6,000 MT), Japan (5,400 MT), and Guatemala (3,400 MT switched from Honduras), were offset by reductions primarily for Colombia (24,000 MT) and Honduras (5,000 MT). Net sales of 145,900 MT for 2022/2023 were primarily for Ecuador (90,000 MT), Guatemala (22,600 MT), El Salvador (13,500 MT), Canada (11,200 MT), and Panama (8,300 MT). Exports of 149,600 MT were down 37 percent from the previous week and 38 percent from the prior 4-week average. The destinations were primarily to Mexico (36,800 MT), Japan (31,500 MT), Venezuela (26,100 MT), Canada (21,400 MT), and Morocco (20,000 MT).
Soybean Oil: Net sales of 1,000 MT for 2021/2022 were down noticeably from the previous week and down 54 percent from the prior 4-week average. Increases were reported for Guatemala (500 MT) and Canada (500 MT). Exports of 16,900 MT were up noticeably from the previous week and from the prior 4-week average. The destinations were primarily to South Korea (11,900 MT) and Mexico (4,300 MT).
Cotton: Net sales of 10,200 RB for 2021/2022–a marketing-year low–were down 73 percent from the previous week and 68 percent from the prior 4-week average. Increases primarily for Turkey (7,500 RB, including decreases of 900 RB), Mexico (2,800 RB), Algeria (1,500 RB), China (1,200 RB, including 600 RB switched from India and decreases of 200 RB), and Taiwan (900 RB), were offset by reductions for Pakistan (3,200 RB), India (600 RB), and Japan (400 RB). Net sales of 139,300 RB for 2022/2023 primarily for Turkey (73,800 RB), Pakistan (33,900 RB), India (13,200 RB), Nicaragua (8,800 RB), and Peru (7,000 RB), were offset by reductions for Vietnam (4,100 RB), Guatemala (3,500 RB), and Mexico (600 RB). Exports of 312,700 RB were down 17 percent from the previous week and 14 percent from the prior 4-week average. The destinations were primarily to China (74,000 RB), Turkey (64,800 RB), India (39,000 RB), Vietnam (30,600 RB), and Pakistan (28,100 RB). Total net sales of 1,300 RB of Pima were up 43 percent from the previous week and 36 percent from the prior 4-week average. Increases were for Thailand. Net sales reductions of 100 RB for 2022/2023 resulting in increases for India (400 RB), were more than offset by reductions for Peru (500 RB). Exports of 4,400 RB were down 59 percent from the previous week and 40 percent from the prior 4-week average. The destinations were to China (2,800 RB), India (1,300 RB), Egypt (200 RB), and Italy (100 RB).
Optional Origin Sales: For 2021/2022, the current outstanding balance of 12,700 RB is for Vietnam (10,200 RB) and Pakistan (2,500 RB).
Export for Own Account: For 2021/2022, new exports for own account totaling 19,400 RB were primarily to China (9,800 RB). Exports for own account totaling 3,500 RB to China were applied to new or outstanding sales. The current exports for own account outstanding balance of 66,100 RB is for China (37,700 RB), Vietnam (23,600 RB), and Indonesia (4,800 RB).
Hides and Skins: Net sales of 280,600 pieces for 2022 were down 11 percent from the previous week and 34 percent from the prior 4-week average. Increases primarily for China (210,700 whole cattle hides, including decreases of 2,800 pieces), Brazil (31,900 whole cattle hides, including decreases of 700 pieces), Mexico (24,600 whole cattle hides, including decreases of 600 pieces), Taiwan (10,900 whole cattle hides), and Colombia (3,200 whole cattle hides), were offset by reductions for Thailand (3,100 pieces). Exports of 279,200 pieces were down 19 percent from the previous week and 32 percent from the prior 4-week average. Whole cattle hides exports were primarily to China (160,400 pieces), South Korea (41,800 pieces), Mexico (32,300 pieces), Thailand (17,900 pieces), and Brazil (9,700 pieces).
Net sales of 141,900 wet blues for 2022 were down 44 percent from the previous week and 25 percent from the prior 4-week average. Increases reported for Italy (73,300 unsplit, including decreases of 200 grain splits), Thailand (38,500 unsplit, including decreases of 100 unsplit), Vietnam (21,900 unsplit), China (9,500 unsplit), and Mexico (900 unsplit), were offset by reductions for Brazil (1,900 unsplit). Exports of 70,100 wet blues were down 16 percent from the previous week and 48 percent from the prior 4-week average. The destinations were primarily to Vietnam (24,000 unsplit), Italy (13,900 unsplit and 3,000 grain splits), Thailand (14,900 unsplit), China (12,000 unsplit), and Brazil (1,600 unsplit). Net sales of 46,400 splits were down 92 percent from the previous week and 77 percent from the prior 4-week average. Increases were reported for China (44,000 pounds) and South Korea (2,400 pounds, including decreases of 1,700 pounds). Exports of 320,000 pounds were down 38 percent from the previous week and 36 percent from the prior 4-week average. The destination was to Vietnam.
Beef: Net sales of 9,200 MT for 2022–a marketing-year low–were down 17 percent from the previous week and 35 percent from the prior 4-week average. Increases primarily for Japan (3,800 MT, including decreases of 500 MT), Mexico (2,900 MT), Canada (900 MT), China (500 MT, including decreases of 900 MT), and Taiwan (400 MT, including decreases of 100 MT), were offset by reductions for South Korea (700 MT). Exports of 17,100 MT were down 16 percent from the previous week and 13 percent from the prior 4-week average. The destinations were primarily to Japan (6,300 MT), South Korea (4,500 MT), China (2,300 MT), Mexico (1,000 MT), and Canada (700 MT).
Pork: Net sales of 18,300 MT for 2022 were down 42 percent from the previous week and 37 percent from the prior 4-week average. Increases were primarily for Mexico (10,100 MT, including decreases of 400 MT), Japan (3,400 MT, including decreases of 800 MT), China (1,600 MT, including decreases of 200 MT), South Korea (1,200 MT, including decreases of 300 MT), and Colombia (800 MT). Exports of 23,100 MT were down 28 percent from the previous week and 21 percent from the prior 4-week average. The destinations were primarily to Mexico (10,800 MT), China (3,600 MT), Japan (2,900 MT), South Korea (2,100 MT), and Colombia (1,000 MT).
U.S. EXPORT SALES FOR WEEK ENDING 7/7/2022
|
|
CURRENT MARKETING YEAR |
NEXT MARKETING YEAR |
||||||
|
COMMODITY |
NET SALES |
OUTSTANDING SALES |
WEEKLY EXPORTS |
ACCUMULATED EXPORTS |
NET SALES |
OUTSTANDING SALES |
||
|
CURRENT YEAR |
YEAR |
CURRENT YEAR |
YEAR |
|||||
|
|
THOUSAND METRIC TONS |
|||||||
|
WHEAT |
|
|
|
|
|
|
|
|
|
HRW |
240.9 |
1,530.7 |
1,613.7 |
69.4 |
505.7 |
739.3 |
0.0 |
0.0 |
|
SRW |
212.1 |
1,140.6 |
884.4 |
75.3 |
266.3 |
231.0 |
30.0 |
30.0 |
|
HRS |
233.1 |
1,387.8 |
1,584.8 |
94.4 |
621.9 |
577.0 |
0.0 |
0.0 |
|
WHITE |
301.0 |
1,173.4 |
1,111.6 |
30.8 |
305.0 |
323.6 |
0.0 |
0.0 |
|
DURUM |
30.0 |
124.4 |
8.4 |
0.0 |
18.0 |
41.7 |
0.0 |
0.0 |
|
TOTAL |
1,017.2 |
5,356.8 |
5,202.9 |
270.0 |
1,716.9 |
1,912.7 |
30.0 |
30.0 |
|
BARLEY |
0.0 |
12.8 |
23.7 |
0.5 |
2.7 |
1.4 |
0.0 |
0.0 |
|
CORN |
59.0 |
7,001.8 |
10,111.4 |
916.1 |
53,414.5 |
59,747.7 |
348.2 |
6,836.3 |
|
SORGHUM |
-2.6 |
452.2 |
822.1 |
186.2 |
6,503.5 |
6,408.4 |
0.0 |
0.0 |
|
SOYBEANS |
-362.9 |
6,920.6 |
3,234.2 |
440.9 |
52,542.3 |
58,691.8 |
113.9 |
13,851.6 |
|
SOY MEAL |
8.2 |
1,915.3 |
2,147.2 |
149.6 |
9,358.1 |
9,374.0 |
145.9 |
722.2 |
|
SOY OIL |
1.0 |
65.9 |
19.1 |
16.9 |
620.7 |
657.4 |
0.0 |
0.0 |
|
RICE |
|
|
|
|
|
|
|
|
|
L G RGH |
9.4 |
58.2 |
184.7 |
33.7 |
1,280.2 |
1,575.8 |
0.0 |
13.1 |
|
M S RGH |
7.2 |
13.9 |
8.3 |
0.1 |
14.2 |
25.6 |
0.0 |
0.0 |
|
L G BRN |
0.1 |
2.8 |
11.8 |
0.3 |
51.9 |
39.6 |
0.0 |
0.0 |
|
M&S BR |
0.0 |
8.9 |
22.9 |
0.7 |
78.7 |
133.9 |
0.0 |
0.0 |
|
L G MLD |
9.6 |
80.6 |
35.1 |
2.6 |
763.4 |
627.5 |
0.0 |
0.0 |
|
M S MLD |
1.2 |
106.0 |
114.0 |
9.8 |
430.4 |
576.0 |
0.0 |
0.0 |
|
TOTAL |
27.4 |
270.4 |
376.8 |
47.3 |
2,618.8 |
2,978.4 |
0.0 |
13.2 |
|
COTTON |
|
THOUSAND RUNNING BALES |
||||||
|
UPLAND |
10.2 |
3,449.1 |
2,031.3 |
312.7 |
12,201.5 |
14,119.5 |
139.3 |
4,587.8 |
|
PIMA |
1.3 |
45.4 |
110.3 |
4.4 |
436.7 |
723.4 |
-0.1 |
59.0 |
Terry Reilly
Senior Commodity Analyst – Grain and Oilseeds
Futures International
One Lincoln Center
18 W 140 Butterfield Rd.
Oakbrook Terrace, Il. 60181
W: 312.604.1366
ICE IM: treilly1
Skype: fi.treilly

Trading of futures, options, swaps and other derivatives is risky and is not suitable for all persons. All of these investment products are leveraged, and you can lose more than your initial deposit. Each investment product is offered only to and from jurisdictions where solicitation and sale are lawful, and in accordance with applicable laws and regulations in such jurisdiction. The information provided here should not be relied upon as a substitute for independent research before making your investment decisions. Futures International, LLC is merely providing this information for your general information and the information does not take into account any particular individual’s investment objectives, financial situation, or needs. All investors should obtain advice based on their unique situation before making any investment decision. The contents of this communication and any attachments are for informational purposes only and under no circumstances should they be construed as an offer to buy or sell, or a solicitation to buy or sell any future, option, swap or other derivative. The sources for the information and any opinions in this communication are believed to be reliable, but Futures International, LLC does not warrant or guarantee the accuracy of such information or opinions. Futures International, LLC and its principals and employees may take positions different from any positions described in this communication. Past results are not necessarily indicative of future results.