PDF attached
USDA Export Sales
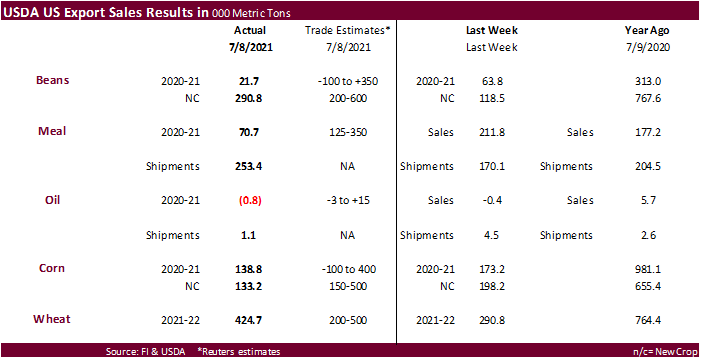
China was quiet last week. Old crop soybean export sales were a disappointing 21,700 tons and new-crop improved from the previous week to 290,800 tons with Mexico taking the bulk (248,600 tons). Soybean oil sales were negative 800 tons. Meal sales were 70,700 tons (Israel bought 10,000), down from 211,800 tons week earlier. Shipment of meal were very good at 253,400 tons. Soybean oil shipments were 1,100 tons. Corn export sales on a combined basis were withing expectations but remain below average. All-wheat export sales were good at 424,700 tons and included the Philippines, Mexico, and unknown destinations. There were no barley sales and sorghum were only 400 tons. Pork sales slowed to 10,600 tons, down 76% from the previous week.
U.S. EXPORT SALES FOR WEEK ENDING 07/01/2021
|
|
CURRENT MARKETING YEAR |
NEXT MARKETING YEAR |
||||||
|
COMMODITY |
NET SALES |
OUTSTANDING SALES |
WEEKLY EXPORTS |
ACCUMULATED EXPORTS |
NET SALES |
OUTSTANDING SALES |
||
|
CURRENT YEAR |
YEAR |
CURRENT YEAR |
YEAR |
|||||
|
|
THOUSAND METRIC TONS |
|||||||
|
WHEAT |
|
|
|
|
|
|
|
|
|
HRW |
100.8 |
1,514.1 |
1,825.6 |
136.0 |
655.4 |
1,007.8 |
0.0 |
0.0 |
|
SRW |
11.9 |
932.4 |
610.8 |
119.3 |
151.1 |
117.9 |
0.0 |
0.0 |
|
HRS |
119.3 |
1,609.8 |
1,583.8 |
72.0 |
425.1 |
587.5 |
0.0 |
0.0 |
|
WHITE |
53.6 |
1,079.4 |
1,105.5 |
52.4 |
283.6 |
341.1 |
0.0 |
0.0 |
|
DURUM |
5.3 |
8.4 |
179.0 |
5.3 |
31.6 |
131.2 |
0.0 |
0.0 |
|
TOTAL |
290.8 |
5,144.1 |
5,304.7 |
385.1 |
1,546.8 |
2,185.5 |
0.0 |
0.0 |
|
BARLEY |
0.3 |
23.7 |
40.2 |
0.3 |
1.4 |
1.5 |
0.0 |
0.0 |
|
CORN |
173.2 |
11,034.3 |
7,541.8 |
1,286.3 |
58,685.9 |
34,966.9 |
198.2 |
15,946.5 |
|
SORGHUM |
0.0 |
893.1 |
846.2 |
0.0 |
6,337.0 |
3,364.3 |
0.0 |
1,594.9 |
|
SOYBEANS |
63.8 |
3,410.3 |
8,229.8 |
221.2 |
58,494.0 |
37,544.2 |
118.5 |
9,397.9 |
|
SOY MEAL |
211.8 |
2,329.9 |
1,905.6 |
170.0 |
9,120.6 |
9,282.1 |
55.8 |
911.8 |
|
SOY OIL |
-0.4 |
21.2 |
239.7 |
4.5 |
656.3 |
978.5 |
0.0 |
0.6 |
|
RICE |
|
|
|
|
|
|
|
|
|
L G RGH |
10.5 |
224.5 |
99.2 |
7.0 |
1,532.3 |
1,318.4 |
0.0 |
0.0 |
|
M S RGH |
0.0 |
8.4 |
23.6 |
0.0 |
25.5 |
72.9 |
0.0 |
7.0 |
|
L G BRN |
0.3 |
11.9 |
11.2 |
0.6 |
39.5 |
57.2 |
0.0 |
0.7 |
|
M&S BR |
0.1 |
22.9 |
31.6 |
0.1 |
133.8 |
86.4 |
0.0 |
0.0 |
|
L G MLD |
5.4 |
46.5 |
55.6 |
4.1 |
611.8 |
834.9 |
0.0 |
0.0 |
|
M S MLD |
3.7 |
117.5 |
115.7 |
22.3 |
570.6 |
625.2 |
-0.3 |
12.3 |
|
TOTAL |
19.9 |
431.8 |
336.9 |
34.1 |
2,913.6 |
2,995.0 |
-0.3 |
20.0 |
|
COTTON |
|
THOUSAND RUNNING BALES |
||||||
|
UPLAND |
52.1 |
2,182.8 |
4,156.3 |
294.8 |
13,933.5 |
12,880.4 |
177.0 |
2,604.1 |
|
PIMA |
5.4 |
107.7 |
121.5 |
19.2 |
720.0 |
455.7 |
0.0 |
4.1 |
This summary is based on reports from exporters for the period July 2-8, 2021.
Wheat: Net sales of 424,700 metric tons (MT) for 2021/2022 were up 46 percent from the previous week and 44 percent from the prior 4-week average. Increases were primarily for unknown destinations (132,700 MT), the Philippines (80,100 MT), Japan (58,900 MT), Mexico (34,500 MT, including decreases of 600 MT), and Ecuador (31,500 MT). Exports of 365,900 MT were down 5 percent from the previous week, but up 4 percent from the prior 4-week average. The destinations were primarily to Japan (71,800 MT), the Philippines (64,100 MT), Mexico (56,000 MT), Nigeria (47,400 MT), and the United Arab Emirates (44,000 MT).
Late Reporting: For 2020/2021, net sales and exports totaling 10,100 MT of durum wheat were reported late for Italy.
Corn: Net sales of 138,800 MT for 2020/2021 were down 20 percent from the previous week, but up 31 percent from the prior 4-week average. Increases primarily for Japan (191,500 MT, including 134,300 MT switched from unknown destinations and decreases of 2,800 MT), Mexico (77,700 MT, including decreases of 1,900 MT), El Salvador (23,000 MT, including 22,000 MT switched from Guatemala), Jamaica (18,800 MT), and Venezuela (7,300 MT), were offset by reductions primarily for unknown destinations (104,300 MT). For 2021/2022, net sales of 133,200 MT primarily for unknown destinations (76,600 MT), Mexico (32,000 MT), Japan (16,000 MT), Colombia (4,500 MT), and Taiwan (4,000 MT)), were offset by reductions for Nicaragua (2,000 MT). Exports of 1,061,700 MT were down 18 percent from the previous week and 26 percent from the prior 4-week average. The destinations were primarily to China (477,600 MT), Mexico (253,700 MT), Japan (191,500 MT), Guatemala (67,600 MT), and Costa Rica (29,900 MT).
Optional Origin Sales: For 2020/2021, the current outstanding balance of 30,500 MT is for unknown destinations. For 2021/2022, the current outstanding balance of 60,000 MT is for unknown destinations.
Barley: No net sales or exports were reported for the week.
Sorghum: Total net sales for 2020/2021 of 400 MT were for China. Exports of 71,400 MT were up noticeably from the previous week and from the prior 4-week average. The destination was to China.
Rice: Net sales of 9,800 MT for 2020/2021 were down 51 percent from the previous week and 74 percent from the prior 4-week average. Increases primarily for Honduras (2,500 MT), Canada (2,400 MT), Mexico (2,300 MT), Saudi Arabia (2,100 MT), and Singapore (200 MT), were offset by reductions for El Salvador (400 MT). Exports of 64,800 MT were up 90 percent from the previous week and 16 percent from the prior 4-week average. The destinations were primarily to Mexico (29,900 MT), Haiti (12,200 MT), Guatemala (10,300 MT), El Salvador (3,600 MT), and Japan (2,900 MT).
Exports for Own Account: For 2020/2021, the current exports for own account outstanding balance is 100 MT, all Canada.
Soybeans: Net sales of 21,700 MT for 2020/2021 were down 66 percent from the previous week and 76 percent from the prior 4-week average. Increases primarily for Indonesia (61,500 MT, including 68,000 MT switched from unknown destination and decreases of 10,700 MT), France (18,500 MT, including 19,100 MT switched from unknown destinations and decreases of 600 MT), Japan (12,600 MT, including 10,000 MT switched from unknown destinations), the Netherlands (10,800 MT, switched from unknown destinations), and Cuba (8,000 MT), were offset by reductions primarily for unknown destinations (107,900 MT). For 2021/2022, net sales of 290,800 MT were for Mexico (248,600 MT), unknown destinations (19,700 MT), Japan (18,000 MT), Malaysia (2,500 MT), and Vietnam (2,000 MT). Exports of 197,700 MT were down 11 percent from the previous week, but up 4 percent from the prior 4-week average. The destinations were primarily to Indonesia (70,000 MT), Mexico (28,000 MT), Colombia (19,000 MT), France (18,500 MT), and Costa Rica (16,500 MT).
Exports for Own Account: For 2020/2021, the current exports for own account outstanding balance is 5,800 MT, all Canada.
Soybean Cake and Meal: Net sales of 70,700 MT for 2020/2021–a marketing-year low–were down 67 percent from the previous week and 72 percent from the prior 4-week average. Increases primarily for unknown destinations (20,000 MT), Israel (10,000 MT), Vietnam (7,700 MT), Mexico (7,000 MT, including decreases of 16,200 MT), and Jamaica (7,000 MT), were offset by reductions primarily for Guatemala (2,800 MT). For 2021/2022, net sales of 126,400 MT were reported for Mexico (123,300 MT) and Canada (3,100 MT). Exports of 253,400 MT were up 49 percent from the previous week and 53 percent from the prior 4-week average. The destinations were primarily to Vietnam (107,700 MT), Ecuador (31,800 MT), Morocco (26,000 MT), Guatemala (24,300 MT), and Canada (22,300 MT).
Soybean Oil: Total net sales reductions for 2020/2021 of 900 MT were reported for Canada. Exports of 1,100 MT were down 75 percent from the previous week and 78 percent from the prior 4-week average. The destinations were to Mexico (600 MT) and Canada (500 MT).
Cotton: Net sales of 34,500 RB for 2020/2021 were down 34 percent from the previous week and 51 percent from the prior 4-week average. Increases primarily for Turkey (11,400 RB), Pakistan (7,500 RB, including 1,800 RB switched from Vietnam and decreases of 700 RB), Bangladesh (3,500 RB, switched from Vietnam), Vietnam (3,500 RB), and China (3,500 RB), were offset by reductions for Japan (1,300 RB). For 2021/2022, net sales of 116,400 RB were primarily for Turkey (58,600 RB), Pakistan (25,400 RB), Vietnam (13,200 RB), Guatemala (7,000 RB), and China (4,900 RB). Exports of 185,900 RB were down 37 percent from the previous week and 31 percent from the prior 4-week average. Exports were primarily to Vietnam (38,200 RB), Pakistan (32,500 RB), Turkey (22,200 RB), Mexico (22,100 RB), and China (22,100 RB). Net sales of Pima totaling 6,000 RB were up 10 percent from the previous week and 25 percent from the prior 4-week average. Increases were primarily for India (3,400 RB), Pakistan (1,000 RB), China (400 RB), Turkey (400 RB), and Germany (400 RB). Total net sales for 2021/2022, of 300 RB were for Japan. Exports of 3,400 RB–a marketing-year low–were down 82 percent from the previous week and 76 percent from the prior 4-week average. The destinations were primarily to India (1,100 RB), Pakistan (800 RB), Turkey (600 RB), Greece (400 RB), and Peru (300 RB).
Exports for Own Account: For 2020/2021, new exports for own account totaling 1,000 RB were for Vietnam. The current exports for own account outstanding balance of 5,700 RB is for China (4,700 RB) and Vietnam (1,000 RB).
Hides and Skins: Net sales of 337,300 pieces for 2021 were down 15 percent from the previous week and 32 percent from the prior 4-week average. Increases primarily for China (253,000 whole cattle hides, including decreases of 4,900 pieces), South Korea (42,600 whole cattle hides, including decreases of 800 pieces), Mexico (18,900 whole cattle hides, including decreases of 800 pieces), Thailand (10,300 whole cattle hides, including decreases of 100 pieces), and Brazil (6,200 whole cattle hides, including decreases of 100 pieces), were offset by reductions for India (700 pieces). Total net sales reductions for 2021 of 100 kip skins were for Belgium. Exports of 284,300 pieces were down 26 percent from the previous week and 21 percent from the prior 4-week average. Whole cattle hides exports were primarily to China (199,300 pieces), South Korea (34,600 pieces), Mexico (18,900 pieces), Brazil (10,700 pieces), and Thailand (10,600 pieces). In addition, exports of 1,300 kip skins were to Belgium.
Net sales of 261,000 wet blues for 2021 were up noticeably from the previous week and from the prior 4-week average. Increases primarily for Vietnam (90,500 unsplit, including decreases of 100 unsplit), Italy (74,100 unsplit, including decreases of 100 unsplit and 100 grain splits), China (57,900 unsplit, including decreases of 100 unsplit), Thailand (16,700 unsplit), and Brazil (12,100 unsplit). Total net sales for 2022 of 42,800 unsplit were for Italy. Exports of 123,500 wet blues were up 4 percent from the previous week, but down 17 percent from the prior 4-week average. The destinations were to China (33,100 unsplit), Vietnam (32,500 unsplit), Italy (19,800 unsplit and 3,200 grain splits), Taiwan (16,200 unsplit), and Mexico (6,200 grain splits and 2,600 unsplit). Net sales of 334,700 splits were reported for Taiwan (168,000 pounds), Vietnam (164,900 pounds), and China (1,800 pounds). Exports of 75,500 pounds were to China.
Beef: Net sales of 9,300 MT reported for 2021 were down 61 percent from the previous week and 44 percent from the prior 4-week average. Increases primarily for Japan (3,000 MT, including decreases of 700 MT), Mexico (1,800 MT), China (1,600 MT, including decreases of 100 MT), Taiwan (700 MT, including decreases of 200 MT), and South Korea (600 MT, including decreases of 700 MT), were offset by reductions for Indonesia (100 MT). Exports of 15,500 MT were down 13 percent from the previous week and 15 percent from the prior 4-week average. The destinations were primarily to Japan (4,100 MT), South Korea (3,800 MT), China (3,300 MT), Taiwan (1,100 MT), and Mexico (1,000 MT).
Pork: Net sales of 10,600 MT reported for 2021 were down 76 percent from the previous week and 68 percent from the prior 4-week average. Increases primarily for Mexico (5,300 MT, including decreases of 1,100 MT), Japan (3,100 MT, including decreases of 200 MT), Honduras (900 MT), Colombia (800 MT, including decreases of 100 MT), and Chile (500 MT), were offset by reductions primarily for China (1,300 MT). Exports of 25,200 MT–a marketing-year low–were down 17 percent from the previous week and 25 percent from the prior 4-week average. The destinations were primarily to Mexico (11,400 MT), China (4,900 MT), Japan (3,500 MT), Canada (1,300 MT), and South Korea (1,200 MT).
Terry Reilly
Senior Commodity Analyst – Grain and Oilseeds
Futures International
One Lincoln Center
18 W 140 Butterfield Rd.
Oakbrook Terrace, Il. 60181
W: 312.604.1366
ICE IM: treilly1
Skype: fi.treilly

Trading of futures, options, swaps and other derivatives is risky and is not suitable for all persons. All of these investment products are leveraged, and you can lose more than your initial deposit. Each investment product is offered only to and from jurisdictions where solicitation and sale are lawful, and in accordance with applicable laws and regulations in such jurisdiction. The information provided here should not be relied upon as a substitute for independent research before making your investment decisions. Futures International, LLC is merely providing this information for your general information and the information does not take into account any particular individual’s investment objectives, financial situation, or needs. All investors should obtain advice based on their unique situation before making any investment decision. The contents of this communication and any attachments are for informational purposes only and under no circumstances should they be construed as an offer to buy or sell, or a solicitation to buy or sell any future, option, swap or other derivative. The sources for the information and any opinions in this communication are believed to be reliable, but Futures International, LLC does not warrant or guarantee the accuracy of such information or opinions. Futures International, LLC and its principals and employees may take positions different from any positions described in this communication. Past results are not necessarily indicative of future results.