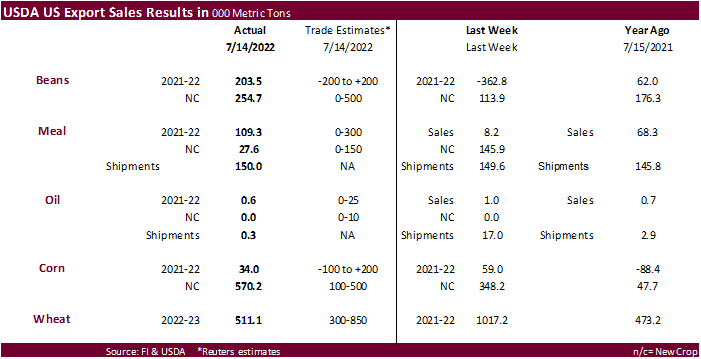
Old crop soybeans posted a positive number just above trade expectations. New crop corn was above a trade range and wheat sales were good. Other sales posted were ok to poor.
U.S. EXPORT SALES FOR WEEK ENDING 7/14/2022
|
|
CURRENT MARKETING YEAR |
NEXT MARKETING YEAR |
||||||
|
COMMODITY |
NET SALES |
OUTSTANDING SALES |
WEEKLY EXPORTS |
ACCUMULATED EXPORTS |
NET SALES |
OUTSTANDING SALES |
||
|
CURRENT YEAR |
YEAR |
CURRENT YEAR |
YEAR |
|||||
|
|
THOUSAND METRIC TONS |
|||||||
|
WHEAT |
|
|
|
|
|
|
|
|
|
HRW |
140.6 |
1,561.5 |
1,631.1 |
109.7 |
615.5 |
858.9 |
0.0 |
0.0 |
|
SRW |
92.2 |
1,227.4 |
967.4 |
5.4 |
271.7 |
332.6 |
0.0 |
30.0 |
|
HRS |
185.7 |
1,571.1 |
1,533.0 |
2.4 |
624.3 |
742.3 |
0.0 |
0.0 |
|
WHITE |
92.6 |
1,241.7 |
1,065.1 |
24.3 |
329.3 |
408.2 |
0.0 |
0.0 |
|
DURUM |
0.0 |
124.4 |
8.4 |
0.0 |
18.0 |
41.7 |
0.0 |
0.0 |
|
TOTAL |
511.1 |
5,726.1 |
5,205.1 |
141.8 |
1,858.7 |
2,383.7 |
0.0 |
30.0 |
|
BARLEY |
0.0 |
12.8 |
23.5 |
0.0 |
2.7 |
1.6 |
0.0 |
0.0 |
|
CORN |
33.9 |
5,926.6 |
9,019.4 |
1,109.1 |
54,523.6 |
60,751.2 |
570.2 |
7,406.5 |
|
SORGHUM |
5.9 |
350.0 |
710.9 |
108.2 |
6,611.7 |
6,467.4 |
0.0 |
0.0 |
|
SOYBEANS |
203.5 |
6,624.2 |
3,132.2 |
499.9 |
52,973.4 |
58,855.8 |
254.7 |
14,106.3 |
|
SOY MEAL |
109.3 |
1,874.6 |
2,069.7 |
150.0 |
9,508.1 |
9,519.9 |
27.6 |
749.8 |
|
SOY OIL |
0.6 |
66.2 |
16.9 |
0.3 |
621.0 |
660.3 |
0.0 |
0.1 |
|
RICE |
|
|
|
|
|
|
|
|
|
L G RGH |
0.0 |
57.7 |
189.8 |
0.6 |
1,280.8 |
1,611.3 |
5.0 |
18.1 |
|
M S RGH |
0.0 |
10.5 |
8.0 |
3.4 |
17.6 |
25.9 |
0.0 |
0.0 |
|
L G BRN |
0.5 |
3.2 |
11.5 |
0.2 |
52.1 |
40.0 |
0.0 |
0.0 |
|
M&S BR |
0.1 |
8.5 |
0.7 |
0.4 |
79.1 |
156.2 |
0.0 |
0.0 |
|
L G MLD |
20.3 |
74.0 |
46.8 |
26.9 |
790.3 |
645.5 |
40.1 |
40.1 |
|
M S MLD |
1.1 |
105.6 |
113.0 |
1.5 |
431.9 |
579.8 |
0.0 |
0.0 |
|
TOTAL |
22.0 |
259.4 |
369.7 |
33.0 |
2,651.8 |
3,058.6 |
45.1 |
58.3 |
|
COTTON |
|
THOUSAND RUNNING BALES |
||||||
|
UPLAND |
54.1 |
3,172.4 |
1,825.3 |
330.8 |
12,532.2 |
14,365.2 |
113.2 |
4,701.0 |
|
PIMA |
-2.6 |
37.5 |
103.3 |
5.3 |
442.0 |
733.8 |
0.4 |
59.5 |
This summary is based on reports from exporters for the period July 8-14, 2022.
Wheat: Net sales of 511,100 metric tons (MT) for 2022/2023 were down 50 percent from the previous week and 10 percent from the prior 4-week average. Increases primarily for the Philippines (110,100 MT, including decreases of 1,400 MT), unknown destination (107,000 MT), Nigeria (89,800 MT, including decreases of 2,200 MT), Mexico (50,700 MT, including decreases of 100 MT), and Taiwan (44,700 MT), were offset by reductions for Egypt (32,000 MT), South Korea (19,200 MT), and Honduras (700 MT). Exports of 141,800 MT were down 48 percent from the previous week and 50 percent from the prior 4-week average. The destinations were primarily to Nigeria (27,800 MT), Brazil (26,000 MT), the Philippines (22,600 MT), Venezuela (21,300 MT), and Honduras (18,300 MT).
Corn: Net sales of 33,900 MT for 2021/2022 were down 43 percent from the previous week and 82 percent from the prior 4-week average. Increases primarily for Japan (87,300 MT, including 87,700 MT switched from unknown destinations and decreases of 2,600 MT), Mexico (38,800 MT, including decreases of 1,900 MT), Venezuela (10,200 MT switched from unknown destinations), El Salvador (2,000 MT), and South Korea (1,400 MT, including decreases of 1,000 MT), were offset by reductions primarily for unknown destinations (94,600 MT). Net sales of 570,200 MT for 2022/2023 primarily for unknown destinations (162,700 MT), Mexico (158,700 MT), Japan (85,100 MT), China (66,500 MT), and Honduras (49,900 MT), were offset by reductions for Canada (2,500 MT). Exports of 1,109,100 MT were up 21 percent from the previous week and 2 percent from the prior 4-week average. The destinations were primarily to China (455,700 MT), Mexico (307,100 MT), Japan (228,200 MT), Canada (44,800 MT), and Costa Rica (30,600 MT).
Optional Origin Sales: For 2021/2022, the current outstanding balance of 108,300 MT is for unknown destinations (65,000 MT), Italy (34,300 MT), and Saudi Arabia (9,000 MT). For 2022/2023, the current outstanding balance of 35,400 MT is for Italy.
Barley: No net sales or exports were reported for the week.
Sorghum: Net sales of 5,900 MT for 2021/2022 were down noticeably from the previous week and down 84 percent from the prior 4-week average. Increases were reported for Eritrea (2,400 MT), China (2,100 MT), and Mexico (1,400 MT, including decreases of 300 MT). Exports of 108,200 MT were down 42 percent from the previous week and 10 percent from the prior 4-week average. The destinations were to China (72,400 MT), Eritrea (32,400 MT), and Mexico (3,400 MT).
Rice: Net sales of 22,000 MT for 2021/2022 were down 20 percent from the previous week and 8 percent from the prior 4-week average. Increases were primarily for the Dominican Republic (10,000 MT), Haiti (7,100 MT, including decreases of 100 MT), Canada (2,400 MT, including decreases of 100 MT), Saudi Arabia (1,800 MT), and Mexico (400 MT). Net sales of 45,100 MT for 2022/2023 were reported for Iraq (40,000 MT), Honduras (5,000 MT), and the Leeward and Windward Islands (100 MT). Exports of 33,000 MT were down 30 percent from the previous week and 26 percent from the prior 4-week average. The destinations were primarily to Haiti (15,200 MT), the Dominican Republic (10,000 MT), Mexico (4,500 MT), Canada (1,900 MT), and Taiwan (400 MT).
Soybeans: Net sales of 203,500 MT for 2021/2022 were primarily for China (146,900 MT, including 125,000 MT switched from unknow destinations), Indonesia (72,200 MT, including 68,000 MT switched from unknown destinations and decreases of 100 MT), Germany (68,800 MT), Japan (55,100 MT, including 50,200 MT switched from unknown destinations and decreases of 2,900 MT), and Mexico (13,200 MT, including decreases of 300 MT), were offset by reductions for unknown destinations (172,900 MT). Net sales of 254,700 MT for 2022/2023 were primarily for China (136,000 MT), Egypt (52,000 MT), Mexico (27,000 MT), unknown destinations (19,000 MT), and Japan (13,500 MT). Exports of 499,900 MT were up 13 percent from the previous week and 10 percent from the prior 4-week average. The destinations were primarily to China (140,000 MT), Japan (117,800 MT), Indonesia (80,900 MT), Germany (68,800 MT), and Mexico (56,800 MT).
Export for Own Account: For 2021/2022, the current exports for own account outstanding balance is 6,300 MT, all Canada.
Export Adjustment: Accumulated exports of soybeans to the Netherlands were adjusted down 68,786 MT for week ending June 30th. The correct destination for this shipment is Germany.
Soybean Cake and Meal: Net sales of 109,300 MT for 2021/2022 were up noticeably from the previous week and from the prior 4-week average. Increases primarily for the Philippines (96,500 MT), Panama (11,800 MT, including 10,800 MT switched from Colombia), Canada (11,200 MT, including decreases of 200 MT), Costa Rica (6,000 MT), and Mexico (5,000 MT), were offset by reductions primarily for the Dominican Republic (22,300 MT), unknown destinations (1,400 MT), and Belgium (1,200 MT). Net sales of 27,600 MT for 2022/2023 were primarily for Honduras (16,800 MT) and the Dominican Republic (6,200 MT). Exports of 150,000 MT were unchanged from the previous week, but down 33 percent from the prior 4-week average. The destinations were primarily to the Philippines (49,900 MT), Mexico (24,400 MT), Colombia (22,200 MT), Canada (21,400 MT), and Panama (10,800 MT).
Soybean Oil: Net sales of 600 MT for 2021/2022 were down 38 percent from the previous week and 29 percent from the prior 4-week average. Increases were reported for Canada (300 MT) and Guatemala (300 MT). Exports of 300 MT were down 98 percent from the previous week and 95 percent from the prior 4-week average. The destination was to Canada.
Cotton: Net sales of 54,100 RB for 2021/2022 were up noticeably from the previous week and up 93 percent from the prior 4-week average. Increases primarily for Vietnam (64,200 RB, including decreases of 100 RB), China (3,100 RB, including decreases of 9,000 RB), Indonesia (2,100 RB, including 700 RB switched from Pakistan, 400 RB switched from Japan, and decreases of 100 RB), Honduras (800 RB), and Thailand (700 RB, including 300 RB switched from Japan), were offset by reductions primarily for Pakistan (13,500 RB), South Korea (2,200 RB), and Japan (1,100 RB). Net sales of 113,200 RB for 2022/2023 primarily for Vietnam (37,400 RB), Turkey (29,000 RB), Malaysia (9,200 RB), Ecuador (7,600 RB), and Honduras (6,600 RB), were offset by reductions for El Salvador (100 RB). Exports of 330,800 RB were up 6 percent from the previous week, but down 7 percent from the prior 4-week average. The destinations were primarily to China (116,500 RB), Vietnam (53,900 RB), Turkey (42,800 RB), Pakistan (22,200 RB), and Mexico (21,900 RB). Net sales reductions of 2,600 RB of Pima–a marketing-year low–were down noticeably from the previous week and from the prior 4-week average. Increases reported for Thailand (900 RB), were more than offset by reductions for India (3,500 MT). Total net sales of 400 RB for 2022/2023 were reported for India. Exports of 5,300 RB were up 23 percent from the previous week, but down 21 percent from the prior 4-week average. The destinations were to China (2,300 RB), India (1,200 RB), Egypt (600 RB), Vietnam (400 RB), and Taiwan (400 RB).
Optional Origin Sales: For 2021/2022, options were exercised to export 3,700 RB to Vietnam from the United States. The current outstanding balance of 9,000 RB is for Vietnam (6,500 RB) and Pakistan (2,500 RB).
Export for Own Account: For 2021/2022, new exports for own account totaling 300 RB were to Pakistan. Exports for own account totaling 8,100 RB to China (5,200 RB) and Vietnam (3,000 RB) were applied to new or outstanding sales. The current exports for own account outstanding balance of 58,200 RB is for China (32,500 RB), Vietnam (20,600 RB), Indonesia (4,800 RB), and Pakistan (300 RB).
Hides and Skins: Net sales of 499,000 pieces for 2022 were up 78 percent from the previous week and 42 percent from the prior 4-week average. Increases primarily for China (344,500 whole cattle hides, including decreases of 7,600 pieces), Mexico (63,800 whole cattle hides, including decreases of 1,500 pieces), Thailand (32,300 whole cattle hides, including decreases of 1,000 pieces), Indonesia (17,800 whole cattle hides, including decreases of 200 pieces), and South Korea (12,700 whole cattle hides, including decreases of 3,000 pieces), were offset by reductions for Vietnam (200 pieces). In addition, total net sales reductions of 7,200 calf skins were for Italy. Exports of 451,900 pieces were up 62 percent from the previous week and 28 percent from the prior 4-week average. Whole cattle hides exports were primarily to China (258,100 pieces), South Korea (67,000 pieces), Mexico (54,900 pieces), Thailand (31,000 pieces), and Indonesia (10,800 pieces).
Net sales of 76,800 wet blues for 2022 were down 46 percent from the previous week and 57 percent from the prior 4-week average. Increases primarily for Thailand (21,800 unsplit, including decreases of 1,000 unsplit), China (21,400 unsplit), Taiwan (12,400 unsplit), Vietnam (9,200 unsplit), and India (6,800 grain splits and 1,300 unsplit), were offset by reductions for Portugal (200 grain splits) and Italy (100 unsplit). Exports of 174,200 wet blues were up noticeably from the previous week and up 66 percent from the prior 4-week average. The destinations were primarily to China (51,300 unsplit), Italy (48,100 unsplit and 1,500 grain splits), Thailand (30,500 unsplit), Vietnam (26,500 unsplit), and Taiwan (4,600 unsplit and 1,700 grain splits). Net sales of 682,000 splits were up noticeably from the previous week and from the prior 4-week average. Increases reported for Vietnam (621,500 pounds) and Taiwan (80,000 pounds), were offset by reductions for South Korea (19,500 pounds). Exports of 243,500 pounds were down 24 percent from the previous week and 44 percent from the prior 4-week average. The destinations were to Vietnam (200,000 pounds) and China (43,500 pounds).
Beef: Net sales of 23,800 MT for 2022 were up noticeably from the previous week and up 97 percent from the prior 4-week average. Increases primarily for South Korea (7,700 MT, including decreases of 500 MT), Japan (5,800 MT, including decreases of 500 MT), China (3,100 MT, including decreases of 100 MT), Mexico (1,900 MT, including decreases of 100 MT), and Hong Kong (1,600 MT, including decreases of 100 MT), were offset by reductions for the United Arab Emirates (200 MT) and Chile (100 MT). Exports of 19,600 MT were up 14 percent from the previous week and 3 percent from the prior 4-week average. The destinations were primarily to Japan (5,800 MT), South Korea (5,500 MT), China (3,300 MT), Mexico (1,200 MT), and Taiwan (1,100 MT).
Pork: Net sales of 20,600 MT for 2022 were up 13 percent from the previous week, but down 23 percent from the prior 4-week average. Increases were primarily for Mexico (10,500 MT, including decreases of 400 MT), Japan (2,600 MT, including decreases of 200 MT), China (2,500 MT, including decreases of 300 MT), Canada (1,600 MT, including decreases of 400 MT), and Colombia (1,600 MT, including decreases of 100 MT). Exports of 26,700 MT were up 16 percent from the previous week, but down 5 percent from the prior 4-week average. The destinations were primarily to Mexico (11,300 MT), China (4,400 MT), Japan (4,200 MT), South Korea (2,000 MT), and Canada (1,300 MT).
July 21, 2022 1 FOREIGN AGRICULTURAL SERVICE/USDA
*No daily sales were reported for the week.
Terry Reilly
Senior Commodity Analyst – Grain and Oilseeds
Futures International
One Lincoln Center
18 W 140 Butterfield Rd.
Oakbrook Terrace, Il. 60181
W: 312.604.1366
ICE IM: treilly1
Skype: fi.treilly

Trading of futures, options, swaps and other derivatives is risky and is not suitable for all persons. All of these investment products are leveraged, and you can lose more than your initial deposit. Each investment product is offered only to and from jurisdictions where solicitation and sale are lawful, and in accordance with applicable laws and regulations in such jurisdiction. The information provided here should not be relied upon as a substitute for independent research before making your investment decisions. Futures International, LLC is merely providing this information for your general information and the information does not take into account any particular individual’s investment objectives, financial situation, or needs. All investors should obtain advice based on their unique situation before making any investment decision. The contents of this communication and any attachments are for informational purposes only and under no circumstances should they be construed as an offer to buy or sell, or a solicitation to buy or sell any future, option, swap or other derivative. The sources for the information and any opinions in this communication are believed to be reliable, but Futures International, LLC does not warrant or guarantee the accuracy of such information or opinions. Futures International, LLC and its principals and employees may take positions different from any positions described in this communication. Past results are not necessarily indicative of future results.