PDF attached
US GDP Annualized (Q/Q) Q2 A: -0.9% (est 0.4%; prev -1.6%)
– US Personal Consumption Q2 A: 1.0% (est 1.2%; prev 1.8%)
– US GDP Price Index Q2 A: 8.7% (est 8.0%; prev 8.2%)
– US Core PCE (Q/Q) Q2 A: 4.4% (est 4.4%; prev 5.2%)
US Initial Jobless Claims Jul 23: 256K (est 250K; prev 251K; prevR 261K)
– Continuing Jobless Claims Jul 16: 1359K (est 1386K; prev 1384K)
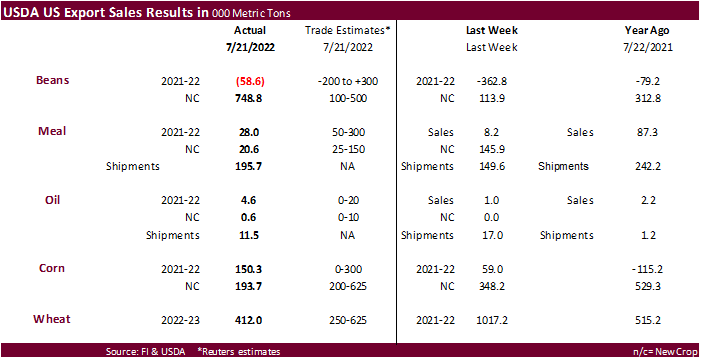
USDA Export sales
Good for new-crop soybean sales of 748,800 tons. China bought 538,000 tons of new-crop soybeans followed by 199,000 tons for unknown. Old crop soybean sales were negative 58,600 tons. Product sales were near of below expectations. Corn export sales were at the low end of expectations for combined crop years. All-wheat sales were 412,000 tons, within expectations. Pork sales were 21,600 tons and included 13,100 tons for Mexico and 3,500 tons for Japan.
IMPORTANT NOTICE: The upgraded Export Sales Reporting and Maintenance System 2.0 (ESRMS 2.0) is scheduled to be launched on Thursday, August 18, 2022. ESRMS 2.0 will be available from the following url: https://esrms.fas.usda.gov/#/home
This summary is based on reports from exporters for the period July 15-21, 2022.
Wheat: Net sales of 412,000 metric tons (MT) for 2022/2023 were down 19 percent from the previous week and 29 percent from the prior 4-week average. Increases primarily for the Philippines (98,100 MT, including 33,000 MT switched from unknown destinations), Mexico (67,800 MT, including decreases of 900 MT), Thailand (56,300 MT), unknown destinations (43,000 MT), and Honduras (36,000 MT), were offset by reductions for Canada (100 MT). Exports of 345,800 MT were up noticeably from the previous week and up 47 percent from the prior 4-week average. The destinations were primarily to Mexico (103,100 MT), the Philippines (65,100 MT), Colombia (60,100 MT), Japan (34,300 MT), and Morocco (31,900 MT).
Corn: Net sales of 150,300 MT for 2021/2022 were up noticeably from the previous week and from the prior 4-week average. Increases primarily for Mexico (70,000 MT, including decreases of 10,500 MT), Japan (41,700 MT, including 38,700 MT switched from unknown destinations), Colombia (15,500 MT, including 14,500 MT switched from unknown destinations and decreases of 1,100 MT), Guyana (10,400 MT switched from unknown destinations), and Guatemala (9,300 MT, including 3,100 MT switched from El Salvador), were offset by reductions primarily for El Salvador (3,400 MT), Canada (2,100 MT), Taiwan (100 MT), and South Korea (100 MT). Net sales of 193,700 MT for 2022/2023 primarily for Mexico (107,300 MT), unknown destinations (59,600 MT), and Costa Rica (19,800 MT), were offset by reductions for Taiwan (300 MT) and Honduras (100 MT). Exports of 867,900 MT were down 22 percent from the previous week and 19 percent from the prior 4-week average. The destinations were primarily to Mexico (396,000 MT), China (208,000 MT), Japan (72,300 MT), Guatemala (65,400 MT), and Colombia (47,500 MT).
Optional Origin Sales: For 2021/2022, the current outstanding balance of 108,300 MT is for unknown destinations (65,000 MT), Italy (34,300 MT), and Saudi Arabia (9,000 MT). For 2022/2023, the current outstanding balance of 35,400 MT is for Italy.
Barley: No net sales or exports were reported for the week.
Sorghum: Net sales of 3,400 MT for 2021/2022 were down 42 percent from the previous week and 78 percent from the prior 4-week average. Increases were reported for Mexico (1,700 MT, including decreases of 300 MT) and China (1,700 MT). Total net sales of 67,000 MT for 2022/2023 were for China. Exports of 72,800 MT were down 33 percent from the previous week and 34 percent from the prior 4-week average. The destination was primarily to China (70,000 MT).
Rice: Net sales of 22,100 MT for 2021/2022 were up 1 percent from the previous week, but down 9 percent from the prior 4-week average. Increases were primarily for Haiti (15,100 MT, including decreases of 200 MT), Canada (3,000 MT), Honduras (2,400 MT, including decreases of 100 MT), and Mexico (1,600 MT). Net sales of 5,200 MT for 2022/2023 were primarily for Honduras (5,000 MT). Exports of 37,100 MT were up 13 percent from the previous week, but down 7 percent from the prior 4-week average. The destinations were primarily to Haiti (15,200 MT), Japan (12,400 MT), Honduras (4,900 MT), Canada (2,300 MT), and Mexico (1,100 MT).
Soybeans: Net sales reductions of 58,600 MT for 2021/2022 primarily for the Netherlands (57,000 MT, including 63,000 MT switched from unknown destinations and decreases of 6,000 MT), Egypt (55,000 MT, including 50,000 MT switched from unknown destinations), Mexico (14,500 MT, including decreases of 1,100 MT), Indonesia (13,900 MT, including decreases of 100 MT), and Japan (10,800 MT, including 10,000 MT switched from unknown destinations and decreases of 100 MT), were offset by reductions for unknown destinations (204,200 MT) and China (30,800 MT). Net sales of 748,800 MT for 2022/2023 were primarily for China (538,000 MT) and unknown destinations (199,000 MT). Exports of 395,400 MT were down 21 percent from the previous week and 14 percent from the prior 4-week average. The destinations were primarily to Mexico (163,900 MT), the Netherlands (57,000 MT), Bangladesh (57,000 MT), Egypt (55,000 MT), and Japan (14,800 MT).
Export for Own Account: For 2021/2022, the current exports for own account outstanding balance is 6,300 MT, all Canada.
Soybean Cake and Meal: Net sales of 28,000 MT for 2021/2022 were down 74 percent from the previous week and 61 percent from the prior 4-week average. Increases primarily for Mexico (10,800 MT), Jamaica (6,500 MT), Guyana (5,600 MT switched from unknown destinations), Canada (5,300 MT, including decreases of 200 MT), and Nicaragua (5,000 MT, including 3,000 MT switched from Guatemala and 1,100 MT switched from Honduras), were offset by reductions primarily for unknown destinations (5,600 MT), Belgium (4,300 MT), Colombia (2,400 MT), and Honduras (1,700 MT). Net sales of 20,600 MT for 2022/2023 were reported for Ecuador (10,000 MT), Costa Rica (4,800 MT), Honduras (3,100 MT), and Canada (2,700 MT). Exports of 195,700 MT were up 31 percent from the previous week, but down 6 percent from the prior 4-week average. The destinations were primarily to Guatemala (37,600 MT), Ecuador (36,900 MT), Colombia (32,600 MT), Canada (24,200 MT), and the Dominican Republic (15,100 MT).
Soybean Oil: Total net sales of 4,600 MT for 2021/2022 were up noticeably from the previous week and from the prior 4-week average. The destination was Canada, including decreases of 300 MT. Total net sales of 600 MT for 2022/2023 were for Canada. Exports of 11,500 MT were up noticeably from the previous week and from the prior 4-week average. The destinations were to Guatemala (6,500 MT), Canada (3,300 MT), Mexico (900 MT), and Costa Rica (800 MT).
Cotton: Net sales reductions of 4,000 RB for 2021/2022–a marketing-year low–were down noticeably from the previous week and from the prior 4-week average. Increases reported for Vietnam (6,400 RB, including 2,200 RB switched from South Korea and decreases of 200 RB), Ecuador (700 RB, including decreases of 100 RB), Japan (400 RB, including decreases of 500 RB), Mexico (200 RB, including decreases of 200 RB), and Honduras (200 RB), were more than offset by reductions primarily for Turkey (6,000 RB), China (2,900 RB), South Korea (1,600 RB), Germany (500 RB), and Indonesia (300 RB). Net sales of 55,700 RB for 2022/2023 were primarily for Vietnam (26,000 RB), Turkey (8,800 RB), Malaysia (6,600 RB), Bangladesh (4,000 RB), and Pakistan (3,100 RB). Exports of 252,900 RB were down 24 percent from the previous week and 27 percent from the prior 4-week average. The destinations were primarily to China (70,000 RB), Vietnam (45,000 RB), India (27,200 RB), Bangladesh (23,200 RB), and Pakistan (21,400 RB). No net sales of Pima for 2021/2022 were reported for the week. Net sales of 4,900 RB for 2022/2023 were primarily for India (4,400 RB) and South Korea (500 RB). Exports of 3,200 RB were down 41 percent from the previous week and 52 percent from the prior 4-week average. The destinations were primarily to China (1,400 RB), India (600 RB), Taiwan (400 RB), Turkey (400 RB) and Peru (100 RB).
Optional Origin Sales: For 2021/2022, options were exercised to export 5,000 RB to Vietnam from the United States. The current outstanding balance of 4,000 RB is for Pakistan (2,500 RB) and Vietnam (1,500 RB).
Export for Own Account: For 2021/2022, new exports for own account totaling 7,000 RB were to Vietnam (5,900 RB) and China (1,100 RB). The current exports for own account outstanding balance of 65,300 RB is for China (33,700 RB), Vietnam (26,500 RB), Indonesia (4,800 RB), and Pakistan (300 RB).
Hides and Skins: Net sales of 348,600 pieces for 2022 were down 30 percent from the previous week and 4 percent from the prior 4-week average. Increases primarily for China (277,200 whole cattle hides, including decreases of 4,700 pieces), Mexico (32,100 whole cattle hides, including decreases of 2,900 pieces), South Korea (23,400 whole cattle hides, including decreases of 100 pieces), Turkey (7,800 whole cattle hides, including decreases of 100 pieces), and Colombia (7,300 whole cattle hides), were offset by reductions primarily for Italy (14,700 pieces), Taiwan (3,400 pieces), and Vietnam (1,800 pieces). In addition, total net sales of 7,200 calf skins were for Italy. Exports of 419,600 pieces were down 7 percent from the previous week, but up 11 percent from the prior 4-week average. Whole cattle hides exports were primarily to China (209,200 pieces), Thailand (59,900 pieces), South Korea (48,800 pieces), Mexico (48,500 pieces), and Brazil (20,000 pieces).
Net sales of 70,300 wet blues for 2022 were down 8 percent from the previous week and 48 percent from the prior 4-week average. Increases primarily for Vietnam (39,600 unsplit), China (19,500 unsplit), India (2,000 grain splits and 1,300 unsplit), South Korea (3,200 grain splits), and Mexico (2,600 unsplit), were offset by reductions for Portugal (500 grain splits). Exports of 158,800 wet blues were down 9 percent from the previous week, but up 42 percent from the prior 4-week average. The destinations were primarily to Italy (42,100 unsplit and 6,000 grain splits), Thailand (38,000 unsplit), Vietnam (31,300 unsplit), China (26,700 unsplit), and Taiwan (8,000 unsplit). Net sales of 6,400 splits were down 99 percent from the previous week and 98 percent from the prior 4-week average. Increases reported for Vietnam (7,900 pounds), were offset by reductions for South Korea (1,500 pounds). Exports of 199,100 pounds were down 18 percent from the previous week and 45 percent from the prior 4-week average. The destination was to Vietnam.
Beef: Net sales of 25,300 MT for 2022 were up 6 percent from the previous week and 66 percent from the prior 4-week average. Increases were primarily for South Korea (7,900 MT, including decreases of 700 MT), Japan (7,000 MT, including decreases of 700 MT), China (3,100 MT, including decreases of 200 MT), Taiwan (2,500 MT, including decreases of 100 MT), and Mexico (1,100 MT). Exports of 20,300 MT were up 3 percent from the previous week and 5 percent from the prior 4-week average. The destinations were primarily to South Korea (6,000 MT), Japan (5,600 MT), China (2,900 MT), Mexico (1,200 MT), and Taiwan (1,100 MT).
Pork: Net sales of 21,600 MT for 2022 were up 5 percent from the previous week, but down 16 percent from the prior 4-week average. Increases were primarily for Mexico (13,100 MT, including decreases of 200 MT), Japan (3,500 MT, including decreases of 200 MT), Canada (1,300 MT, including decreases of 400 MT), South Korea (1,300 MT, including decreases of 300 MT), and China (800 MT, including decreases of 100 MT). Exports of 27,000 MT were up 1 percent from the previous week, but down 2 percent from the prior 4-week average. The destinations were primarily to Mexico (12,000 MT), China (4,100 MT), Japan (3,600 MT), South Korea (1,800 MT), and Canada (1,600 MT).
U.S. EXPORT SALES FOR WEEK ENDING 7/21/2022
|
|
CURRENT MARKETING YEAR |
NEXT MARKETING YEAR |
||||||
|
COMMODITY |
NET SALES |
OUTSTANDING SALES |
WEEKLY EXPORTS |
ACCUMULATED EXPORTS |
NET SALES |
OUTSTANDING SALES |
||
|
CURRENT YEAR |
YEAR |
CURRENT YEAR |
YEAR |
|||||
|
|
THOUSAND METRIC TONS |
|||||||
|
WHEAT |
|
|
|
|
|
|
|
|
|
HRW |
143.7 |
1,593.9 |
1,689.5 |
111.3 |
726.8 |
1,023.2 |
0.0 |
0.0 |
|
SRW |
53.5 |
1,154.2 |
1,077.2 |
126.7 |
398.4 |
390.7 |
0.0 |
30.0 |
|
HRS |
70.0 |
1,570.9 |
1,538.1 |
70.1 |
694.5 |
834.7 |
0.0 |
0.0 |
|
WHITE |
144.8 |
1,348.8 |
1,062.0 |
37.7 |
366.9 |
438.3 |
0.0 |
0.0 |
|
DURUM |
0.0 |
124.4 |
8.4 |
0.0 |
18.0 |
41.7 |
0.0 |
0.0 |
|
TOTAL |
412.0 |
5,792.2 |
5,375.3 |
345.8 |
2,204.6 |
2,728.6 |
0.0 |
30.0 |
|
BARLEY |
0.0 |
12.8 |
23.0 |
0.0 |
2.7 |
2.0 |
0.0 |
0.0 |
|
CORN |
150.3 |
5,209.0 |
7,543.2 |
867.9 |
55,391.5 |
62,112.1 |
193.7 |
7,600.2 |
|
SORGHUM |
3.4 |
280.7 |
643.2 |
72.8 |
6,684.5 |
6,537.1 |
67.0 |
67.0 |
|
SOYBEANS |
-58.6 |
6,170.2 |
2,808.7 |
395.4 |
53,368.8 |
59,100.0 |
748.8 |
14,855.1 |
|
SOY MEAL |
28.0 |
1,706.9 |
1,914.8 |
195.7 |
9,703.8 |
9,762.1 |
20.6 |
770.4 |
|
SOY OIL |
4.6 |
59.3 |
17.9 |
11.5 |
632.5 |
661.6 |
0.6 |
0.6 |
|
RICE |
|
|
|
|
|
|
|
|
|
L G RGH |
2.4 |
54.6 |
192.5 |
5.4 |
1,286.2 |
1,615.1 |
5.0 |
23.1 |
|
M S RGH |
0.0 |
10.4 |
7.8 |
0.1 |
17.7 |
26.1 |
0.0 |
0.0 |
|
L G BRN |
0.2 |
3.1 |
11.4 |
0.2 |
52.3 |
40.3 |
0.0 |
0.0 |
|
M&S BR |
0.1 |
7.9 |
0.4 |
0.6 |
79.7 |
156.6 |
0.0 |
0.0 |
|
L G MLD |
16.9 |
73.8 |
45.3 |
17.1 |
807.4 |
648.4 |
0.0 |
40.1 |
|
M S MLD |
2.6 |
94.5 |
68.7 |
13.7 |
445.6 |
626.5 |
0.2 |
0.2 |
|
TOTAL |
22.1 |
244.4 |
326.1 |
37.1 |
2,689.0 |
3,113.0 |
5.2 |
63.5 |
|
COTTON |
|
THOUSAND RUNNING BALES |
||||||
|
UPLAND |
-4.0 |
2,915.6 |
1,585.8 |
252.9 |
12,785.1 |
14,603.5 |
55.7 |
4,756.7 |
|
PIMA |
0.0 |
34.3 |
98.2 |
3.2 |
445.2 |
743.1 |
4.9 |
64.4 |
Terry Reilly
Senior Commodity Analyst – Grain and Oilseeds
Futures International
One Lincoln Center
18 W 140 Butterfield Rd.
Oakbrook Terrace, Il. 60181
W: 312.604.1366
ICE IM: treilly1
Skype: fi.treilly

Trading of futures, options, swaps and other derivatives is risky and is not suitable for all persons. All of these investment products are leveraged, and you can lose more than your initial deposit. Each investment product is offered only to and from jurisdictions where solicitation and sale are lawful, and in accordance with applicable laws and regulations in such jurisdiction. The information provided here should not be relied upon as a substitute for independent research before making your investment decisions. Futures International, LLC is merely providing this information for your general information and the information does not take into account any particular individual’s investment objectives, financial situation, or needs. All investors should obtain advice based on their unique situation before making any investment decision. The contents of this communication and any attachments are for informational purposes only and under no circumstances should they be construed as an offer to buy or sell, or a solicitation to buy or sell any future, option, swap or other derivative. The sources for the information and any opinions in this communication are believed to be reliable, but Futures International, LLC does not warrant or guarantee the accuracy of such information or opinions. Futures International, LLC and its principals and employees may take positions different from any positions described in this communication. Past results are not necessarily indicative of future results.