PDF attached
US Initial Jobless Claims Aug 13: 250K (est 264K; prev 262K; prevR 252K)
– Continuing Claims Aug 6: 1.437K (est 1450K; prev 1428K; prevR 1430K)
US Philadelphia Fed Business Outlook Aug: 6.2 (est -5; prev -12.3)
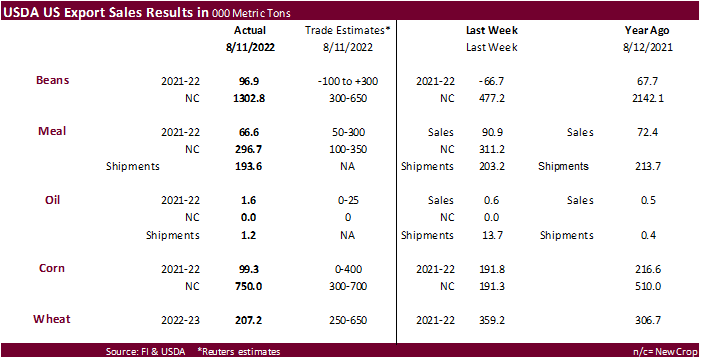
USDA Export Sales looked good with exception of soybean oil and wheat. Sales to China increased for soybeans and corn. Brazil and South Africa bought wheat from the US.
New crop soybean sales were 1.303 million tons, well up from 477,200 tons previous week and reflects some of the 24-hour sales announcements reported during the week ending Aug 11. 2022-23 sales included China (779,000 MT), unknown destinations (273,000 MT), Mexico (165,300 MT), and Egypt (60,000 MT). Old crop soybean sales of 96,900 tons were within expectations. Soybean meal sales were 66,600 MT for 2021-22. 2022-23 meal sales were a good 296,700 tons that included Mexico (123,000 MT), the Philippines (88,000 MT), and Canada (53,300 MT). Shipments for meal were 193,600 tons. Soybean oil sales were only 1,600 tons and shipments were 1,200.
Old crop corn sales were only 99,300 tons but new crop were 750,000 tons. The 2022-23 sales included China (51,300 MT, including 50,000 MT switched from unknown destinations) and Mexico (10,200 MT), were offset by reductions for unknown destinations (50,000 MT). All wheat sales were 207,200 tons, below expectations and Included Mexico (85,300 MT, including decreases of 3,100 MT), the Philippines (64,800 MT), Brazil (28,200 MT, including 25,000 MT switched from unknown destinations), Japan (26,300 MT), and South Africa (16,500 MT).
This summary is based on reports from exporters for the period August 5-11, 2022.
Wheat: Net sales of 207,200 metric tons (MT) for 2022/2023–a marketing-year low–were down 42 percent from the previous week and 46 percent from the prior 4-week average. Increases primarily for Mexico (85,300 MT, including decreases of 3,100 MT), the Philippines (64,800 MT), Brazil (28,200 MT, including 25,000 MT switched from unknown destinations), Japan (26,300 MT), and South Africa (16,500 MT), were offset by reductions primarily for unknown destinations (30,000 MT) and Portugal (18,000 MT). Exports of 349,600 MT were down 43 percent from the previous week, but up 1 percent from the prior 4-week average. The destinations were primarily to the Philippines (87,800 MT), Mexico (64,700 MT), Brazil (55,700 MT), Japan (36,200 MT), and Portugal (22,000 MT).
Corn: Net sales of 99,300 MT for 2021/2022 were down 48 percent from the previous week and 8 percent from the prior 4-week average. Increases primarily for China (71,500 MT), Colombia (13,600 MT), Honduras (11,400 MT, including 7,500 MT switched from Nicaragua, 6,000 MT switched from El Salvador, and decreases of 6,900 MT), Mexico (7,000 MT, including decreases of 26,000 MT), and Costa Rica (5,000 MT), were offset by reductions primarily for Nicaragua (7,500 MT), El Salvador (6,000 MT), and Trinidad and Tobago (1,900 MT). Net sales of 750,000 MT for 2022/2023 were primarily for unknown destinations (286,000 MT), Mexico (216,400 MT), China (136,500 MT), Guatemala (30,400 MT), and Colombia (24,000 MT). Exports of 623,000 were down 12 percent from the previous week and 33 percent from the prior 4-week average. The destinations were primarily to China (273,500 MT), Mexico (271,300 MT), Trinidad and Tobago (25,100 MT, including 200 MT – Late), Panama (24,200 MT), and Honduras (14,700 MT).
Optional Origin Sales: For 2021/2022, the current outstanding balance of 121,000 MT is for unknown destinations (65,000 MT), Italy (47,000 MT), and Saudi Arabia (9,000 MT). For 2022/2023, new optional origin sales of 3,000 MT were reported for Italy. The current outstanding balance of 51,200 MT is for Italy.
Late Reporting: For 2021/2022, exports totaling 200 MT of corn were reported late for Trinidad and Tobago.
Barley: No net sales or exports were reported for the week.
Sorghum: Net sales of 11,500 MT for 2021/2022 reported for China (51,300 MT, including 50,000 MT switched from unknown destinations) and Mexico (10,200 MT), were offset by reductions for unknown destinations (50,000 MT). Total net sales of 200 MT for 2022/2023 were for Japan. Exports of 63,600 MT were up 11 percent from the previous week, but down 19 percent from the prior 4-week average. The destinations were to China (54,000 MT) and Mexico (9,600 MT).
Rice: Net sales of 6,500 MT for 2022/2023 primarily for Canada (3,900 MT), Mexico (1,600 MT), Belgium (500 MT), Saudi Arabia (200 MT), and Liberia (200 MT), were offset by reductions for Guatemala (200 MT). Exports of 17,200 MT were primarily to Guatemala (8,600 MT), Canada (3,200 MT), El Salvador (2,100 MT), Mexico (1,800 MT), and Belgium (500 MT).
Exports for Own Account: For 2022/2023, the current exports for own account outstanding balance is 100 MT, all Canada.
Soybeans: Net sales of 96,900 MT for 2021/2022 primarily for China (80,800 MT, including 70,000 MT switched from unknown destinations and decreases of 200 MT), the Netherlands (66,100 MT, including 66,000 MT switched from unknown destinations), South Korea (59,600 MT, including 62,000 MT switched from unknown destinations and decreases of 2,400 MT), Spain (58,300 MT, including 55,000 MT switched from unknown destinations), and Colombia (16,700 MT, including 12,000 MT switched from unknown destinations and decreases of 300 MT), were offset by reductions for unknown destinations (133,000 MT), Egypt (62,000 MT), and Mexico (9,900 MT). Net sales of 1,302,800 MT for 2022/2023 were primarily for China (779,000 MT), unknown destinations (273,000 MT), Mexico (165,300 MT), Egypt (60,000 MT), and Indonesia (14,500 MT), were offset by reductions for Japan (100 MT). Exports of 691,100 MT were down 23 percent from the previous week, but up 19 percent from the prior 4-week average. The destinations were primarily to China (285,000 MT), Mexico (126,200 MT), the Netherlands (66,100 MT), South Korea (60,700 MT), and Spain (58,300 MT).
Export for Own Account: For 2021/2022, the current exports for own account outstanding balance is 6,300 MT, all Canada.
Soybean Cake and Meal: Net sales of 66,600 MT for 2021/2022 were down 27 percent from the previous week and 36 percent from the prior 4-week average. Increases primarily for Mexico (29,600 MT, including decreases of 2,000 MT), Canada (19,600 MT), Morocco (16,000 MT), Guatemala (10,600 MT, including decreases of 400 MT), and Colombia (3,900 MT, including decreases of 4,000 MT), were offset by reductions primarily for Vietnam (8,300 MT), El Salvador (5,600 MT), Costa Rica (4,500 MT), and Honduras (3,400 MT). Net sales of 296,700 MT for 2022/2023 were primarily for Mexico (123,000 MT), the Philippines (88,000 MT), Canada (53,300 MT), Colombia (8,300 MT), and El Salvador (8,000 MT). Exports of 193,600 MT were down 5 percent from the previous week and 2 percent from the prior 4-week average. The destinations were primarily to Colombia (48,700 MT), Mexico (39,100 MT), Ecuador (38,000 MT), Morocco (30,000 MT), and Canada (20,700 MT).
Soybean Oil: Net sales of 1,600 MT for 2021/2022 were up noticeably from the previous week, but down 12 percent from the prior 4-week average. Increases reported for Guatemala (3,500 MT), were offset by reductions for Canada (1,900 MT). Exports of 1,200 MT were down 92 percent from the previous week and 82 percent from the prior 4-week average. The destinations were primarily to Mexico (700 MT) and Canada (400 MT).
Cotton: Net sales of 49,500 RB for 2022/2023 primarily for China (30,000 RB, including decreases of 5,500 RB), Turkey (14,600 RB, including decreases of 100 RB), Honduras (10,900 RB), Nicaragua (8,000 RB switched from Vietnam), and Indonesia (7,400 RB, including decreases of 400 RB), were offset by reductions primarily for Vietnam (32,100 RB), Pakistan (3,700 RB), and India (2,900 RB). Net sales of 10,600 RB for 2023/2024 were reported for Bangladesh (5,500 RB) and Mexico (5,100 RB). Exports of 267,400 RB were primarily to China (67,000 RB), Turkey (46,600 RB), Vietnam (30,400 RB), Bangladesh (20,900 RB), and India (20,800 RB). Net sales of Pima totaling 300 RB were reported for Turkey (200 RB) and Japan (100 RB). Exports of 1,700 RB were primarily to Indonesia (900 RB), India (500 RB), and South Korea (300 RB).
Optional Origin Sales: For 2022/2023, new optional origin sales of 500 RB were reported for Pakistan. The current outstanding balance of 11,100 RB is for Malaysia (9,300 RB) and Pakistan (1,800 RB).
Export for Own Account: For 2022/2023, new exports for own account totaling 1,300 RB were reported for Vietnam. Exports for own account totaling 3,600 RB primarily to China (2,200 RB) were applied to new or outstanding sales. The current exports for own account outstanding balance of 70,300 RB is for China (34,000 RB), Vietnam (23,500 RB), Turkey (10,600 RB), India (1,500 RB), Indonesia (400 RB), and Pakistan (300 RB).
Hides and Skins: Net sales of 455,500 pieces for 2022 were up 30 percent from the previous week and 18 percent from the prior 4-week average. Increases primarily for China (281,800 whole cattle hides, including decreases of 10,700 pieces), Thailand (107,000 whole cattle hides, including 34,200 pieces switched from Taiwan and decreases of 900 pieces), Indonesia (21,700 whole cattle hides), South Korea (18,300 whole cattle hides, including decreases of 600 pieces), and Mexico (17,500 whole cattle hides, including decreases of 9,600 pieces), were offset by reductions primarily for Taiwan (30,100 pieces). In addition, total net sales of 7,200 kip skins were for Belgium. Exports of 526,200 pieces were up 30 percent from the previous week and 23 percent from the prior 4-week average. Whole cattle hides exports were primarily to China (329,900 pieces), South Korea (82,600 pieces), Thailand (38,900 pieces), Mexico (34,600 pieces), and Indonesia (6,900 pieces). Total exports of 14,900 calf skins were to Italy. In addition, total exports of 1,400 kip skins were to Italy.
Net sales of 93,300 wet blues for 2022 were down 25 percent from the previous week, but up 2 percent from the prior 4-week average. Increases reported for Italy (54,500 unsplit, including decreases of 200 unsplit), Vietnam (15,600 unsplit), China (11,600 unsplit), Thailand (7,700 unsplit, including decreases of 800 unsplit), and Mexico (4,200 unsplit), were offset by reductions for Portugal (300 grain splits). Exports of 103,000 wet blues were down 29 percent from the previous week and 36 percent from the prior 4-week average. The destinations were primarily to Italy (34,400 unsplit and 4,400 grain splits), Thailand (18,700 unsplit), Vietnam (17,200 unsplit), China (14,500 unsplit), and Brazil (5,200 unsplit). Net sales of 160,000 splits were up 41 percent from the previous week, but down 60 percent from the prior 4-week average. Increases were reported for Taiwan (85,000 pounds), South Korea (64,000 pounds), Vietnam (10,500 pounds), and China (900 pounds). Exports of 499,300 pounds were down 8 percent from the previous week, but up 6 percent from the prior 4-week average. The destinations were to South Korea (164,400 pounds), China (129,900 pounds), Vietnam (120,000 pounds), and Taiwan (84,900 pounds).
Beef: Net sales of 18,900 MT for 2022 were up 29 percent from the previous week and unchanged from the prior 4-week average. Increases primarily for China (7,400 MT, including decreases of 100 MT), Japan (5,300 MT, including decreases of 200 MT), South Korea (1,900 MT, including decreases of 400 MT), Mexico (1,300 MT, including decreases of 200 MT), and Indonesia (900 MT), were offset by reductions for Chile (100 MT). Total net sales of 100 MT for 2023 were for Japan. Exports of 19,000 MT were down 9 percent from the previous week and 4 percent from the prior 4-week average. The destinations were primarily to South Korea (5,600 MT), Japan (4,700 MT), China (3,800 MT), Taiwan (1,100 MT), and Mexico (1,100 MT).
Pork: Net sales of 13,600 MT for 2022 were down 37 percent from the previous week and 43 percent from the prior 4-week average. Increases primarily for Mexico (7,100 MT, including decreases of 300 MT), Japan (2,600 MT, including decreases of 300 MT), South Korea (900 MT, including decreases of 600 MT), Colombia (700 MT, including decreases of 300 MT), and Canada (600 MT, including decreases of 400 MT), were offset by reductions for Honduras (200 MT), Guatemala (100 MT), and Indonesia (100 MT). Exports of 25,600 MT were down 6 percent from the previous week and 4 percent from the prior 4-week average. The destinations were primarily to Mexico (11,600 MT), China (5,000 MT), Japan (3,400 MT), South Korea (1,700 MT), and Canada (1,500 MT).
U.S. EXPORT SALES FOR WEEK ENDING 8/11/2022
|
|
CURRENT MARKETING YEAR |
NEXT MARKETING YEAR |
||||||
|
COMMODITY |
NET SALES |
OUTSTANDING SALES |
WEEKLY EXPORTS |
ACCUMULATED EXPORTS |
NET SALES |
OUTSTANDING SALES |
||
|
CURRENT YEAR |
YEAR AGO |
CURRENT YEAR |
YEAR AGO |
|||||
|
|
THOUSAND METRIC TONS |
|||||||
|
WHEAT |
|
|
|
|
|
|
|
|
|
HRW |
46.4 |
1,471.3 |
1,630.7 |
93.1 |
1,162.8 |
1,530.5 |
0.0 |
0.0 |
|
SRW |
46.8 |
865.7 |
889.4 |
85.9 |
745.1 |
705.8 |
0.0 |
30.0 |
|
HRS |
71.7 |
1,489.2 |
1,271.0 |
89.7 |
1,011.0 |
1,291.0 |
0.0 |
0.0 |
|
WHITE |
42.3 |
1,419.6 |
877.0 |
80.9 |
521.0 |
766.0 |
0.0 |
0.0 |
|
DURUM |
0.0 |
109.4 |
8.4 |
0.0 |
18.0 |
42.2 |
0.0 |
0.0 |
|
TOTAL |
207.2 |
5,355.2 |
4,676.5 |
349.6 |
3,457.9 |
4,335.5 |
0.0 |
30.0 |
|
BARLEY |
0.0 |
11.7 |
22.0 |
0.0 |
3.8 |
2.9 |
0.0 |
0.0 |
|
CORN |
99.3 |
3,208.6 |
4,905.6 |
623.0 |
57,740.9 |
65,412.0 |
750.0 |
8,798.3 |
|
SORGHUM |
11.5 |
96.7 |
368.9 |
63.6 |
6,879.7 |
6,712.6 |
0.2 |
203.2 |
|
SOYBEANS |
96.9 |
4,076.2 |
2,381.4 |
691.1 |
55,482.0 |
59,703.3 |
1,302.8 |
17,045.8 |
|
SOY MEAL |
66.6 |
1,409.5 |
1,585.4 |
193.6 |
10,345.3 |
10,415.1 |
296.7 |
1,427.1 |
|
SOY OIL |
1.6 |
47.4 |
17.5 |
1.2 |
647.9 |
666.0 |
0.0 |
0.6 |
|
RICE |
|
|
|
|
|
|
|
|
|
L G RGH |
-0.2 |
59.8 |
222.3 |
10.6 |
10.6 |
36.1 |
0.0 |
0.0 |
|
M S RGH |
0.0 |
16.6 |
9.0 |
0.0 |
0.0 |
0.2 |
0.0 |
0.0 |
|
L G BRN |
0.1 |
5.8 |
2.2 |
0.2 |
0.3 |
10.5 |
0.0 |
0.0 |
|
M&S BR |
0.2 |
6.9 |
0.1 |
0.2 |
0.3 |
0.2 |
0.0 |
0.0 |
|
L G MLD |
2.3 |
127.0 |
176.2 |
2.3 |
2.7 |
26.9 |
0.0 |
0.0 |
|
M S MLD |
4.1 |
79.7 |
59.2 |
3.7 |
4.9 |
22.9 |
0.0 |
0.0 |
|
TOTAL |
6.5 |
295.7 |
469.0 |
17.2 |
18.9 |
96.7 |
0.0 |
0.0 |
|
COTTON |
|
THOUSAND RUNNING BALES |
||||||
|
UPLAND |
49.5 |
6,919.1 |
4,807.1 |
267.4 |
448.6 |
411.7 |
10.6 |
720.9 |
|
PIMA |
0.3 |
93.1 |
112.9 |
1.7 |
6.5 |
11.4 |
0.0 |
0.0 |
Terry Reilly
Senior Commodity Analyst – Grain and Oilseeds
Futures International
One Lincoln Center
18 W 140 Butterfield Rd.
Oakbrook Terrace, Il. 60181
W: 312.604.1366
ICE IM: treilly1
Skype: fi.treilly

Trading of futures, options, swaps and other derivatives is risky and is not suitable for all persons. All of these investment products are leveraged, and you can lose more than your initial deposit. Each investment product is offered only to and from jurisdictions where solicitation and sale are lawful, and in accordance with applicable laws and regulations in such jurisdiction. The information provided here should not be relied upon as a substitute for independent research before making your investment decisions. Futures International, LLC is merely providing this information for your general information and the information does not take into account any particular individual’s investment objectives, financial situation, or needs. All investors should obtain advice based on their unique situation before making any investment decision. The contents of this communication and any attachments are for informational purposes only and under no circumstances should they be construed as an offer to buy or sell, or a solicitation to buy or sell any future, option, swap or other derivative. The sources for the information and any opinions in this communication are believed to be reliable, but Futures International, LLC does not warrant or guarantee the accuracy of such information or opinions. Futures International, LLC and its principals and employees may take positions different from any positions described in this communication. Past results are not necessarily indicative of future results.