PDF attached
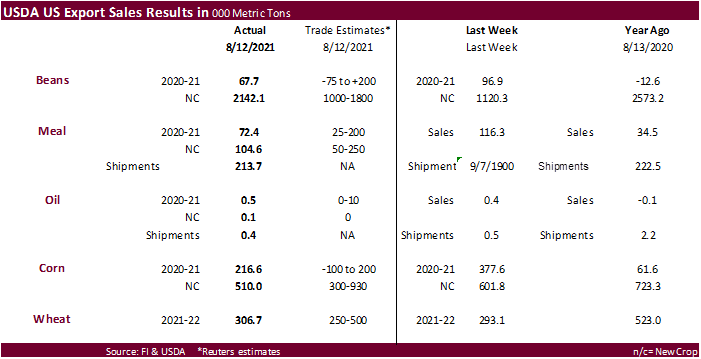
Soybeans new-crop sales of 2.142 million tons were above the top end of a range of expectations and viewed friendly for new-crop futures. New-crop soybeans included China (1,030,000 MT) and unknown destinations (841,000). Soybean meal sales were within expectations and shipments of 213,700 tons were good for this time of year. Soybean oil sales continue to struggle at less than 1,000 tons for combined old and new-crop. Corn sales for old crop were 216,600 tons, with only a couple weeks left in the crop year, and new-crop was 510,000 tons, down from 601,800 tons previous week. Mexico dominated the corn sales. All-wheat sales were 306,700 tons (China 197,400 MT, including 195,000 MT switched from unknown destinations), above 293,100 tons previous week.
U.S. EXPORT SALES FOR WEEK ENDING 8/12/21
|
|
CURRENT MARKETING YEAR |
NEXT MARKETING YEAR |
||||||
|
COMMODITY |
NET SALES |
OUTSTANDING SALES |
WEEKLY EXPORTS |
ACCUMULATED EXPORTS |
NET SALES |
OUTSTANDING SALES |
||
|
CURRENT YEAR |
YEAR |
CURRENT YEAR |
YEAR |
|||||
|
|
THOUSAND METRIC TONS |
|||||||
|
WHEAT |
|
|
|
|
|
|
|
|
|
HRW |
132.6 |
1,630.7 |
1,642.5 |
127.1 |
1,530.5 |
2,367.0 |
0.0 |
0.0 |
|
SRW |
42.1 |
889.4 |
691.1 |
156.5 |
705.8 |
384.9 |
0.0 |
0.0 |
|
HRS |
61.3 |
1,271.0 |
1,877.6 |
233.2 |
1,291.0 |
1,430.0 |
0.0 |
0.0 |
|
WHITE |
70.7 |
877.0 |
1,244.8 |
75.1 |
766.0 |
912.0 |
0.0 |
0.0 |
|
DURUM |
0.0 |
8.4 |
254.9 |
0.0 |
42.2 |
209.3 |
0.0 |
0.0 |
|
TOTAL |
306.7 |
4,676.5 |
5,710.9 |
591.8 |
4,335.5 |
5,303.2 |
0.0 |
0.0 |
|
BARLEY |
-0.1 |
22.0 |
31.1 |
0.6 |
2.9 |
8.2 |
0.0 |
0.0 |
|
CORN |
216.5 |
4,905.6 |
3,002.5 |
829.2 |
65,412.0 |
41,218.9 |
510.0 |
18,598.7 |
|
SORGHUM |
-108.2 |
368.9 |
289.1 |
50.5 |
6,712.6 |
4,340.0 |
0.0 |
1,594.9 |
|
SOYBEANS |
67.7 |
2,381.4 |
5,534.2 |
258.0 |
59,703.3 |
41,758.9 |
2,142.1 |
13,864.9 |
|
SOY MEAL |
72.4 |
1,585.4 |
1,464.0 |
213.7 |
10,415.6 |
10,528.0 |
104.6 |
1,522.0 |
|
SOY OIL |
0.5 |
17.5 |
175.3 |
0.4 |
666.0 |
1,091.4 |
0.1 |
0.7 |
|
RICE |
|
|
|
|
|
|
|
|
|
L G RGH |
54.5 |
222.3 |
144.8 |
36.1 |
36.1 |
26.7 |
0.0 |
0.0 |
|
M S RGH |
0.0 |
9.0 |
28.1 |
0.2 |
0.2 |
0.8 |
0.0 |
0.0 |
|
L G BRN |
0.5 |
2.2 |
9.0 |
10.2 |
10.5 |
1.5 |
0.0 |
0.0 |
|
M&S BR |
0.2 |
0.1 |
30.1 |
0.2 |
0.2 |
1.7 |
0.0 |
0.0 |
|
L G MLD |
-13.8 |
176.2 |
54.8 |
25.4 |
26.9 |
6.0 |
0.0 |
0.0 |
|
M S MLD |
1.9 |
59.2 |
54.4 |
20.1 |
22.9 |
19.1 |
-2.1 |
0.0 |
|
TOTAL |
43.3 |
469.0 |
321.2 |
92.1 |
96.7 |
55.8 |
-2.1 |
0.0 |
|
COTTON |
|
THOUSAND RUNNING BALES |
||||||
|
UPLAND |
242.4 |
4,807.1 |
5,995.0 |
221.1 |
411.7 |
700.1 |
59.5 |
575.6 |
|
PIMA |
10.6 |
112.9 |
181.2 |
3.7 |
11.4 |
14.1 |
0.0 |
0.0 |
This summary is based on reports from exporters for the period August 6-12, 2021.
Wheat: Net sales of 306,700 metric tons (MT) for 2021/2022 were up 5 percent from the previous week, but down 23 percent from the prior 4-week average. Increases primarily for China (197,400 MT, including 195,000 MT switched from unknown destinations), South Korea (76,600 MT), Taiwan (48,600 MT), Vietnam (33,500 MT, including 30,600 MT switched from unknown destinations), and the Philippines (33,400 MT, including decreases of 5,500 MT), were offset by reductions primarily for unknown destinations (217,000 MT). Exports of 591,800 MT were down 6 percent from the previous week, but up 29 percent from the prior 4-week average. The destinations were primarily to Japan (124,800 MT), the Philippians (122,200 MT), Nigeria (79,200 MT), China (69,500 MT), and Mexico (46,900 MT).
Corn: Net sales of 216,500 MT for 2020/2021 were down 43 percent from the previous week, but up noticeably from the prior 4-week average. Increases reported for Mexico (190,100 MT, including decreases of 22,900 MT), Canada (62,300 MT), El Salvador (24,000 MT, including 23,000 MT switched from Guatemala and decreases of 200 MT), Honduras (5,800 MT, including decreases of 4,500 MT), and China (2,900 MT), were offset by reductions for unknown destinations (32,700 MT), Guatemala (20,300 MT), and Japan (15,600 MT). For 2021/2022, net sales of 510,000 MT primarily for Mexico (307,500 MT), Colombia (88,800 MT), Japan (50,000 MT), unknown destinations (50,000 MT), and Honduras (5,500 MT), were offset by reductions for Guatemala (3,900 MT). Exports of 829,200 MT were down 22 percent from the previous week and 31 percent from the prior 4-week average. The destinations were primarily to Mexico (292,400 MT), China (274,900 MT), Japan (149,400 MT), Guatemala (54,600 MT), and El Salvador (26,400 MT).
Optional Origin Sales: For 2020/2021, the current outstanding balance of 30,500 MT is for unknown destinations. For 2021/2022, the current outstanding balance of 50,000 MT is for unknown destinations.
Barley: Total net sales reductions for 2021/2022 of 100 MT were for Canada. Exports of 600 MT were unchanged from the previous week, but up noticeably from the prior 4-week average. The destinations were to Japan (500 MT) and South Korea (100 MT).
Sorghum: Net sales reductions of 108,200 MT for 2020/2021 resulting increases for Mexico (6,500 MT), were more than offset by reductions for unknown destinations (110,000 MT) and China (4,700 MT). Exports of 50,500 MT were down 30 percent from the previous week and 20 percent from the prior 4-week average. The destination was primarily to China (50,400 MT).
Rice: Net sales of 43,300 MT for 2021/2022 primarily for Mexico (21,800 MT, including decreases of 600 MT), Costa Rica (18,400 MT), Guatemala (15,400 MT), the United Kingdom (5,100 MT), and Saudi Arabia (2,700 MT), were offset by reductions primarily for Haiti (22,400 MT). Total net sales reductions for 2022/2023, of 2,100 MT were for Japan. Exports of 92,100 MT were primarily to Haiti (22,600 MT), Mexico (19,900 MT), Japan (15,800 MT), the United Kingdom (10,100 MT), and Guatemala (9,500 MT).
Exports for Own Account: For 2021/2022, new exports for own account totaling 100 MT were to Canada. The current exports for own account outstanding balance is 100 MT, all Canada.
Soybeans: Net sales of 67,700 MT for 2020/2021 were down 30 percent from the previous week, but up noticeably from the prior 4-week average. Increases primarily for China (92,300 MT, including 68,000 MT switched from unknown destinations), Taiwan (12,300 MT, including decreases of 300 MT), Japan (11,200 MT, including 9,000 MT switched from unknown destinations and decreases of 300 MT), Vietnam (11,200 MT), and Indonesia (7,600 MT, including decreases of 200 MT), were offset by reductions for unknown destinations (76,800 MT). For 2021/2022, net sales of 2,142,100 MT were primarily for China (1,030,000 MT), unknown destinations (841,000), Egypt (184,000 MT), Mexico (28,900 MT), and Taiwan (25,000 MT). Exports of 258,000 MT were up 99 percent from the previous week and 37 percent from the prior 4-week average. The destinations were primarily to China (144,200 MT), Japan (59,500 MT), Indonesia (15,600 MT), Colombia (14,800 MT), and Mexico (11,600 MT).
Exports for Own Account: For 2020/2021, the current exports for own account outstanding balance is 5,800 MT, all Canada.
Soybean Cake and Meal: Net sales of 72,400 MT for 2020/2021 were down 38 percent from the previous week and 29 percent from the prior 4-week average. Increases primarily for Japan (37,000 MT, including 3,000 MT switched from unknown destinations), Mexico (12,900 MT, including decreases of 1,100 MT), Canada (10,200 MT, including decreases of 200 MT), El Salvador (9,000 MT, including 9,600 MT switched from Guatemala and decreases of 600 MT), and Honduras (8,000 MT, including 6,000 MT switched from Nicaragua), were offset by reductions for Guatemala (10,300 MT), Nicaragua (6,000 MT), unknown destinations (3,000 MT), and Belgium (2,200 MT). For 2021/2022, net sales of 104,600 MT primarily for the Philippines (90,000 MT), Canada (6,500 MT), Mexico (4,600 MT), and Nicaragua (2,200 MT), were offset by reductions for Guatemala (1,900 MT). Exports of 213,700 MT were down 15 percent from the previous week, but up 3 percent from the prior 4-week average. The destinations were primarily to Mexico (38,600 MT), Japan (38,100 MT), Colombia (31,500 MT), Guatemala (22,200 MT), and Honduras (22,000 MT).
Soybean Oil: Net sales of 500 MT for 2020/2021 were up 54 percent from the previous week, but down 67 percent from the prior 4-week average. Increases were reported for Canada (300 MT, including decreases of 100 MT) and Honduras (200 MT). Total net sales for 2021/2022 of 100 MT were for Honduras. Exports of 400 MT were down 14 percent from the previous week and 79 percent from the prior 4-week average. The destinations were to Canada (300 MT) and Mexico (100 MT).
Cotton: Net sales of 242,400 RB for 2021/2022 primarily for China (161,900 RB, including 3,400 RB switched from Singapore, 600 RB switched from Hong Kong, and decreases of 11,100 RB), Turkey (46,100 RB, including decreases of 2,800 RB), Pakistan (16,400 RB, including decreases of 700 RB), Vietnam (12,400 RB, including 4,000 RB switched from China, 1,000 RB from Japan, and decreases of 1,400 RB), and Peru (4,900 RB), were offset by reductions primarily for Singapore (3,400 RB) and Japan (1,400 RB). Total net sales of 59,500 RB for 2022/2023, were for Pakistan. Exports of 221,100 RB were primarily to Pakistan (49,600 RB), Vietnam (38,000 RB), Turkey (31,700 RB), China (22,100 RB), and Bangladesh (17,600 RB). Net sales of Pima totaling 10,600 RB primarily for China (3,800 RB, including 300 RB switched from Germany), India (2,600 RB, including decreases of 600 RB), Pakistan (2,200 RB), the United Arab Emirates (900 RB), and Turkey (500 RB), were offset by reductions for Germany (300 RB). Exports of 3,700 RB were to India (1,400 RB), China (1,100 RB), Peru (800 RB), and Pakistan (400 RB).
Exports for Own Account: For 2021/2022, new exports for own account totaling 100 RB were to Vietnam. The current exports for own account outstanding balance of 4,800 RB is for China (4,700 RB) and Vietnam (100 RB).
Hides and Skins: Net sales of 190,400 pieces for 2021 were down 42 percent from the previous week and 43 percent from the prior 4-week average. Increases primarily for China (101,600 whole cattle hides, including decreases of 25,000 pieces), Thailand (67,200 whole cattle hides, including 16,400 whole cattle hides switched from Taiwan and decreases of 700 pieces), Mexico (15,500 whole cattle hides, including decreases of 600 pieces), South Korea (8,200 whole cattle hides, including decreases of 1,100 pieces), and Canada (1,000 whole cattle hides, including decreases of 1,000 pieces), were offset by reductions primarily to Taiwan (3,500 whole cattle hides). Exports of 357,200 pieces were down 14 percent from the previous week and from the prior 4-week average. Whole cattle hides exports were primarily to China (249,000 pieces), South Korea (48,900 pieces), Thailand (23,300 pieces), Mexico (11,300 pieces), and Taiwan (10,000 pieces).
Net sales of 113,000 wet blues for 2021 were down 17 percent from the previous week and 12 percent from the prior 4-week average. Increases primarily for China (29,900 unsplit), Taiwan (28,100 unsplit, including decreases of 200 unsplit), Vietnam (23,900 unsplit), Mexico (23,400 grain splits), and Thailand (8,000 unsplit, including decreases of 400 unsplit), were offset by reductions for Italy (200 unsplit and 100 grain splits). Exports of 148,000 wet blues were down 9 percent from the previous week, but up 3 percent from the prior 4-week average. The destinations were to Italy (40,300 unsplit and 10,400 grain splits), China (30,100 unsplit), Vietnam (20,400 unsplit), Taiwan (19,200 unsplit), and Mexico (9,400 unsplit and 8,400 grain splits). Net sales of 336,900 splits were reported for China (252,900 pounds, including decreases of 700 pounds) and Taiwan (84,000 pounds). Exports of 202,600 pounds were to Vietnam (160,000 pounds) and China (42,600 pounds).
Beef: Net sales of 11,100 MT reported for 2021 were down 18 percent from the previous week and 42 percent from the prior 4-week average. Increases primarily for Japan (2,800 MT, including decreases of 400 MT), South Korea (2,800 MT, including decreases of 400 MT), China (1,800 MT, including decreases of 300 MT), Taiwan (900 MT, including decreases of 100 MT), and Mexico (600 MT, including decreases of 100 MT), were offset by reductions for Colombia (100 MT). Exports of 19,700 MT were up 6 percent from the previous week, but down 1 percent from the prior 4-week average. The destinations were primarily to South Korea (5,600 MT), Japan (4,700 MT), China (4,200 MT), Mexico (1,200 MT), and Taiwan (1,100 MT).
Pork: Net sales of 20,000 MT reported for 2021 were up 37 percent from the previous week, but down 31 percent from the prior 4-week average. Increases primarily for Mexico (6,900 MT, including decreases of 700 MT), Japan (3,100 MT, including decreases of 300 MT), Colombia (3,000 MT, including decreases of 200 MT), Canada (2,300 MT, including decreases of 700 MT), and South Korea (1,500 MT, including decreases of 100 MT), were offset by reductions for Australia (200 MT). Exports of 28,700 MT were up 4 percent from the previous week, but down 2 percent from the prior 4-week average. The destinations were primarily to Mexico (13,500 MT), China (4,500 MT), Japan (4,300 MT), Canada (1,600 MT), and Colombia (1,400 MT).
August 19, 2021 1 FOREIGN AGRICULTURAL SERVICE/USDA
Terry Reilly
Senior Commodity Analyst – Grain and Oilseeds
Futures International
One Lincoln Center
18 W 140 Butterfield Rd.
Oakbrook Terrace, Il. 60181
W: 312.604.1366
ICE IM: treilly1
Skype: fi.treilly

Trading of futures, options, swaps and other derivatives is risky and is not suitable for all persons. All of these investment products are leveraged, and you can lose more than your initial deposit. Each investment product is offered only to and from jurisdictions where solicitation and sale are lawful, and in accordance with applicable laws and regulations in such jurisdiction. The information provided here should not be relied upon as a substitute for independent research before making your investment decisions. Futures International, LLC is merely providing this information for your general information and the information does not take into account any particular individual’s investment objectives, financial situation, or needs. All investors should obtain advice based on their unique situation before making any investment decision. The contents of this communication and any attachments are for informational purposes only and under no circumstances should they be construed as an offer to buy or sell, or a solicitation to buy or sell any future, option, swap or other derivative. The sources for the information and any opinions in this communication are believed to be reliable, but Futures International, LLC does not warrant or guarantee the accuracy of such information or opinions. Futures International, LLC and its principals and employees may take positions different from any positions described in this communication. Past results are not necessarily indicative of future results.