PDF attached
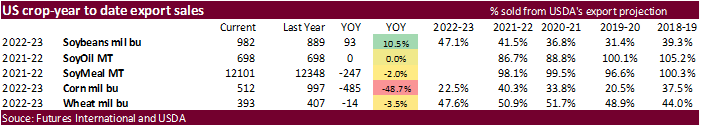
USDA export sales were poor for the soybean complex and (meal shipments and new crop sales were within expectations), ok for corn and within expectations for wheat. Crop year corn sales are running nearly 50 percent below this time year ago. Soybean crop year commitments are about 10 percent above last year’s level. There were 53,200 tons of sorghum sales for unknown destinations. Pork sales were 34,300 tons of pork sales, most of it for Mexico.
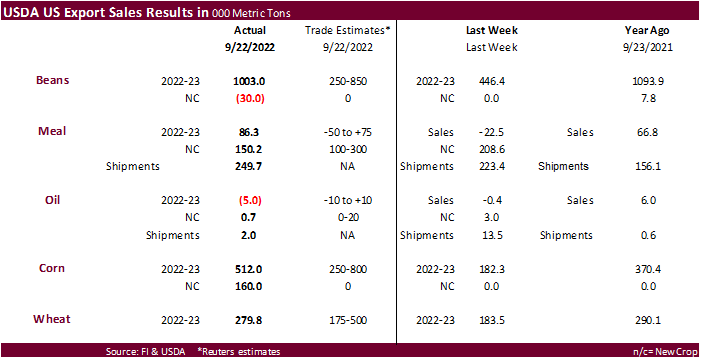
This summary is based on reports from exporters for the period September 16-22, 2022.
Wheat: Net sales of 279,800 metric tons (MT) for 2022/2023 primarily for Guatemala (115,400 MT, including 51,500 MT switched from unknown destinations), Thailand (47,500 MT), Mexico (45,500 MT, including decreases of 13,000 MT), Italy (31,800 MT), and Brazil (30,000 MT), were offset by reductions for unknown destinations (66,300 MT), Malaysia (700 MT), and Costa Rica (400 MT). Net sales reductions of 29,700 MT for 2023/2024 resulting in increases for South Korea (300 MT), were more than offset by reductions for Brazil (30,000 MT). Exports of 620,700 MT were primarily to China (137,400 MT), Chile (71,100 MT), Nigeria (69,700 MT), Mexico (50,000 MT), and Japan (48,200 MT).
Corn: Net sales of 512,000 MT for 2022/2023 primarily for Mexico (321,700 MT, including decreases of 1,800 MT), unknown destinations (57,000 MT), Honduras (51,900 MT), Japan (51,100 MT, including 50,600 MT switched from unknown destinations and decreases of 300 MT), and Panama (44,200 MT), were offset by reductions for Egypt (65,000 MT), Guatemala (7,500 MT), and Costa Rica (3,200 MT). Total net sales of 160,000 MT for 2023/2024 were for Mexico. Exports of 574,700 MT were primarily to Mexico (239,200 MT), China (141,200 MT), Japan (135,000 MT), El Salvador (19,400 MT), and Venezuela (15,300 MT).
Barley: No net sales or exports were reported for the week.
Sorghum: Net sales of 53,200 MT for 2022/2023 were for unknown destinations (53,000 MT) and Japan (200 MT). Exports of 4,300 MT were to Mexico (4,100 MT), Japan (100 MT), and China (100 MT).
Rice: Net sales of 7,900 MT for 2022/2023 were primarily for Guatemala (4,000 MT), Canada (2,200 MT), Honduras (1,000 MT), Mexico (300 MT), and the Dominican Republic (100 MT). Exports of 47,900 MT were primarily to Honduras (16,500 MT), Japan (12,400 MT), Guatemala (10,700 MT), Canada (2,000 MT), and El Salvador (2,000 MT).
Soybeans: Net sales of 1,003,000 MT for 2022/2023 primarily for China (548,700 MT, including 132,000 MT switched from unknown destinations and decreases of 32,000 MT), Mexico (217,000 MT, including 47,500 MT switched from unknown destinations and decreases of 34,700 MT), Japan (81,600 MT, including 50,400 MT switched from unknown destinations and decreases of 1,900 MT), Egypt (78,000 MT, including decreases of 30,000 MT), and Tunisia (30,000 MT), were offset by reductions for unknown destinations (23,700 MT) and Cuba (4,000 MT). Total net sales reductions of 30,000 MT for 2023/2024 were for Tunisia. Exports of 269,200 MT were primarily to Japan (85,800 MT), China (78,700 MT), Mexico (61,100 MT), Taiwan (20,600 MT), and Costa Rica (7,900 MT).
Optional Origin: For 2022/2023, the current optional origin outstanding balance is 300 MT, all South Korea.
Export for Own Account: For 2022/2023, the current exports for own account outstanding balance is 6,300 MT, all Canada.
Soybean Cake and Meal: Net sales of 86,300 MT for 2021/2022 primarily for Vietnam (48,300 MT), Ireland (30,000 MT), Colombia (6,900 MT, including decreases of 13,400 MT), Kuwait (6,000 MT), and Canada (6,000 MT, including decreases of 200 MT), were offset by reductions primarily for Costa Rica (7,200 MT), unknown destinations (7,100 MT), Guatemala (2,600 MT), Belgium (1,900 MT), and Japan (600 MT). Net sales of 150,200 MT for 2022/2023 primarily for the Philippines (90,000 MT), Mexico (26,300 MT), Panama (26,300 MT), Honduras (23,400 MT), and Canada (12,700 MT), were offset by reductions for Ireland (30,000 MT) and Colombia (4,100 MT). Exports of 249,700 MT were primarily to Colombia (73,300 MT), Vietnam (42,600 MT), Honduras (27,500 MT), Canada (23,000 MT), and the Philippines (21,900 MT).
Soybean Oil: Net sales of reductions of 5,000 MT for 2021/2022 resulting in increases for Canada (1,400 MT), were more than offset by reductions for unknown destinations (6,500 MT). Total net sales of 700 MT for 2022/2023 were for Canada. Exports of 2,000 MT were to Canada (1,900 MT) and Mexico (100 MT).
Cotton: Net sales of 30,200 RB for 2022/2023 primarily for Pakistan (32,400 RB), Nicaragua (8,800 RB), Taiwan (5,300 RB), Vietnam (1,600 RB), and Peru (1,300 RB), were offset by reductions primarily for Turkey (12,600 RB), El Salvador (5,000 RB), and Indonesia (2,500 RB). Net sales of 41,500 RB for 2023/2024 reported for Pakistan (20,000 RB), Thailand (16,100 RB), Turkey (8,800 RB), Mexico (1,600 RB), and Japan (500 RB), were offset by reductions for Bangladesh (5,500 RB). Exports of 187,900 RB were primarily to China (46,800 RB), Vietnam (29,600 RB), Turkey (27,300 RB), Pakistan (21,000 RB), and Bangladesh (17,000 RB). Net sales of Pima totaling 1,200 RB were primarily for Taiwan (400 RB) and Japan (400 RB). Total net sales of 300 RB for 2023/2024 were for Italy. Exports of 1,000 RB were primarily to Vietnam (700 RB) and South Korea (200 RB).
Optional Origin Sales: For 2022/2023, the current outstanding balance of 10,300 RB is for Malaysia (9,300 RB) and Pakistan (1,000 RB).
Export for Own Account: For 2022/2023, current exports for own account outstanding balance of 77,400 RB is for China (40,500 RB), Vietnam (23,900 RB), Turkey (10,600 RB), India (1,500 RB), Pakistan (500 RB), and Indonesia (400 RB).
Hides and Skins: Net sales of 337,400 pieces for 2022 primarily for China (250,800 whole cattle hides, including decreases of 20,500 pieces), South Korea (30,800 whole cattle hides, including decreases of 2,000 pieces), Thailand (24,100 whole cattle hides, including decreases of 1,900 pieces), Mexico (11,600 whole cattle hides, including decreases of 600 pieces), and Indonesia (4,200 whole cattle hides, including decreases of 600 pieces), were offset by reductions primarily for Canada (5,900 pieces). Total net sales reductions of 1,200 calf skins were for Italy, including decreases of 2,200 calf skins. In addition, net sales of 11,700 kip skins were primarily for Canada (5,600 kip skins, including decreases of 300 kip skins) and China (4,000 kip skins). Exports of 442,200 whole cattle hides exports were primarily to China (288,100 pieces), South Korea (41,300 pieces), Mexico (31,400 pieces), Thailand (26,600 pieces), and Brazil (15,000 pieces). In addition, exports of 4,500 kip skins were primarily to Canada (2,700 kip skins).
Net sales of 130,400 wet blues for 2022 primarily for Thailand (39,100 unsplit), Vietnam (35,600 unsplit, including decreases of 100 unsplit), China (33,800 unsplit, including decreases of 100 unsplit), Taiwan (8,200 unsplit), and Switzerland (8,000 unsplit), were offset by reductions for Italy (100 grain splits) and Hong Kong (100 unsplit). Total net sales of 1,300 unsplit for 2023 were for Italy. Exports of 177,700 wet blues were primarily to Vietnam (50,600 unsplit), Italy (34,800 unsplit and 8,800 grain), China (37,900 unsplit), Thailand (21,200 unsplit), and Taiwan (9,700 unsplit). Net sales of 18,800 splits reported for China (10,500 pounds) and Vietnam (10,100 pounds, including decreases of 900 pounds), were offset by reductions for South Korea (1,800 pounds). Exports of 395,800 pounds were to Vietnam (221,300 pounds) and China (174,500 pounds).
Beef: Net sales of 21,500 MT for 2022 were primarily for South Korea (7,300 MT, including decreases of 400 MT), China (6,000 MT, including decreases of 100 MT), Japan (3,500 MT, including decreases of 900 MT), Canada (1,200 MT, including decreases of 100 MT), and Mexico (1,100 MT). Net sales of 600 MT for 2023 were primarily for Japan (500 MT). Exports of 18,300 MT were primarily to Japan (5,100 MT), China (4,200 MT), South Korea (4,000 MT), Mexico (1,400 MT), and Canada (800 MT).
Pork: Net sales of 34,300 MT for 2022 were primarily for Mexico (23,700 MT, including decreases of 200 MT), South Korea (2,900 MT, including decreases of 800 MT), China (2,000 MT, including decreases of 200 MT), Japan (1,800 MT, including decreases of 200 MT), and Canada (1,400 MT, including decreases of 400 MT). Total net sales of 100 MT for 2023 were for Mexico. Exports of 27,200 MT were primarily to Mexico (13,000 MT), China (4,400 MT), Japan (2,800 MT), South Korea (2,000 MT), and Canada (1,600
U.S. EXPORT SALES FOR WEEK ENDING 09/22/2022
|
|
CURRENT MARKETING YEAR |
NEXT MARKETING YEAR |
||||||
|
COMMODITY |
NET SALES |
OUTSTANDING SALES |
WEEKLY EXPORTS |
ACCUMULATED EXPORTS |
NET SALES |
OUTSTANDING SALES |
||
|
CURRENT YEAR |
YEAR AGO |
CURRENT YEAR |
YEAR AGO |
|||||
|
|
THOUSAND METRIC TONS |
|||||||
|
WHEAT |
|
|
|
|
|
|
|
|
|
HRW |
18.1 |
869.2 |
1,567.8 |
205.3 |
2,140.7 |
2,691.4 |
0.0 |
1.7 |
|
SRW |
176.8 |
591.4 |
666.7 |
76.1 |
1,443.2 |
1,048.5 |
-30.0 |
0.0 |
|
HRS |
40.1 |
1,096.3 |
988.5 |
171.3 |
1,993.6 |
1,988.9 |
0.0 |
0.0 |
|
WHITE |
26.3 |
907.8 |
582.0 |
128.3 |
1,476.0 |
1,419.0 |
0.3 |
0.3 |
|
DURUM |
18.5 |
93.7 |
60.5 |
39.8 |
73.9 |
61.4 |
0.0 |
0.0 |
|
TOTAL |
279.8 |
3,558.5 |
3,865.5 |
620.7 |
7,127.3 |
7,209.2 |
-29.7 |
2.0 |
|
BARLEY |
0.0 |
11.6 |
25.5 |
0.0 |
3.9 |
4.7 |
0.0 |
0.0 |
|
CORN |
512.0 |
11,394.3 |
23,794.1 |
574.7 |
1,601.3 |
1,522.0 |
160.0 |
250.5 |
|
SORGHUM |
53.2 |
276.3 |
2,235.7 |
4.3 |
16.6 |
115.6 |
0.0 |
0.0 |
|
SOYBEANS |
1,003.0 |
25,516.1 |
23,224.8 |
269.2 |
1,214.3 |
975.1 |
-30.0 |
0.0 |
|
SOY MEAL |
86.3 |
598.5 |
1,001.3 |
249.7 |
11,502.3 |
11,346.5 |
150.2 |
2,176.3 |
|
SOY OIL |
-5.0 |
21.9 |
22.4 |
2.0 |
675.9 |
675.2 |
0.7 |
6.5 |
|
RICE |
|
|
|
|
|
|
|
|
|
L G RGH |
5.0 |
52.5 |
185.5 |
29.2 |
72.2 |
175.1 |
0.0 |
0.0 |
|
M S RGH |
0.0 |
15.0 |
8.0 |
0.1 |
1.6 |
1.2 |
0.0 |
0.0 |
|
L G BRN |
0.1 |
2.7 |
4.4 |
0.3 |
2.3 |
13.4 |
0.0 |
0.0 |
|
M&S BR |
0.0 |
5.7 |
54.3 |
0.6 |
1.7 |
13.9 |
0.0 |
0.0 |
|
L G MLD |
0.5 |
137.1 |
139.7 |
2.7 |
83.5 |
133.5 |
0.0 |
0.0 |
|
M S MLD |
2.3 |
23.8 |
68.4 |
15.0 |
63.1 |
66.6 |
0.0 |
0.0 |
|
TOTAL |
7.9 |
236.7 |
460.3 |
47.9 |
224.5 |
403.7 |
0.0 |
0.0 |
|
COTTON |
|
THOUSAND RUNNING BALES |
||||||
|
UPLAND |
30.2 |
6,193.5 |
5,708.3 |
187.9 |
1,825.9 |
1,515.5 |
41.5 |
995.2 |
|
PIMA |
1.2 |
89.7 |
160.4 |
1.0 |
14.2 |
54.6 |
0.3 |
0.3 |
Terry Reilly
Senior Commodity Analyst – Grain and Oilseeds
Futures International
One Lincoln Center
18 W 140 Butterfield Rd.
Oakbrook Terrace, Il. 60181
W: 312.604.1366
ICE IM: treilly1
Skype: fi.treilly

Trading of futures, options, swaps and other derivatives is risky and is not suitable for all persons. All of these investment products are leveraged, and you can lose more than your initial deposit. Each investment product is offered only to and from jurisdictions where solicitation and sale are lawful, and in accordance with applicable laws and regulations in such jurisdiction. The information provided here should not be relied upon as a substitute for independent research before making your investment decisions. Futures International, LLC is merely providing this information for your general information and the information does not take into account any particular individual’s investment objectives, financial situation, or needs. All investors should obtain advice based on their unique situation before making any investment decision. The contents of this communication and any attachments are for informational purposes only and under no circumstances should they be construed as an offer to buy or sell, or a solicitation to buy or sell any future, option, swap or other derivative. The sources for the information and any opinions in this communication are believed to be reliable, but Futures International, LLC does not warrant or guarantee the accuracy of such information or opinions. Futures International, LLC and its principals and employees may take positions different from any positions described in this communication. Past results are not necessarily indicative of future results.