PDF attached
USDA Export Sales
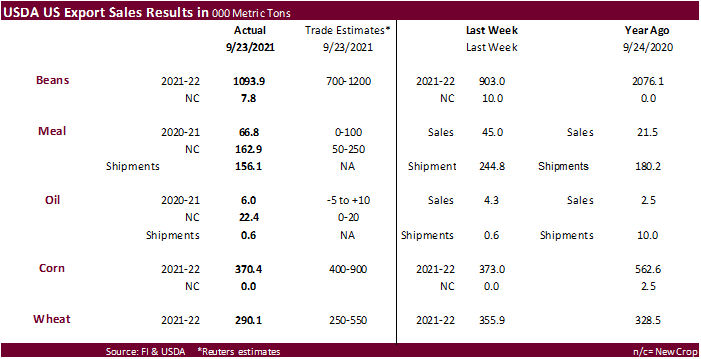
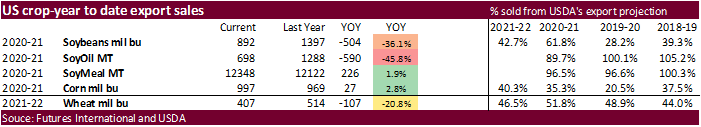
USDA export sales for soybeans were above expectations at 1.094 million tons and included China for 776,500 tons (204,000 tons switched from unknown) and Egypt for 92,500 tons. Combined old and new-crop soybean meal sales were within expectations and shipments of 156,100 tons were down from 244,800 previous week. Soybean oil sales for old crop improved to 6,000 tons and new-crop was much better than expected 22,400 tons. New-crop soybean oil sales included Guatemala (17,000 MT). Corn export sales were 370,400 tons, near unchanged from the previous week, and included Guatemala(138,400 MT), Mexico (102,600 MT, including decreases of 5,900 MT). All-wheat sales were poor at 290,100 tons and low end of expectations.
U.S. EXPORT SALES FOR WEEK ENDING 09/23/21
|
|
CURRENT MARKETING YEAR |
NEXT MARKETING YEAR |
||||||
|
COMMODITY |
NET SALES |
OUTSTANDING SALES |
WEEKLY EXPORTS |
ACCUMULATED EXPORTS |
NET SALES |
OUTSTANDING SALES |
||
|
CURRENT YEAR |
YEAR |
CURRENT YEAR |
YEAR |
|||||
|
|
THOUSAND METRIC TONS |
|||||||
|
WHEAT |
|
|
|
|
|
|
|
|
|
HRW |
149.3 |
1,567.8 |
1,633.2 |
153.9 |
2,691.5 |
3,658.2 |
0.0 |
0.0 |
|
SRW |
19.6 |
666.7 |
321.0 |
102.8 |
1,048.5 |
806.5 |
0.0 |
0.0 |
|
HRS |
51.5 |
988.5 |
1,709.8 |
43.8 |
1,988.9 |
2,345.7 |
0.0 |
0.0 |
|
WHITE |
74.8 |
582.0 |
1,304.5 |
68.3 |
1,419.0 |
1,679.0 |
0.0 |
0.0 |
|
DURUM |
-5.0 |
60.5 |
233.8 |
0.0 |
61.4 |
298.6 |
0.0 |
0.0 |
|
TOTAL |
290.1 |
3,865.5 |
5,202.3 |
368.9 |
7,209.3 |
8,787.9 |
0.0 |
0.0 |
|
BARLEY |
5.0 |
25.5 |
33.6 |
0.0 |
4.7 |
8.5 |
0.0 |
0.0 |
|
CORN |
370.4 |
23,794.1 |
21,879.2 |
676.2 |
1,522.0 |
2,743.0 |
0.0 |
333.2 |
|
SORGHUM |
78.8 |
2,235.7 |
2,567.6 |
112.5 |
115.6 |
235.1 |
0.0 |
0.0 |
|
SOYBEANS |
1,093.9 |
23,224.8 |
33,447.8 |
528.7 |
1,061.4 |
4,565.4 |
7.8 |
19.8 |
|
SOY MEAL |
66.8 |
1,001.3 |
520.2 |
156.1 |
11,346.5 |
11,602.0 |
162.9 |
2,528.1 |
|
SOY OIL |
6.0 |
22.4 |
68.7 |
0.6 |
675.2 |
1,219.0 |
22.4 |
30.0 |
|
RICE |
|
|
|
|
|
|
|
|
|
L G RGH |
11.5 |
185.5 |
358.2 |
1.8 |
175.1 |
54.5 |
0.0 |
0.0 |
|
M S RGH |
0.0 |
8.0 |
27.0 |
0.0 |
1.2 |
2.0 |
0.0 |
0.0 |
|
L G BRN |
0.2 |
4.4 |
13.8 |
0.6 |
13.4 |
5.5 |
0.0 |
0.0 |
|
M&S BR |
12.1 |
54.3 |
15.1 |
0.1 |
13.9 |
18.2 |
0.0 |
0.0 |
|
L G MLD |
7.1 |
139.7 |
57.4 |
46.2 |
133.5 |
60.9 |
0.0 |
0.0 |
|
M S MLD |
44.1 |
68.4 |
75.9 |
6.0 |
66.6 |
63.0 |
0.0 |
0.0 |
|
TOTAL |
75.1 |
460.3 |
547.3 |
54.8 |
403.7 |
204.1 |
0.0 |
0.0 |
|
COTTON |
|
THOUSAND RUNNING BALES |
||||||
|
UPLAND |
571.4 |
5,708.3 |
5,785.9 |
163.9 |
1,515.5 |
2,170.1 |
0.0 |
686.8 |
|
PIMA |
16.9 |
160.4 |
221.3 |
11.7 |
54.6 |
87.4 |
0.0 |
0.0 |
This summary is based on reports from exporters for the period September 17-23, 2021.
Wheat: Net sales of 290,100 metric tons (MT) for 2021/2022 were down 19 percent from the previous week and 30 percent from the prior 4-week average. Increases primarily for Japan (51,500 MT, including decreases of 5,700 MT), Taiwan (49,600 MT), Nigeria (44,700 MT, including 44,000 MT switched from unknown destinations), the Philippines (41,500 MT), and Colombia (41,300 MT, including decreases of 1,400 MT), were offset by reductions primarily for unknown destinations (66,400 MT). Exports of 368,900 MT were down 27 percent from the previous week and 19 percent from the prior 4-week average. The destinations were primarily to China (71,400 MT), Nigeria (50,000 MT), Thailand (47,500 MT), Mexico (46,400 MT), and Venezuela (38,900 MT).
Corn: Net sales of 370,400 MT for 2021/2022 primarily for Guatemala (138,400 MT), Mexico (102,600 MT, including decreases of 5,900 MT), Canada (87,600 MT, including decreases of 200 MT), Japan (77,400 MT, including 88,600 MT switched from unknown destinations and decreases of 11,800 MT), and Costa Rica (33,000 MT, including 30,000 MT switched from unknown destinations), were offset by reductions primarily for unknown destinations (110,900 MT). Exports of 676,200 MT were primarily to Mexico (262,200 MT), China (140,400 MT), Japan (107,900 MT), Honduras (49,500 MT), and Costa Rica (30,900 MT).
Optional Origin Sales: For 2021/2022, the current outstanding balance of 170,000 MT is for unknown destinations.
Barley: Total net sales of 5,000 MT for 2021/2022 were for Japan. No exports were reported for the week.
Sorghum: Net sales of 78,800 MT for 2021/2022 were reported for unknown destinations (65,000 MT), Mexico (11,300 MT), and China (2,500 MT, including decreases of 1,400 MT). Exports of 112,500 MT were to China (110,500 MT) and Mexico (2,000 MT).
Rice: Net sales of 75,100 MT for 2021/2022 were up noticeably from the previous week and from the prior 4-week average. Increases were primarily for Japan (39,300 MT), Taiwan (12,000 MT), Guatemala (6,000 MT), El Salvador (5,400 MT), and Canada (3,900 MT). Exports of 54,800 MT were up noticeably from the previous week and up 29 percent from the prior 4-week average. The destinations were primarily to Iraq (43,100 MT), Canada (2,900 MT), Mexico (2,800 MT), Jordan (2,600 MT), and Saudi Arabia (2,500 MT).
Soybeans: Net sales of 1,093,900 MT for 2021/2022 primarily for China (776,500 MT, including 204,000 MT switched from unknown destinations), Egypt (92,500 MT), the Netherlands (86,300 MT, including 84,000 MT switched from unknown destinations), Turkey (55,000 MT), and Mexico (43,400 MT), were offset by reductions for unknown destinations (131,400 MT). Total net sales of 7,800 MT for 2022/2023 were for Cuba. Exports of 528,700 MT were primarily to China (292,200 MT), the Netherlands (86,300 MT), Italy (39,200 MT), Mexico (33,900 MT), and Spain (33,000 MT).
Export for Own Account: For 2021/2022, the current exports for own account outstanding balance is 5,800 MT, all Canada.
Soybean Cake and Meal: Net sales of 66,800 MT for 2020/2021 were up 48 percent from the previous week and 22 percent from the prior 4-week average. Increases primarily for the Philippines (47,300 MT), Spain (31,900 MT, including 30,000 MT switched from Italy), Canada (5,800 MT), Costa Rica (4,900 MT), and Guyana (3,700 MT switched from unknown destinations), were offset by reductions primarily for Italy (30,000 MT). For 2021/2022, net sales of 162,900 MT primarily for Guatemala (59,400 MT), the Dominican Republic (38,500 MT), Mexico (21,900 MT), Canada (15,000 MT), and Colombia (8,900 MT), were offset by reductions for Costa Rica (4,900 MT). Exports of 156,100 MT were down 36 percent from the previous week, but up 17 percent from the prior 4-week average. The destinations were primarily to the Philippines (48,200 MT), Spain (31,900 MT), Mexico (25,800 MT), Colombia (17,500 MT), and Panama (11,000 MT).
Soybean Oil: Net sales of 6,000 MT for 2020/2021 were up 39 percent from the previous week and up noticeably from the prior 4-week average. Increases were reported for Costa Rica (2,500 MT), Morocco (1,900 MT), the Dominican Republic (900 MT), Venezuela (500 MT), and Canada (200 MT). Net sales for 2021/2022 of 22,400 MT were primarily for Guatemala (17,000 MT), the Dominican Republic (2,400 MT), and Canada (2,300 MT). Exports of 600 MT were up 6 percent from the previous week, but down 71 percent from the prior 4-week average. The destinations were to Canada (500 MT) and Honduras (100 MT).
Cotton: Net sales of 571,400 RB for 2021/2022 were up 65 percent from the previous week and 92 percent from the prior 4-week average. Increases primarily for China (418,600 RB), Turkey (39,600 RB, including decreases of 100 RB), Indonesia (33,400 RB), Mexico (16,400 RB), and Vietnam (15,400 RB, including 1,600 RB switched from China), were offset by reductions for Bangladesh (100 RB). Exports of 163,900 RB were down 7 percent from the previous week and 11 percent from the prior 4-week average. The destinations were primarily to China (36,000 RB), Pakistan (34,000 RB), Mexico (23,100 RB), Turkey (16,000 RB), and Thailand (9,200 RB). Net sales of Pima totaling 16,900 RB were down 28 percent from the previous week, but up 13 percent from the prior 4-week average. Increases were primarily for India (10,600 RB), Peru (2,500 RB), China (1,700 RB), Bangladesh (500 RB), and Turkey (400 RB). Exports of 11,700 RB were up noticeably from the previous week and up 99 percent from the prior 4-week average. The destinations were primarily to China (5,600 RB), India (2,800 RB), Egypt (1,700 RB), Pakistan (800 RB), and Peru (700 RB).
Optional Origin Sales: For 2021/2022, the current outstanding balance of 8,800 RB is for Pakistan.
Exports for Own Account: For 2021/2022, the current exports for own account outstanding balance of 4,800 RB is for China (4,700 RB) and Vietnam (100 RB).
Hides and Skins: Net sales of 284,600 pieces for 2021 were down 22 percent from the previous week and 17 percent from the prior 4-week average. Increases primarily for China (186,300 whole cattle hides, including decreases of 19,500 pieces), Mexico (40,900 whole cattle hides, including decreases of 3,300 pieces), South Korea (34,200 whole cattle hides, including decreases of 2,600 pieces), Thailand (17,200 whole cattle hides, including decreases of 800 pieces), and Taiwan (5,600 whole cattle hides, including decreases of 200 pieces), were offset by reductions for Germany (200 pieces) and Japan (200 pieces). Exports of 213,600 pieces were down 38 percent from the previous week and 45 percent from the prior 4-week average. Whole cattle hides exports were primarily to China (151,900 pieces), South Korea (21,900 pieces), Thailand (11,300 pieces), Mexico (11,300 pieces), and Taiwan (6,900 pieces).
Net sales of 130,600 wet blues for 2021 were down 9 percent from the previous week and 5 percent from the prior 4-week average. Increases were primarily for Italy (31,700 unsplit and 15,600 grain splits, including decreases of 400 unsplit), Thailand (28,500 unsplit, including decreases of 300 unsplit), Vietnam (25,900 unsplit, including decreases of 100 unsplit), China (20,000 unsplit), and Mexico (8,600 grain splits, including decreases of 200 grain splits). Exports of 123,000 wet blues were down 15 percent from the previous week and 12 percent from the prior 4-week average. The destinations were primarily to Italy (45,200 unsplit and 4,800 grain splits), Vietnam (30,400 unsplit), China (18,900 unsplit), Mexico (10,300 grain splits), and Thailand (6,900 unsplit). Net sales of 139,700 splits were reported for China (137,600 pounds) and Taiwan (2,100 pounds). Exports of 376,600 pounds were primarily to China (212,600 pounds) and Vietnam (120,000 pounds).
Beef: Net sales of 16,100 MT reported for 2021 were up 2 percent from the previous week and 9 percent from the prior 4-week average. Increases primarily for Japan (5,500 MT, including decreases of 800 MT), South Korea (5,300 MT, including decreases 500 MT), China (2,800 MT, including decreases of 100 MT), Taiwan (1,100 MT, including decreases of 100 MT), and Mexico (700 MT), were offset by reductions for the Philippines (800 MT). Net sales of 1,000 MT for 2022 were primarily for Guatemala (500 MT), Mexico (200 MT), and Japan (200 MT). Exports of 18,500 MT were up 2 percent from the previous week and 3 percent from the prior 4-week average. The destinations were primarily to Japan (5,500 MT), South Korea (4,900 MT), China (3,500 MT), Taiwan (1,100 MT), and Mexico (1,000 MT).
Pork: Net sales of 42,500 MT reported for 2021 were up 31 percent from the previous week and 36 percent from the prior 4-week average. Increases were primarily for Mexico (20,400 MT, including decreases of 400 MT, 200 MT – late), China (14,000 MT, including decreases of 500 MT), Japan (2,600 MT, including decreases of 300 MT), Colombia (1,400 MT, including decreases of 200 MT), and Nicaragua (900 MT). Total net sales of 100 MT for 2022 were for Australia. Exports of 30,300 MT were down 16 percent from the previous week, but up 2 percent from the prior 4-week average. The destinations were primarily to Mexico (14,700 MT, including 200 MT – late), China (4,400 MT), Japan (3,600 MT), Canada (1,600 MT), and South Korea (1,600 MT).
Export Adjustment: Accumulated exports of pork to China were adjusted down 118 MT for weekending September 16th. This shipment was reported in error.
Late Reporting: For 2021/2022, net sales and exports total
Terry Reilly
Senior Commodity Analyst – Grain and Oilseeds
Futures International
One Lincoln Center
18 W 140 Butterfield Rd.
Oakbrook Terrace, Il. 60181
W: 312.604.1366
ICE IM: treilly1
Skype: fi.treilly

Trading of futures, options, swaps and other derivatives is risky and is not suitable for all persons. All of these investment products are leveraged, and you can lose more than your initial deposit. Each investment product is offered only to and from jurisdictions where solicitation and sale are lawful, and in accordance with applicable laws and regulations in such jurisdiction. The information provided here should not be relied upon as a substitute for independent research before making your investment decisions. Futures International, LLC is merely providing this information for your general information and the information does not take into account any particular individual’s investment objectives, financial situation, or needs. All investors should obtain advice based on their unique situation before making any investment decision. The contents of this communication and any attachments are for informational purposes only and under no circumstances should they be construed as an offer to buy or sell, or a solicitation to buy or sell any future, option, swap or other derivative. The sources for the information and any opinions in this communication are believed to be reliable, but Futures International, LLC does not warrant or guarantee the accuracy of such information or opinions. Futures International, LLC and its principals and employees may take positions different from any positions described in this communication. Past results are not necessarily indicative of future results.