PDF attached
US Initial Jobless Claims Oct 1: 219K (est 204K; prev 193K)
US Continuing Claims Sep 24: 1361K (est 1350K; prev 1347K)
USDA Export Sales
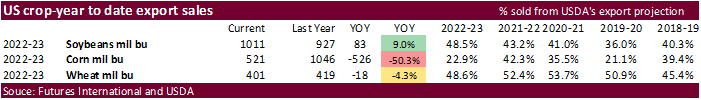
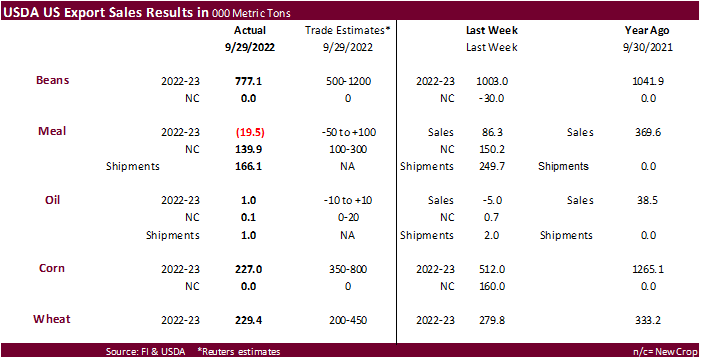
Corn and wheat export sales were below and at the low end of expectations, respectively. China slowed US soybean purchasing to 157,100 tons from 548,700 tons previous week. Meal and soybean oil sales were within expectations. Overall, a disappointing report, but not surprising with Midwest river logistical problems. New crop year for meal and oil so updated tables will be released this evening. Attached soybeans, corn, and wheat.
This summary is based on reports from exporters for the period September 23-29, 2022.
Wheat: Net sales of 229,400 metric tons (MT) for 2022/2023 primarily for the Philippines (85,300 MT, including decreases of 700 MT), Taiwan (51,800 MT), Nigeria (51,200 MT, including 47,800 MT switched from unknown destinations), Japan (28,600 MT), and Mexico (28,300 MT), were offset by reductions primarily for unknown destinations (49,000 MT). Exports of 629,800 MT were primarily to the Philippines (127,300 MT), Indonesia (75,600 MT), Brazil (72,200 MT), China (64,600 MT), and South Korea (55,000 MT).
Corn: Net sales of 227,000 MT for 2022/2023 primarily for Mexico (147,300 MT, including decreases of 1,800 MT), Honduras (28,200 MT), Guatemala (20,800 MT, including 7,500 MT switched from El Salvador and decreases of 1,700 MT), China (14,200 MT), and Costa Rica (11,100 MT, including decreases of 2,800 MT), were offset by reductions primarily for Japan (8,500 MT), El Salvador (7,500 MT), and Canada (2,300 MT). Exports of 645,500 MT were primarily to China (422,300 MT), Mexico (182,800 MT), Guatemala (13,300 MT), Canada (10,000 MT), and Jamaica (7,200 MT).
Barley: No net sales or exports were reported for the week.
Sorghum: No net sales were reported for the week. Exports of 3,700 MT were to Mexico.
Rice: Net sales of 38,100 MT for 2022/2023 primarily for Japan (13,000 MT), Canada (9,500 MT), Guatemala (5,000 MT, including decreases of 1,000 MT), Nicaragua (4,400 MT), and Jordan (3,900 MT), were offset by reductions for El Salvador (100 MT). Exports of 9,700 MT were primarily to Canada (2,800 MT), Mexico (2,300 MT), Saudi Arabia (1,700 MT), South Korea (1,600 MT), and Austria (700 MT).
Soybeans: Net sales of 777,100 MT for 2022/2023 primarily for Mexico (233,400 MT), China (157,100 MT, including decreases of 5,400 MT), the Netherlands (150,100 MT, including 138,000 MT switched from unknown destinations), Taiwan (57,800 MT, including 50,000 MT switched from unknown destinations and decreases of 800 MT), and Spain (57,200 MT, including 57,000 MT switched from China), were offset by reductions for Japan (5,500 MT) and Colombia (1,300 MT). Exports of 617,500 MT were primarily to the Netherlands (150,100 MT), Mexico (69,400 MT), China (65,500 MT), Taiwan (57,300 MT), and Spain (57,200 MT).
Optional Origin Sales: For 2021/2022, the current outstanding balance of 300 MT, all South Korea.
Export for Own Account: For 2022/2023, the current exports for own account outstanding balance is 6,300 MT, all Canada.
Soybean Cake and Meal: Net sales reductions of 19,500 MT for 2021/2022 primarily for Canada (15,700 MT), Mexico (7,100 MT), Nicaragua (2,500 MT), Sri Lanka (1,700 MT, including decreases of 400 MT), and Japan (1,600 MT), were more than offset by reductions for Vietnam (48,000 MT), Venezuela (4,200 MT), and unknown destinations (2,800 MT). Net sales of 139,900 MT for 2022/2023 primarily for Vietnam (48,000 MT), Canada (35,300 MT), Colombia (26,000 MT), Mexico (25,600 MT), and the Dominican Republic (5,000 MT), were offset by reductions for Nicaragua (1,400 MT). Exports of 166,100 MT were primarily to Guatemala (43,800 MT), Colombia (41,200 MT), Mexico (24,900 MT), Canada (21,500 MT), and El Salvador (12,700 MT).
Soybean Oil: Total net sales of 900 MT for 2021/2022 were for Canada. Total net sales of 100 MT for 2022/2023 were for Canada. Exports of 1,000 MT were to Canada.
Cotton: Net sales of 121,200 RB for 2022/2023 primarily for Pakistan (69,400 RB, including decreases of 3,500 RB), Turkey (14,000 RB, including decreases of 6,400 RB), Bangladesh (12,100 RB), Taiwan (10,900 RB), and South Korea (7,000 RB), were offset by reduction for El Salvador (4,500 RB), Indonesia (3,500 RB), and Vietnam (3,200 RB). Net sales of 48,500 RB for 2023/2024 primarily for Pakistan (22,900 RB), Guatemala (10,100 RB), Honduras (10,000 RB), and Bangladesh (6,600 RB), were offset by reductions for Thailand (4,600 RB). Exports of 209,600 RB were primarily to China (78,400 RB), Turkey (25,400 RB), Pakistan (21,200 RB), Bangladesh (19,200 RB), and Mexico (17,700 RB). Net sales of Pima totaling 1,600 RB were reported for Taiwan (900 RB), Italy (600 RB), and Indonesia (100 RB). Total net sales of 600 RB for 2023/2024 were for Italy. Exports of 3,300 RB were to Vietnam (1,800 RB), India (900 RB), Germany (400 RB), Turkey (100 RB), and Honduras (100 RB).
Optional Origin Sales: For 2022/2023, the current outstanding balance of 10,300 RB is for Malaysia (9,300 RB) and Pakistan (1,000 RB).
Export for Own Account: For 2022/2023, exports for own account totaling 2,900 RB to China were applied to new or outstanding sales. The current exports for own account outstanding balance of 74,500 RB is for China (37,600 RB), Vietnam (23,900 RB), Turkey (10,600 RB), India (1,500 RB), Pakistan (500 RB), and Indonesia (400 RB).
Hides and Skins: Net sales of 435,400 pieces for 2022 primarily for China (300,000 whole cattle hides, including decreases of 7,400 pieces), Mexico (63,700 whole cattle hides, including decreases of 400 pieces), South Korea (27,700 whole cattle hides, including decreases of 3,700 pieces), Brazil (20,900 whole cattle hides, including decreases of 100 pieces), and Thailand (18,200 whole cattle hides, including decreases of 900 pieces), were offset by reductions primarily for Taiwan (3,800 pieces). Total net sales of 2,200 calf skins were for Italy. In addition, total net sales reductions of 2,200 kip skins were for Italy. Exports of 465,600 whole cattle hides exports were primarily to China (308,200 pieces), Mexico (63,700 pieces), Thailand (28,900 pieces), South Korea (23,200 pieces), and Japan (8,800 pieces).
Net sales of 35,400 wet blues for 2022 were reported for China (13,700 unsplit), Vietnam (12,300 unsplit, including decreases of 100 unsplit), Italy (6,500 grain splits and 1,300 unsplit, including decreases of 3,500 unsplit), Mexico (1,500 unsplit, including decreases of 1,000 unsplit), and Thailand (100 unsplit, including decreases of 100 unsplit). Net sales of 4,300 wet blues for 2023 were reported for Italy (3,300 unsplit) and Mexico (1,000 unsplit). Exports of 144,300 wet blues were primarily to Vietnam (53,300 unsplit), China (31,700 unsplit), Thailand (29,200 unsplit), Italy (23,700 unsplit), and Taiwan (4,800 unsplit). Net sales of 87,500 splits reported for China (88,000 pounds) and South Korea (1,600 pounds), were offset by reductions for Vietnam (2,100 pounds). Exports of 277,900 pounds were primarily to Vietnam (236,600 pounds).
Beef: Net sales of 16,400 MT for 2022 primarily for South Korea (6,000 MT, including decreases of 700 MT), Japan (2,200 MT, including decreases of 700 MT), Mexico (2,200 MT), China (2,100 MT, including decreases of 100 MT), and Taiwan (900 MT, including decreases of 100 MT), were offset by reductions for Kuwait (100 MT). Total net sales of 100 MT for 2023 were for Japan. Exports of 18,400 MT were primarily to South Korea (4,700 MT), Japan (4,400 MT), China (3,100 MT), Mexico (1,500 MT), and Taiwan (1,100 MT).
Pork: Net sales of 34,300 MT for 2022 primarily for Mexico (16,800 MT, including decreases of 200 MT), China (10,100 MT, including decreases of 200 MT), Canada (1,900 MT, including decreases of 400 MT), South Korea (1,600 MT, including decreases of 200 MT), and the Dominican Republic (1,200 MT), were offset by reductions for Australia (100 MT). Exports of 29,700 MT were primarily to Mexico (13,500 MT), China (5,000 MT), Japan (3,400 MT), Canada (1,700 MT), and South Korea (1,700 MT).
Late Reporting: For 2021/2022, net sales of 800 MT of pork were reported late. The destinations were Marshall Islands (200 MT), Western Samoa (100 MT), Federated States of Micronesia (100 MT), Palau (100 MT), other Pacific Islands (100 MT), American Samoa (100 MT), and Northern Mariana Islands (100 MT). Exports of 700 MT were reported late. The destinations were to Marshall Islands (200 MT), Western Samoa (100 MT), Federated States of Micronesia (100 MT), Palau (100 MT), other Pacific Islands (100 MT), and Northern Mariana Islands (100 MT).
October 6, 2022 1 FOREIGN AGRICULTURAL SERVICE/USDA
U.S. EXPORT SALES FOR WEEK ENDING 09/29/2022
|
|
CURRENT MARKETING YEAR |
NEXT MARKETING YEAR |
||||||
|
COMMODITY |
NET SALES |
OUTSTANDING SALES |
WEEKLY EXPORTS |
ACCUMULATED EXPORTS |
NET SALES |
OUTSTANDING SALES |
||
|
CURRENT YEAR |
YEAR AGO |
CURRENT YEAR |
YEAR AGO |
|||||
|
|
THOUSAND METRIC TONS |
|||||||
|
WHEAT |
|
|
|
|
|
|
|
|
|
HRW |
57.6 |
792.8 |
1,517.9 |
134.0 |
2,274.7 |
2,839.1 |
0.0 |
1.7 |
|
SRW |
5.0 |
539.8 |
672.1 |
56.6 |
1,499.8 |
1,093.3 |
0.0 |
0.0 |
|
HRS |
99.0 |
1,005.0 |
851.9 |
190.3 |
2,183.9 |
2,232.7 |
0.0 |
0.0 |
|
WHITE |
67.6 |
730.1 |
552.8 |
245.3 |
1,721.3 |
1,526.1 |
0.0 |
0.3 |
|
DURUM |
0.1 |
90.3 |
60.5 |
3.5 |
77.5 |
61.4 |
0.0 |
0.0 |
|
TOTAL |
229.4 |
3,158.1 |
3,655.3 |
629.8 |
7,757.1 |
7,752.6 |
0.0 |
2.0 |
|
BARLEY |
0.0 |
11.6 |
24.5 |
0.0 |
3.9 |
5.7 |
0.0 |
0.0 |
|
CORN |
227.0 |
10,975.9 |
24,084.6 |
645.5 |
2,246.8 |
2,496.6 |
0.0 |
250.5 |
|
SORGHUM |
0.0 |
272.6 |
2,190.2 |
3.7 |
20.4 |
163.5 |
0.0 |
0.0 |
|
SOYBEANS |
777.1 |
25,675.7 |
23,326.5 |
617.5 |
1,831.8 |
1,844.7 |
0.0 |
0.0 |
|
SOY MEAL |
-19.5 |
412.9 |
791.3 |
166.1 |
11,668.4 |
11,534.7 |
139.9 |
2,316.2 |
|
SOY OIL |
0.9 |
21.9 |
16.7 |
1.0 |
676.9 |
675.6 |
0.1 |
6.5 |
|
RICE |
|
|
|
|
|
|
|
|
|
L G RGH |
9.3 |
61.8 |
199.0 |
0.0 |
72.2 |
227.8 |
0.0 |
0.0 |
|
M S RGH |
0.0 |
13.5 |
7.7 |
1.4 |
3.0 |
1.5 |
0.0 |
0.0 |
|
L G BRN |
3.9 |
6.3 |
3.7 |
0.3 |
2.6 |
14.5 |
0.0 |
0.0 |
|
M&S BR |
0.0 |
5.7 |
54.3 |
0.0 |
1.7 |
14.0 |
0.0 |
0.0 |
|
L G MLD |
7.8 |
141.3 |
137.7 |
3.7 |
87.1 |
138.7 |
0.0 |
0.0 |
|
M S MLD |
17.1 |
36.5 |
69.6 |
4.4 |
67.5 |
69.0 |
0.0 |
0.0 |
|
TOTAL |
38.1 |
265.1 |
471.9 |
9.7 |
234.2 |
465.5 |
0.0 |
0.0 |
|
COTTON |
|
THOUSAND RUNNING BALES |
||||||
|
UPLAND |
121.2 |
6,105.1 |
5,829.9 |
209.6 |
2,035.5 |
1,640.6 |
48.5 |
1,043.7 |
|
PIMA |
1.6 |
88.0 |
170.4 |
3.3 |
17.4 |
58.4 |
0.6 |
0.9 |
Terry Reilly
Senior Commodity Analyst – Grain and Oilseeds
Futures International
One Lincoln Center
18 W 140 Butterfield Rd.
Oakbrook Terrace, Il. 60181
W: 312.604.1366
ICE IM: treilly1
Skype: fi.treilly

Trading of futures, options, swaps and other derivatives is risky and is not suitable for all persons. All of these investment products are leveraged, and you can lose more than your initial deposit. Each investment product is offered only to and from jurisdictions where solicitation and sale are lawful, and in accordance with applicable laws and regulations in such jurisdiction. The information provided here should not be relied upon as a substitute for independent research before making your investment decisions. Futures International, LLC is merely providing this information for your general information and the information does not take into account any particular individual’s investment objectives, financial situation, or needs. All investors should obtain advice based on their unique situation before making any investment decision. The contents of this communication and any attachments are for informational purposes only and under no circumstances should they be construed as an offer to buy or sell, or a solicitation to buy or sell any future, option, swap or other derivative. The sources for the information and any opinions in this communication are believed to be reliable, but Futures International, LLC does not warrant or guarantee the accuracy of such information or opinions. Futures International, LLC and its principals and employees may take positions different from any positions described in this communication. Past results are not necessarily indicative of future results.