PDF attached
USDA export Sales
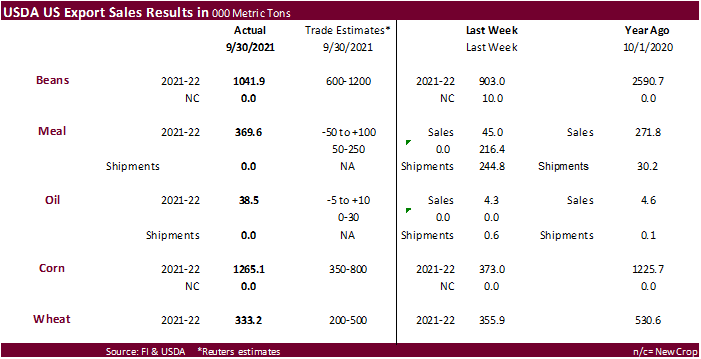
USDA export sales for soybeans of 1.042 million tons were within expectations. China booked 671,300 tons but included 131,000 tons switched from unknown. Soybean meal sales were above an average trade estimate at 369,600 tons and soybean oil was a large 38,500 tons, supportive for SBO futures. Corn export sales were well above expectations at 1.265 million tons and this should be friendly for futures. Mexico booked 801,400 tons. All-wheat sales slowed to 333,200 tons but were within expectations.
U.S. EXPORT SALES FOR WEEK ENDING 09/30/21
FAX 202-690-3275
|
|
CURRENT MARKETING YEAR |
NEXT MARKETING YEAR |
||||||
|
COMMODITY |
NET SALES |
OUTSTANDING SALES |
WEEKLY EXPORTS |
ACCUMULATED EXPORTS |
NET SALES |
OUTSTANDING SALES |
||
|
CURRENT YEAR |
YEAR |
CURRENT YEAR |
YEAR |
|||||
|
WHEAT |
THOUSAND METRIC TONS |
|||||||
|
HRW |
97.8 |
1,517.9 |
1,512.5 |
147.7 |
2,839.2 |
3,874.7 |
0.0 |
0.0 |
|
SRW |
50.3 |
672.1 |
314.3 |
44.9 |
1,093.3 |
849.5 |
0.0 |
0.0 |
|
HRS |
107.1 |
851.9 |
1,667.4 |
243.7 |
2,232.7 |
2,602.7 |
0.0 |
0.0 |
|
WHITE |
78.0 |
552.8 |
1,315.8 |
107.1 |
1,526.1 |
1,842.2 |
0.0 |
0.0 |
|
DURUM |
0.0 |
60.5 |
220.3 |
0.0 |
61.4 |
321.6 |
0.0 |
0.0 |
|
TOTAL |
333.2 |
3,655.3 |
5,030.1 |
543.4 |
7,752.7 |
9,490.7 |
0.0 |
0.0 |
|
BARLEY |
0.0 |
24.5 |
33.3 |
1.0 |
5.7 |
8.7 |
0.0 |
0.0 |
|
CORN |
1,265.1 |
24,084.6 |
22,170.0 |
974.6 |
2,496.6 |
3,677.8 |
0.0 |
333.3 |
|
SORGHUM |
2.4 |
2,190.2 |
2,542.4 |
47.9 |
163.5 |
392.7 |
0.0 |
0.0 |
|
SOYBEANS |
1,041.9 |
23,326.5 |
33,970.0 |
940.2 |
2,001.7 |
6,577.4 |
0.0 |
19.8 |
|
SOY MEAL |
369.6 |
3,689.0 |
3,436.8 |
0.0 |
0.0 |
30.2 |
-1.4 |
29.9 |
|
SOY OIL |
38.5 |
85.2 |
176.7 |
0.0 |
0.0 |
0.1 |
0.0 |
0.0 |
|
RICE |
|
|
|
|
|
|
|
|
|
L G RGH |
66.2 |
199.0 |
567.2 |
52.7 |
227.8 |
55.0 |
0.0 |
0.0 |
|
M S RGH |
0.0 |
7.7 |
26.5 |
0.3 |
1.5 |
2.4 |
0.0 |
0.0 |
|
L G BRN |
0.4 |
3.7 |
13.3 |
1.1 |
14.5 |
6.2 |
0.0 |
0.0 |
|
M&S BR |
0.1 |
54.3 |
24.1 |
0.1 |
14.0 |
25.3 |
0.0 |
0.0 |
|
L G MLD |
3.2 |
137.7 |
61.6 |
5.2 |
138.7 |
64.1 |
0.0 |
0.0 |
|
M S MLD |
3.5 |
69.6 |
96.6 |
2.3 |
69.0 |
67.2 |
0.0 |
0.0 |
|
TOTAL |
73.4 |
471.9 |
789.3 |
61.7 |
465.5 |
220.2 |
0.0 |
0.0 |
|
COTTON |
|
THOUSAND RUNNING BALES |
|
|||||
|
UPLAND |
246.7 |
5,829.9 |
5,822.0 |
125.1 |
1,640.6 |
2,312.4 |
55.0 |
741.8 |
|
PIMA |
13.7 |
170.4 |
227.2 |
3.7 |
58.4 |
103.1 |
0.0 |
0.0 |
|
FINAL 2020/21 MARKETING YEAR |
||||
|
COMMODITY |
NET SALES |
CARRYOVER SALES 1/ |
09/30/21 EXPORTS |
ACCUMULATED EXPORTS |
|
SOY MEAL |
-21.7 |
791.3 |
188.3 |
11,534.7 |
|
SOY OIL |
-5.4 |
16.7 |
0.4 |
675.6 |
|
|
|
|
|
|
|
|
|
|
|
|
This summary is based on reports from exporters for the period September 24-30, 2021.
Wheat: Net sales of 333,200 metric tons (MT) for 2021/2022 were up 15 percent from the previous week, but down 19 percent from the prior 4-week average. Increases primarily for Mexico (89,100 MT, including decreases of 9,400 MT), South Korea (82,700 MT), the Philippines (69,300 MT, including decreases of 5,400 MT), Indonesia (59,000 MT), and Nigeria (32,000 MT, including 30,000 MT switched from unknown destinations), were offset by reductions primarily for unknown destinations (42,200 MT), Brazil (19,500 MT), and the Dominican Republic (16,700 MT). Exports of 543,400 MT were up 47 percent from the previous week and 22 percent from the prior 4-week average. The destinations were primarily to the Philippines (242,300 MT), Peru (67,500 MT), South Korea (55,000 MT), Guatemala (36,000 MT), and Japan (35,600 MT).
Corn: Net sales of 1,265,100 MT for 2021/2022 primarily for Mexico (801,400 MT, including decreases of 500 MT), Colombia (192,500 MT, including 100,000 MT switched from unknown destinations and decreases of 32,800 MT), Honduras (96,800 MT, including decreases of 10,300 MT), Canada (94,600 MT, including decreases of 100 MT), and Guatemala (60,000 MT), were offset by reductions for unknown destinations (149,500 MT). Exports of 974,600 MT were primarily to Mexico (349,100 MT), China (212,300 MT), Japan (193,100 MT), Colombia (125,800 MT), and Venezuela (24,800 MT).
Optional Origin Sales: For 2021/2022, the current outstanding balance of 170,000 MT is for unknown destinations.
Barley: No net sales were reported for the week. Exports of 1,000 MT for 2021/2022 were for Japan (800 MT) and Taiwan (200 MT).
Sorghum: Total net sales of 2,400 MT for 2021/2022 were reported for Mexico, including decreases of 600 MT. Exports of 47,900 MT were to Mexico (45,500 MT) and China (2,400 MT).
Rice: Net sales of 73,400 MT for 2021/2022 were down 2 percent from the previous week, but up 73 percent from the prior 4-week average. Increases were primarily for Mexico (38,200 MT), Honduras (16,100 MT), Nicaragua (12,000 MT), Guatemala (3,000 MT), and Canada (2,300 MT). Exports of 61,700 MT were up 13 percent from the previous week and 32 percent from the prior 4-week average. The destinations were primarily to Mexico (53,800 MT), Canada (3,800 MT), Jordan (2,100 MT), Saudi Arabia (900 MT), and Costa Rica (500 MT).
Soybeans: Net sales of 1,041,900 MT for 2021/2022 primarily for China (671,300 MT, including 131,000 MT switched from unknown destinations), Indonesia (128,400 MT, including 110,000 MT switched from unknown destinations and decreases of 300 MT), Germany (86,300 MT), Taiwan (84,000 MT), and Spain (72,400 MT, including 64,000 MT switched from the Netherlands), were offset by reductions for unknown destinations (246,000 MT) and Peru (7,000 MT). Exports of 940,200 MT were primarily to China (276,800 MT), Indonesia (119,100 MT), the Netherlands (91,300 MT), Germany (86,300 MT), and Mexico (79,200 MT).
Export for Own Account: For 2021/2022, the current exports for own account outstanding balance is 5,800 MT, all Canada.
Soybean Cake and Meal: Net sales for the 2021/2022 marketing year, which began October 1, totaled 369,600 MT primarily for the United Kingdom (60,000 MT), Colombia (55,400 MT, including decreases of 100 MT), the Philippines (54,300 MT), Honduras (43,700 MT), and Canada (30,900 MT), were offset by reductions for Venezuela (4,500 MT) and Guatemala (1,500 MT). A net sales reduction of 21,700 MT was carried over from the 2020/2021 marketing year, which ended September 30. Exports for the period ending September 30 of 188,300 MT brought accumulated exports to 11,534,700 MT, down 2 percent from the prior year’s total of 11,818,300 MT. The primary destinations were to the Philippines (46,300 MT, including 200 MT – late), Ecuador (32,400 MT), Canada (28,500 MT), Mexico (27,900 MT), and Venezuela (26,900 MT).
Late Reporting: For 2020/2021, exports totaling 200 MT of soybean cake and meal were reported late for the Philippines.
Soybean Oil: Net sales for the 2021/2022 marketing year, which began October 1, totaled 38,500 MT primarily for Morocco (19,000 MT), South Korea (10,000 MT), Canada (3,400 MT), Guatemala (2,500 MT, including decreases of 8,900 MT), and Cameroon (2,500 MT), were offset by reduction for Mexico (100 MT). A total net sales reduction of 5,400 MT was carried over from the 2020/2021 marketing year, which ended September 30. No exports for the period ending September 30. Exports for the period ending October 1 of 400 MT brought accumulated exports to 675,600 MT, down 45 percent from the prior year’s total of 1,234,600 MT, with Canada being the destination.
Cotton: Net sales of 246,700 RB for 2021/2022 were down 57 percent from the previous week and 40 percent from the prior 4-week average. Increases primarily for China (174,500 RB, including decreases of 11,000 RB), Guatemala (33,000 RB), Turkey (18,200 RB), Vietnam (14,200 RB, including 100 RB switched from Japan), and Indonesia (11,400 RB, including 1,200 switched from Vietnam), were offset by reductions for India (20,700 RB) and Pakistan (2,200 RB). Net sales for 2022/2023 of 55,000 RB were primarily for China (40,000 RB). Exports of 125,100 RB–a marketing-year low–were down 24 percent from the previous week and 32 percent from the prior 4-week average. The destinations were primarily to China (30,800 RB), Mexico (16,700 RB), Bangladesh (12,600 RB), Vietnam (11,200 RB), and Turkey (11,100 RB). Net sales of Pima totaling 13,700 RB were down 19 percent from the previous week and 12 percent from the prior 4-week average. Increases were primarily for India (8,300 RB) and Peru (4,700 RB). Exports of 3,700 RB were down 68 percent from the previous week and 51 percent from the prior 4-week average. The destinations were primarily to China (2,200 RB), India (900 RB), Thailand (400 RB), and Guatemala (200 RB).
Optional Origin Sales: For 2021/2022, the current outstanding balance of 8,800 RB is for Pakistan.
Exports for Own Account: For 2021/2022, the current exports for own account outstanding balance of 4,800 RB is for China (4,700 RB) and Vietnam (100 RB).
Hides and Skins: Net sales of 568,800 pieces for 2021 were up noticeably from the previous week and up 71 percent from the prior 4-week average. Increases primarily for China (310,500 whole cattle hides, including decreases of 116,900 pieces and 72,900 whole cattle hides – late), South Korea (102,600 whole cattle hides, including decreases of 3,000 pieces and 30,800 whole cattle hides – late), Thailand (38,100 whole cattle hides, including decreases of 6,300 pieces), Taiwan (34,200 whole cattle hides, including decreases of 1,300 pieces), and Mexico (26,300 whole cattle hides, including decreases of 13,600 pieces and 11,000 whole cattle hides – late), were offset by reductions for Italy (400 pieces). Exports of 501,000 pieces were up noticeably from the previous week and up 51 percent from the prior 4-week average. Whole cattle hides exports were primarily to China (261,600 pieces), South Korea (114,900 pieces), Thailand (34,500 pieces), Mexico (33,800 pieces), and Taiwan (18,700 pieces). Total net sales of 16,700 kip skins, including decreases of 100 pieces, were reported for Belgium. Exports of 5,500 pieces were to Belgium.
Net sales of 166,500 wet blues for 2021 were up 28 percent from the previous week and 40 percent from the prior 4-week average. Increases primarily for Italy (98,700 unsplit, including decreases of 1,100 unsplit and 16,200 unsplit – late), China (47,000 unsplit and 8,600 unsplit – late), Thailand (10,200 unsplit, including decreases of 300 unsplit), Vietnam (5,100 unsplit, including decreases of 100 unsplit), and the Dominican Republic (3,200 unsplit), were offset by reductions for India (100 unsplit). Net sales of 400 unsplit resulting in increases for China (6,000 unsplit), were offset by reductions for Italy (5,600 unsplit). Exports of 131,900 wet blues were up 7 percent from the previous week, but down 5 percent from the prior 4-week average. The destinations were primarily to Italy (41,200 unsplit and 6,100 grain splits), China (28,800 unsplit), Vietnam (24,900 unsplit), Mexico (5,000 grain splits and 3,700 unsplit), and Thailand (7,500 unsplit). Total net sales of 3,900 splits, including decreases of 1,000 pounds, were reported for China. Exports of 325,300 pounds were to Vietnam (200,000 pounds) and China (125,300 pounds).
Late Reporting: For 2021, net sales totaling 139,500 pieces were reported late for China (72,900 whole cattle hides), South Korea (30,800 whole cattle hides), and Mexico (11,000 whole cattle hides). Exports totaling 7,800 pieces were to China (4,200 pieces), South Korea (2,800 pieces), and Mexico (800 pieces). Net sales totaling 24,800 wet blues were for Italy (16,200 unsplit) and China (8,600 unsplit). Exports totaling 1,600 wet blues were for Italy.
Beef: Net sales of 15,600 MT reported for 2021 were down 3 percent from the previous week, but up 5 percent from the prior 4-week average. Increases primarily for China (6,000 MT, including decreases of 100 MT), Japan (3,200 MT, including decreases of 600 MT), South Korea (2,600 MT, including decreases of 400 MT), Mexico (1,500 MT), and Taiwan (1,100 MT, including decreases of 100 MT), were offset by reductions for Chile (100 MT), Colombia (100 MT), and Italy (100 MT). Net sales for 2022 of 500 MT were for Japan (400 MT) and Mexico (100 MT). Exports of 15,700 MT were down 15 percent from the previous week and 13 percent from the prior 4-week average. The destinations were primarily to Japan (4,700 MT), South Korea (3,700 MT), China (2,700 MT), Mexico (1,200 MT), and Taiwan (1,100 MT).
Pork: Net sales of 22,100 MT reported for 2021 were down 48 percent from the previous week and 34 percent from the prior 4-week average. Increases were primarily for Mexico (16,000 MT, including decreases of 600 MT), Colombia (1,700 MT, including decreases of 700 MT), Canada (1,200 MT, including decreases of 1,100 MT), South Korea (1,000 MT, including decreases of 200 MT), and Japan (700 MT, including decreases of 1,100 MT). For 2021/2022, net sales of 529,300 MT were primarily for Mexico (172,000 MT), unknown destinations (150,000 MT), Colombia (129,100 MT), and Japan (50,000 MT). Exports of 29,000 MT were down 4 percent from the previous week and from the prior 4-week average. The destinations were primarily to Mexico (14,600 MT), China (4,200 MT), Japan (3,200 MT), Canada (1,600 MT), and South Korea (1,500 MT).
October 7, 2021 1 FOREIGN AGRICULTURAL SERVICE/USDA
SUMMARY OF EXPORT TRANSACTIONS
Reported Under the Daily Reporting System
For Period Ending September 30, 2021
Commodity Destination Quantity (MT) Marketing
CORN MEXICO 576,800 MT 1/ 2021/2022
SOYBEANS CHINA 198,000 MT 1/ 2021/2022
1/ Export Sales.
Terry Reilly
Senior Commodity Analyst – Grain and Oilseeds
Futures International
One Lincoln Center
18 W 140 Butterfield Rd.
Oakbrook Terrace, Il. 60181
W: 312.604.1366
ICE IM: treilly1
Skype: fi.treilly

Trading of futures, options, swaps and other derivatives is risky and is not suitable for all persons. All of these investment products are leveraged, and you can lose more than your initial deposit. Each investment product is offered only to and from jurisdictions where solicitation and sale are lawful, and in accordance with applicable laws and regulations in such jurisdiction. The information provided here should not be relied upon as a substitute for independent research before making your investment decisions. Futures International, LLC is merely providing this information for your general information and the information does not take into account any particular individual’s investment objectives, financial situation, or needs. All investors should obtain advice based on their unique situation before making any investment decision. The contents of this communication and any attachments are for informational purposes only and under no circumstances should they be construed as an offer to buy or sell, or a solicitation to buy or sell any future, option, swap or other derivative. The sources for the information and any opinions in this communication are believed to be reliable, but Futures International, LLC does not warrant or guarantee the accuracy of such information or opinions. Futures International, LLC and its principals and employees may take positions different from any positions described in this communication. Past results are not necessarily indicative of future results.