PDF attached
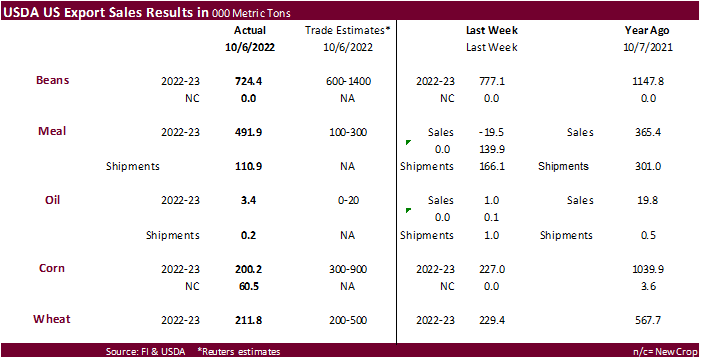
USDA Export Sales were near the low end of expectations for soybeans, well above expectations for meal, and poor for soybean oil (promotes meal/oil spreading). Corn export sales fell short of expectations and wheat was at the low end. The soybean sales included China (622,300 MT, including 251,000 MT switched from unknown destinations and decreases of 67,500 MT).
U.S. EXPORT SALES FOR WEEK ENDING 10/06/2022
|
|
CURRENT MARKETING YEAR |
NEXT MARKETING YEAR |
||||||
|
COMMODITY |
NET SALES |
OUTSTANDING SALES |
WEEKLY EXPORTS |
ACCUMULATED EXPORTS |
NET SALES |
OUTSTANDING SALES |
||
|
CURRENT YEAR |
YEAR AGO |
CURRENT YEAR |
YEAR AGO |
|||||
|
WHEAT |
THOUSAND METRIC TONS |
|||||||
|
HRW |
74.4 |
724.7 |
1,546.4 |
142.5 |
2,417.2 |
3,055.3 |
0.0 |
1.7 |
|
SRW |
28.4 |
519.6 |
609.3 |
48.6 |
1,548.4 |
1,186.5 |
0.0 |
0.0 |
|
HRS |
32.2 |
864.1 |
955.3 |
173.1 |
2,357.0 |
2,320.2 |
0.0 |
0.0 |
|
WHITE |
76.9 |
610.7 |
592.5 |
196.2 |
1,917.5 |
1,588.2 |
0.0 |
0.3 |
|
DURUM |
0.0 |
90.3 |
60.5 |
0.0 |
77.5 |
61.4 |
0.0 |
0.0 |
|
TOTAL |
211.8 |
2,809.4 |
3,764.0 |
560.5 |
8,317.6 |
8,211.5 |
0.0 |
2.0 |
|
BARLEY |
0.0 |
11.6 |
24.5 |
0.0 |
3.9 |
5.7 |
0.0 |
0.0 |
|
CORN |
200.2 |
10,753.5 |
24,206.3 |
422.6 |
2,669.4 |
3,414.8 |
60.5 |
311.0 |
|
SORGHUM |
5.9 |
271.2 |
2,130.5 |
7.3 |
27.7 |
225.8 |
0.0 |
0.0 |
|
SOYBEANS |
724.4 |
25,512.2 |
22,760.5 |
888.0 |
2,719.8 |
3,558.5 |
0.0 |
0.0 |
|
SOY MEAL |
491.9 |
2,977.5 |
3,753.4 |
110.9 |
110.9 |
301.0 |
0.0 |
1.4 |
|
SOY OIL |
3.3 |
19.8 |
104.5 |
0.2 |
0.2 |
0.5 |
0.0 |
0.1 |
|
RICE |
|
|
|
|
|
|
|
|
|
L G RGH |
2.0 |
62.9 |
220.5 |
0.9 |
73.1 |
235.9 |
0.0 |
0.0 |
|
M S RGH |
1.5 |
13.5 |
7.5 |
1.5 |
4.6 |
1.7 |
0.0 |
0.0 |
|
L G BRN |
0.8 |
6.3 |
3.8 |
0.8 |
3.4 |
15.0 |
0.0 |
0.0 |
|
M&S BR |
0.0 |
5.3 |
54.3 |
0.5 |
2.2 |
14.1 |
0.0 |
0.0 |
|
L G MLD |
7.4 |
101.1 |
135.8 |
47.6 |
134.7 |
142.1 |
0.0 |
0.0 |
|
M S MLD |
1.1 |
36.1 |
68.1 |
1.5 |
69.0 |
72.6 |
0.0 |
0.0 |
|
TOTAL |
12.8 |
225.1 |
490.0 |
52.8 |
286.9 |
481.3 |
0.0 |
0.0 |
|
COTTON |
|
THOUSAND RUNNING BALES |
|
|||||
|
UPLAND |
144.8 |
6,081.8 |
5,881.4 |
168.1 |
2,203.6 |
1,735.8 |
34.8 |
1,078.5 |
|
PIMA |
-2.0 |
85.2 |
166.2 |
0.8 |
18.2 |
69.0 |
0.0 |
0.9 |
|
FINAL 2021/22 MARKETING YEAR |
||||
|
COMMODITY |
NET SALES |
CARRYOVER SALES 1/ |
09/30/22 EXPORTS |
ACCUMULATED EXPORTS |
|
SOY MEAL |
-99.9 |
280.3 |
32.7 |
11,701.1 |
|
SOY OIL |
-10.1 |
10.2 |
1.6 |
678.4 |
|
|
|
|
|
|
|
|
|
|
|
|
This summary is based on reports from exporters for the period September 30-October 6, 2022.
Wheat: Net sales of 211,800 metric tons (MT) for 2022/2023 primarily for Japan (65,200 MT), Thailand (55,000 MT), Mexico (38,500 MT, including decreases of 300 MT), the Philippines (35,100 MT), and Venezuela (29,000 MT, including 30,000 MT switched from unknown destinations and decreases of 1,000 MT), were offset by reductions for Nigeria (24,300 MT) and unknown destinations (5,000 MT). Exports of 560,500 MT were primarily to China (135,600 MT), Iraq (105,000 MT), the Philippines (63,600 MT), South Korea (55,000 MT), and Taiwan (39,100 MT).
Corn: Net sales of 200,200 MT for 2022/2023 primarily for Japan (142,300 MT, including 85,400 MT switched from unknown destinations), Guatemala (22,800 MT, including decreases of 5,100 MT), Colombia (22,500 MT, including decreases of 1,000 MT), Mexico (19,100 MT, including decreases of 181,000 MT), and Panama (17,500 MT), were offset by reductions for unknown destinations (45,000 MT) and Hong Kong (100 MT). Total net sales of 60,500 MT for 2023/2024 were for Mexico. Exports of 422,600 MT were primarily to Mexico (189,700 MT), Japan (137,000 MT), China (76,700 MT), Colombia (9,000 MT), and Canada (3,700 MT).
Barley: No net sales or exports were reported for the week.
Sorghum: Net sales of 5,900 MT for 2022/2023 reported for Mexico (6,300 MT), were offset by reductions for Haiti (300 MT). Exports of 7,300 MT were to Mexico.
Rice: Net sales of 12,800 MT for 2022/2023 were primarily for Iraq (4,000 MT), Mexico (3,700 MT), Canada (3,300 MT), Saudi Arabia (1,300 MT), and Japan (200 MT). Exports of 52,800 MT were primarily to Iraq (44,000 MT), Mexico (3,700 MT), Canada (3,700 MT), Taiwan (700 MT), and Saudi Arbia (400 MT).
Soybeans: Net sales of 724,400 MT for 2022/2023 primarily for China (622,300 MT, including 251,000 MT switched from unknown destinations and decreases of 67,500 MT), South Korea (51,600 MT, including 53,000 MT switched from unknown destinations and decreases of 1,600 MT), Portugal (28,200 MT, including 21,500 MT switched from unknown destinations and decreases of 800 MT), Japan (14,900 MT, including 9,600 MT switched from unknown destinations and decreases of 100 MT), and Thailand (12,300 MT), were offset by reductions for unknown destinations (63,400 MT) and Colombia (2,500 MT). Exports of 888,000 MT were primarily to China (607,100 MT), Mexico (92,400 MT), Egypt (60,500 MT), South Korea (51,400 MT), and Portugal (20,700 MT).
Optional Origin Sales: For 2021/2022, the current outstanding balance of 300 MT, all South Korea.
Export for Own Account: For 2022/2023, the current exports for own account outstanding balance is 6,300 MT, all Canada.
Soybean Cake and Meal: Net sales for the 2022/2023 marketing year, which began October 1, totaled 491,900 MT primarily for the Philippines (100,000 MT), Ecuador (91,000 MT), Japan (53,800 MT), Canada (48,700 MT), and Vietnam (45,000 MT), were offset by reductions for Morocco (1,100 MT). Net sales of 280,300 MT was carried over from the 2021/2022 marketing year, which ended September 30. Exports for the period ending September 30 were primarily to Mexico (28,500 MT), Sri Lanka (1,200 MT), Canada (900 MT), Burma (700 MT), and Taiwan (500 MT). Exports for the period ending October 1 of 110,900 MT brought accumulated exports to 11,701,100 MT, up 38 percent from the prior year’s total of 301,000 MT. The primary destinations were to the Philippines (52,500 MT), Mexico (27,200 MT), Canada (15,900 MT), and Morocco (14,900 MT).
Soybean Oil: Net sales for the 2022/2023 marketing year, which began October 1, totaled 3,300 MT for Canada (3,700 MT), were offset by reduction for Mexico (400 MT). Total net sales of 10,200 MT was carried over from the 2020/2021 marketing year, which ended September 30. Exports for the period ending September 30 were to Canada (1,600 MT). Exports for the period ending October 1 of 200 MT brought accumulated exports to 678,400 MT, up noticeably from the prior year’s total of 500 MT, with Canada being the destination.
Cotton: Net sales of 144,800 RB for 2022/2023 were primarily for Pakistan (55,300 RB, including decreases of 900 RB), Bangladesh (31,700 RB), China (14,400 RB), Vietnam (13,700 RB, including 200 RB switched from Japan), and Turkey (6,400 RB, including decreases of 500 RB). Total net sales of 34,800 RB for 2023/2024 were reported for Mexico (21,000 RB), Pakistan (6,600 RB), Guatemala (6,300 RB), and Turkey (900 RB). Exports of 168,100 RB were primarily to China (39,700 RB), Vietnam (26,700 RB), Pakistan (25,500 RB), Mexico (20,300 RB), and Bangladesh (19,000 RB). Net sales reductions of Pima totaling 2,000 RB resulted in increases for Italy (1,000 RB), were more than offset by reductions for India (3,000 RB). Exports of 800 RB were to China (700 RB) and Italy (100 RB).
Optional Origin Sales: For 2022/2023, options were exercised to export 1,000 RB to Pakistan from the United States. The current outstanding balance of 9,300 RB is for Malaysia.
Export for Own Account: For 2022/2023, exports for own account totaling 10,600 RB to Turkey were applied to new or outstanding sales. The current exports for own account outstanding balance of 63,900 RB is for China (37,600 RB), Vietnam (23,900 RB), India (1,500 RB), Pakistan (500 RB), and Indonesia (400 RB).
Hides and Skins: Net sales of 362,100 pieces for 2022 primarily for China (275,700 whole cattle hides, including decreases of 69,700 pieces), Mexico (44,100 whole cattle hides, including decreases of 500 pieces), South Korea (25,700 whole cattle hides, including decreases of 9,700 pieces), Indonesia (5,100 whole cattle hides), and Brazil (4,500 whole cattle hides), were offset by reductions primarily for Canada (600 pieces). Exports of 321,100 whole cattle hides exports were primarily to China (210,500 pieces), Mexico (37,500 pieces), South Korea (33,700 pieces), Thailand (12,700 pieces), and Brazil (12,400 pieces).
Net sales of 88,900 wet blues for 2022 were primarily for Italy (49,400 unsplit, including decreases of 200 unsplit and 200 grain splits), Vietnam (29,500 unsplit), and China (9,900 unsplit, including decreases of 200 unsplit). Total net sales reductions of 2,000 wet blues for 2023 were for China. Exports of 166,800 wet blues were primarily to China (54,200 unsplit), Vietnam (45,900 unsplit), Thailand (34,900 unsplit), Italy (23,600 unsplit), and Mexico (2,600 unsplit). No net sales of splits were reported for the week. Exports of 76,600 pounds were to Vietnam (40,000 pounds) and China (36,600 pounds).
Beef: Net sales of 13,200 MT for 2022 primarily for Japan (5,300 MT, including decreases of 300 MT), South Korea (2,900 MT, including decreases of 700 MT), Mexico (2,300 MT), Canada (800 MT), and Taiwan (800 MT, including decreases of 100 MT), were offset by reductions for China (300 MT), the Netherlands (100 MT), and Vietnam (100 MT). Net sales of 1,600 MT for 2023 were primarily for Indonesia (700 MT) and Japan (700 MT). Exports of 16,500 MT were primarily to Japan (5,400 MT), South Korea (3,700 MT), China (2,300 MT), Mexico (1,200 MT), and Canada (1,000 MT).
Pork: Net sales of 29,900 MT for 2022 were primarily for Mexico (8,100 MT, including decreases of 200 MT), China (5,900 MT, including decreases of 100 MT), Japan (5,300 MT), South Korea (4,000 MT, including decreases of 200 MT), and the Dominican Republic (1,500 MT). Exports of 28,500 MT were primarily to Mexico (12,100 MT), China (5,800 MT), Japan (3,500 MT), South Korea (1,800 MT), and Canada (1,500 MT).
Terry Reilly
Senior Commodity Analyst – Grain and Oilseeds
Futures International
One Lincoln Center
18 W 140 Butterfield Rd.
Oakbrook Terrace, Il. 60181
W: 312.604.1366
ICE IM: treilly1
Skype: fi.treilly

Trading of futures, options, swaps and other derivatives is risky and is not suitable for all persons. All of these investment products are leveraged, and you can lose more than your initial deposit. Each investment product is offered only to and from jurisdictions where solicitation and sale are lawful, and in accordance with applicable laws and regulations in such jurisdiction. The information provided here should not be relied upon as a substitute for independent research before making your investment decisions. Futures International, LLC is merely providing this information for your general information and the information does not take into account any particular individual’s investment objectives, financial situation, or needs. All investors should obtain advice based on their unique situation before making any investment decision. The contents of this communication and any attachments are for informational purposes only and under no circumstances should they be construed as an offer to buy or sell, or a solicitation to buy or sell any future, option, swap or other derivative. The sources for the information and any opinions in this communication are believed to be reliable, but Futures International, LLC does not warrant or guarantee the accuracy of such information or opinions. Futures International, LLC and its principals and employees may take positions different from any positions described in this communication. Past results are not necessarily indicative of future results.