PDF attached
USDA export sales
Excellent soybean (2.336MMT) and meal sales (542,300MT), as expected. Soybean oil sales were 9,300 tons but an improvement from previous week. Corn sales were low at 408,300 tons, and well below average for this time of year, in part to US Midwest River logistical concerns and high USD. All-wheat was poor at 163,100 tons. Pork sales were good at 40,800 tons.
The soybean export sales of 2.336 million tons for 2022-23 were primarily for China (1,976,200 MT, including 436,000 MT switched from unknown destinations and decreases of213,700 MT). Europe was also active with Netherlands, Spain, UK, and Italy.
The soybean meal sales of 542,300 tons were primarily for the Philippines (190,200 MT, including decreases of 45,000 MT), unknown destinations (88,000MT), Denmark (45,000 MT), Ecuador (40,000 MT), and Canada (39,200 MT).
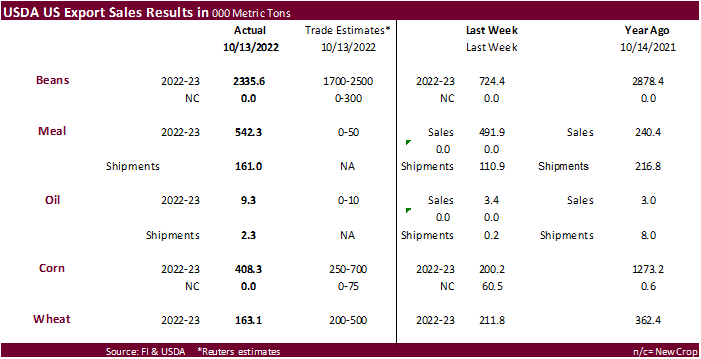
This summary is based on reports from exporters for the period October 7-13, 2022.
Wheat: Net sales of 163,100 metric tons (MT) for 2022/2023 primarily for Mexico (93,500 MT, including decreases of 900 MT), Nigeria (36,000 MT), Algeria (31,500 MT), Japan (27,200 MT), and Colombia (18,700 MT, including decreases of 4,300 MT), were offset by reductions primarily for Italy (60,000 MT), Panama (20,100 MT), and unknown destinations (10,500 MT). Total net sales of 22,000 MT for 2023/2024 were for Panama. Exports of 242,600 MT were primarily to Japan (61,600 MT), South Korea (36,300 MT), Ecuador (33,000 MT), Honduras (27,500 MT), and Panama (27,300 MT).
Corn: Net sales of 408,300 MT for 2022/2023 primarily for Mexico (183,700 MT, including decreases of 32,900 MT), Japan (77,600 MT, including 37,000 MT switched from unknown destinations), Honduras (47,900 MT, including 7,500 MT switched from Guatemala and decreases of 17,100 MT), Colombia (30,000 MT), and Panama (22,700 MT), were offset by reductions for Guatemala (7,000 MT). Exports of 407,200 MT were primarily to Mexico (163,300 MT), China (71,400 MT), Honduras (49,000 MT), Japan (37,000 MT), and Saudi Arabia (30,700 MT).
Barley: No net sales or exports were reported for the week.
Sorghum: Net sales of 11,900 MT for 2022/2023 reported for unknown destinations (10,700 MT) and Mexico (1,600 MT), were offset by reductions for China (400 MT). Exports of 5,700 MT were to Mexico.
Rice: Net sales of 11,200 MT for 2022/2023 were primarily for Colombia (10,400 MT), Canada (400 MT, including decreases of 200 MT), Mexico (200 MT), the Netherlands (100 MT), and Micronesia (100 MT). Exports of 7,100 MT were primarily to Canada (2,400 MT), Mexico (1,900 MT), Jordan (1,000 MT), the United Kingdom (900 MT), and Saudi Arabia (500 MT).
Soybeans: Net sales of 2,335,600 MT for 2022/2023 primarily for China (1,976,200 MT, including 436,000 MT switched from unknown destinations and decreases of 213,700 MT), the Netherlands (82,800 MT, including 77,000 MT switched from unknown destinations and decreases of 200 MT), Spain (58,800 MT switched from the United Kingdom), Italy (57,200 MT, including 57,000 MT switched from unknown destinations), and Algeria (43,400 MT, including decreases of 1,600 MT), were offset by reductions primarily for the United Kingdom (60,000 MT). Exports of 1,896,800 MT were primarily to China (1,400,700 MT), Mexico (97,800 MT), the Netherlands (82,800 MT), Spain (58,800 MT), and Italy (57,200 MT).
Optional Origin Sales: For 2022/2023, the current outstanding balance of 300 MT, all South Korea.
Export for Own Account: For 2022/2023, the current exports for own account outstanding balance is 6,300 MT, all Canada.
Export Adjustment: Accumulated exports of soybeans to unknown destinations were adjusted down 43,417 MT for week ending September 29th. The correct destination for this shipment is Algeria.
Soybean Cake and Meal: Net sales of 542,300 MT for 2022/2023 primarily for the Philippines (190,200 MT, including decreases of 45,000 MT), unknown destinations (88,000 MT), Denmark (45,000 MT), Ecuador (40,000 MT), and Canada (39,200 MT, including decreases of 400 MT), were offset by reductions for Belgium (1,400 MT) and Japan (100 MT). Exports of 161,000 MT were primarily to the Philippines (47,500 MT), Ireland (22,300 MT), Mexico (17,900 MT), Panama (17,500 MT), and Canada (15,600 MT).
Soybean Oil: Net sales of 9,300 MT for 2022/2023 were for Canada, including decreases of 600 MT. Total net sales of 400 MT for 2023/2024 were for Canada. Exports of 2,300 MT were primarily to Canada (1,700 MT) and Mexico (400 MT).
Cotton: Net sales of 84,500 RB for 2022/2023 primarily for Pakistan (27,600 RB), Egypt (22,000 RB), China (10,100 RB), Mexico (6,900 RB), and El Salvador (5,300 RB), were offset by reductions for Indonesia (2,500 RB) and Costa Rica (300 RB). Net sales of 4,400 RB for 2023/2024 were reported for Portugal (2,200 RB) and Pakistan (2,200 RB). Exports of 165,700 RB were primarily to China (71,700 RB), Pakistan (24,800 RB), Turkey (19,200 RB), Mexico (14,600 RB), and Vietnam (9,000 RB). Net sales of Pima totaling 100 RB resulted in increases for China (100 RB) and Japan (100 RB), were offset by reductions for the United Kingdom (100 RB). Exports of 400 RB were to Turkey.
Optional Origin Sales: For 2022/2023, the current outstanding balance of 9,300 RB is for Malaysia.
Export for Own Account: For 2022/2023, the current exports for own account outstanding balance of 63,900 RB is for China (37,600 RB), Vietnam (23,900 RB), India (1,500 RB), Pakistan (500 RB), and Indonesia (400 RB).
Hides and Skins: Net sales of 920,400 pieces for 2022 primarily for China (395,200 whole cattle hides, including decreases of 33,200 pieces), Mexico (362,100 whole cattle hides, including decreases of 5,200 pieces and 297,400 whole cattle hides – late), South Korea (51,200 whole cattle hides, including decreases of 7,600 pieces), Thailand (27,500 whole cattle hides, including decreases of 2,100 pieces), and Turkey (23,600 whole cattle hides, including decreases of 100 pieces), were offset by reductions for Italy (100 pieces) and Germany (100 pieces). Total net sales of 3,300 calf skins were for Italy, including decreases of 1,400 calf skins. In addition, net sales of 3,500 kip skins reported for Belgium (2,900 kip skins) and Canada (1,300 kip skins, including decreases of 1,600 kip skins), were offset by reductions for Italy (400 kip skins) and China (300 kip skins). Exports of 472,900 whole cattle hides exports were primarily to China (288,400 pieces), Mexico (44,700 pieces), South Korea (36,500 pieces), Thailand (32,100 pieces), and Brazil (25,100 pieces). Exports of 1,800 calf skins were to Italy. In addition, exports of 3,100 kip skins were to China (1,800 kip skins) and Canada (1,300 kip skins).
Net sales of 174,200 wet blues for 2022 were primarily for Italy (102,800 unsplit and 100 grain splits, including decreases of 2,100 unsplit), Thailand (35,600 unsplit), Vietnam (9,500 unsplit), China (7,900 unsplit), and the Dominican Republic (7,200 unsplit, including decreases of 800 unsplit). Net sales reductions of 500 wet blues for 2023 primarily for the Dominican Republic (800 unsplit), were more than offset by reductions for Mexico (2,000 unsplit). Exports of 116,200 wet blues were primarily to Italy (23,600 unsplit and 4,400 grain splits), Thailand (25,000 unsplit), China (23,600 unsplit), Vietnam (16,000 unsplit), and Taiwan (11,000 unsplit). Net sales of 396,700 splits were reported for Vietnam (352,700 pounds) and China (44,000 pounds). Exports of 42,300 pounds were to Vietnam.
Late Reporting: For 2022, net sales totaling 297,400 pieces of whole cattle hides were reported late for Mexico.
Beef: Net sales of 16,600 MT for 2022 primarily for South Korea (7,100 MT, including decreases of 600 MT), Japan (3,600 MT, including decreases of 300 MT), China (2,000 MT, including decreases of 100 MT), Mexico (1,600 MT, including decreases of 100 MT), and Canada (800 MT, including decreases of 100 MT), were offset by reductions for Colombia (100 MT). Net sales of 2,800 MT for 2023 were primarily for Japan (1,600 MT). Exports of 17,600 MT were primarily to South Korea (4,400 MT), Japan (4,000 MT), China (3,900 MT), Mexico (1,400 MT), and Canada (1,000 MT).
Pork: Net sales of 40,800 MT for 2022 were primarily for Mexico (14,800 MT, including decreases of 300 MT), Japan (11,000 MT, including decreases of 200 MT), Australia (3,500 MT), Canada (3,100 MT, including decreases of 400 MT), and China (3,000 MT, including decreases of 100 MT). Exports of 28,400 MT were primarily to Mexico (13,700 MT), China (4,100 MT), Canada (2,100 MT), Japan (2,100 MT), and South Korea (2,000 MT).
U.S. EXPORT SALES FOR WEEK ENDING 10/13/2022
|
|
CURRENT MARKETING YEAR |
NEXT MARKETING YEAR |
||||||
|
COMMODITY |
NET SALES |
OUTSTANDING SALES |
WEEKLY EXPORTS |
ACCUMULATED EXPORTS |
NET SALES |
OUTSTANDING SALES |
||
|
CURRENT YEAR |
YEAR AGO |
CURRENT YEAR |
YEAR AGO |
|||||
|
|
THOUSAND METRIC TONS |
|||||||
|
WHEAT |
|
|
|
|
|
|
|
|
|
HRW |
58.0 |
703.7 |
1,640.9 |
79.0 |
2,496.2 |
3,167.2 |
4.6 |
6.3 |
|
SRW |
13.6 |
454.1 |
639.2 |
79.2 |
1,627.6 |
1,207.4 |
6.6 |
6.6 |
|
HRS |
105.7 |
908.7 |
1,000.9 |
61.0 |
2,418.0 |
2,336.8 |
10.8 |
10.8 |
|
WHITE |
14.3 |
601.7 |
642.8 |
23.4 |
1,940.9 |
1,598.8 |
0.0 |
0.3 |
|
DURUM |
-28.5 |
61.8 |
42.4 |
0.0 |
77.5 |
61.4 |
0.0 |
0.0 |
|
TOTAL |
163.1 |
2,730.0 |
3,966.2 |
242.6 |
8,560.2 |
8,371.7 |
22.0 |
24.0 |
|
BARLEY |
0.0 |
11.6 |
23.7 |
0.0 |
3.9 |
6.4 |
0.0 |
0.0 |
|
CORN |
408.3 |
10,754.6 |
24,437.8 |
407.2 |
3,076.6 |
4,456.4 |
0.0 |
311.0 |
|
SORGHUM |
11.9 |
277.3 |
2,355.2 |
5.7 |
33.4 |
263.6 |
0.0 |
0.0 |
|
SOYBEANS |
2,335.6 |
25,950.9 |
23,431.6 |
1,896.8 |
4,573.1 |
5,638.5 |
0.0 |
0.0 |
|
SOY MEAL |
542.3 |
3,358.8 |
3,777.0 |
161.0 |
271.9 |
517.8 |
0.0 |
1.4 |
|
SOY OIL |
9.3 |
26.8 |
99.5 |
2.3 |
2.5 |
8.5 |
0.4 |
0.6 |
|
RICE |
|
|
|
|
|
|
|
|
|
L G RGH |
10.4 |
73.0 |
285.7 |
0.2 |
73.3 |
238.1 |
0.0 |
0.0 |
|
M S RGH |
0.0 |
12.2 |
7.3 |
1.3 |
5.9 |
1.9 |
0.0 |
0.0 |
|
L G BRN |
0.0 |
5.9 |
9.1 |
0.3 |
3.7 |
15.5 |
0.0 |
0.0 |
|
M&S BR |
0.0 |
5.3 |
54.3 |
0.0 |
2.2 |
14.2 |
0.0 |
0.0 |
|
L G MLD |
0.0 |
97.5 |
77.4 |
3.6 |
138.3 |
204.3 |
0.0 |
0.0 |
|
M S MLD |
0.8 |
35.3 |
69.6 |
1.6 |
70.6 |
75.4 |
0.0 |
0.0 |
|
TOTAL |
11.2 |
229.2 |
503.3 |
7.1 |
294.1 |
549.4 |
0.0 |
0.0 |
|
COTTON |
|
THOUSAND RUNNING BALES |
||||||
|
UPLAND |
84.5 |
6,000.6 |
6,155.7 |
165.7 |
2,369.3 |
1,853.2 |
4.4 |
1,082.9 |
|
PIMA |
0.1 |
84.9 |
184.7 |
0.4 |
18.6 |
74.4 |
0.0 |
0.9 |
Terry Reilly
Senior Commodity Analyst – Grain and Oilseeds
Futures International
One Lincoln Center
18 W 140 Butterfield Rd.
Oakbrook Terrace, Il. 60181
W: 312.604.1366
ICE IM: treilly1
Skype: fi.treilly

Trading of futures, options, swaps and other derivatives is risky and is not suitable for all persons. All of these investment products are leveraged, and you can lose more than your initial deposit. Each investment product is offered only to and from jurisdictions where solicitation and sale are lawful, and in accordance with applicable laws and regulations in such jurisdiction. The information provided here should not be relied upon as a substitute for independent research before making your investment decisions. Futures International, LLC is merely providing this information for your general information and the information does not take into account any particular individual’s investment objectives, financial situation, or needs. All investors should obtain advice based on their unique situation before making any investment decision. The contents of this communication and any attachments are for informational purposes only and under no circumstances should they be construed as an offer to buy or sell, or a solicitation to buy or sell any future, option, swap or other derivative. The sources for the information and any opinions in this communication are believed to be reliable, but Futures International, LLC does not warrant or guarantee the accuracy of such information or opinions. Futures International, LLC and its principals and employees may take positions different from any positions described in this communication. Past results are not necessarily indicative of future results.