PDF attached
USDA Export Sales
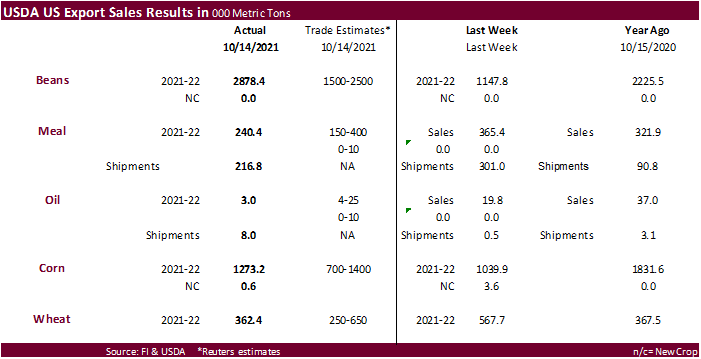
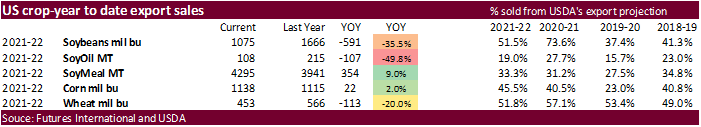
Soybean export sales were excellent at 2.878 million tons and included China (1,884,400 MT, although 526,000 MT switched from unknown destinations and decreases of 6,300 MT, good amount for unknown destinations (568,800MT) and the Netherlands (127,300 MT – including 124,000 MT switched from unknown destinations). Soybean commitments are still running sharply below a year ago, by 36 percent. Soybean oil export sales were a low 3,000 tons but shipments improved to 8,000 tons. Canada bought 100 tons of new-crop soybean oil. Soybean meal export sales were 240,400 tons, within expectations while shipments were 216,800 tons, down from 301,000 previous week. Corn export sales were within expectations at 1.273 million tons and included unknown destinations (456,700 MT) and Mexico (377,100 MT). There were no corn sales to China. All-wheat export sales of 362,400 tons were within expectations but down from 567,700 tons previous week. USDA reported 262,500 tons of sorghum sales, including 127,300 tons to China and 103,000 tons to unknown. Pork sales were good at 20,900 tons.
U.S. EXPORT SALES FOR WEEK ENDING 10/14/21
|
|
CURRENT MARKETING YEAR |
NEXT MARKETING YEAR |
||||||
|
COMMODITY |
NET SALES |
OUTSTANDING SALES |
WEEKLY EXPORTS |
ACCUMULATED EXPORTS |
NET SALES |
OUTSTANDING SALES |
||
|
CURRENT YEAR |
YEAR AGO |
CURRENT YEAR |
YEAR AGO |
|||||
|
|
THOUSAND METRIC TONS |
|||||||
|
WHEAT |
|
|
|
|
|
|
|
|
|
HRW |
206.5 |
1,640.9 |
1,643.2 |
111.9 |
3,167.3 |
4,144.4 |
0.0 |
0.0 |
|
SRW |
50.9 |
639.2 |
403.9 |
21.0 |
1,207.4 |
879.4 |
0.0 |
0.0 |
|
HRS |
62.2 |
1,000.9 |
1,507.0 |
16.6 |
2,336.8 |
2,904.7 |
0.0 |
0.0 |
|
WHITE |
60.9 |
642.8 |
1,452.2 |
10.6 |
1,598.8 |
1,939.5 |
0.0 |
0.0 |
|
DURUM |
-18.1 |
42.4 |
220.9 |
0.0 |
61.4 |
321.6 |
0.0 |
0.0 |
|
TOTAL |
362.4 |
3,966.2 |
5,227.2 |
160.2 |
8,371.8 |
10,189.5 |
0.0 |
0.0 |
|
BARLEY |
0.0 |
23.7 |
32.9 |
0.7 |
6.4 |
9.1 |
0.0 |
0.0 |
|
CORN |
1,273.1 |
24,437.8 |
22,943.7 |
1,041.7 |
4,456.4 |
5,390.9 |
0.5 |
337.4 |
|
SORGHUM |
262.5 |
2,355.2 |
2,752.5 |
37.8 |
263.6 |
463.5 |
0.0 |
0.0 |
|
SOYBEANS |
2,878.4 |
23,431.6 |
33,926.3 |
2,207.3 |
5,836.5 |
11,423.2 |
0.0 |
19.8 |
|
SOY MEAL |
240.4 |
3,777.0 |
3,593.0 |
216.8 |
517.8 |
348.1 |
6.1 |
36.6 |
|
SOY OIL |
3.0 |
99.5 |
193.7 |
8.0 |
8.5 |
21.5 |
0.1 |
0.1 |
|
RICE |
|
|
|
|
|
|
|
|
|
L G RGH |
67.4 |
285.7 |
525.2 |
2.2 |
238.1 |
125.6 |
0.0 |
0.0 |
|
M S RGH |
0.0 |
7.3 |
21.3 |
0.2 |
1.9 |
7.6 |
0.0 |
0.0 |
|
L G BRN |
5.8 |
9.1 |
12.0 |
0.5 |
15.5 |
9.4 |
0.0 |
0.0 |
|
M&S BR |
0.1 |
54.3 |
20.6 |
0.1 |
14.2 |
27.9 |
0.0 |
0.0 |
|
L G MLD |
3.9 |
77.4 |
47.8 |
62.2 |
204.3 |
88.5 |
0.0 |
0.0 |
|
M S MLD |
4.4 |
69.6 |
113.5 |
2.9 |
75.4 |
80.0 |
0.0 |
0.0 |
|
TOTAL |
81.4 |
503.3 |
740.4 |
68.1 |
549.4 |
339.0 |
0.0 |
0.0 |
|
COTTON |
|
THOUSAND RUNNING BALES |
||||||
|
UPLAND |
391.8 |
6,155.7 |
5,761.9 |
117.4 |
1,853.2 |
2,699.1 |
63.9 |
816.3 |
|
PIMA |
23.9 |
184.7 |
254.6 |
5.4 |
74.4 |
123.2 |
0.0 |
0.0 |
This summary is based on reports from exporters for the period October 8-14, 2021.
Wheat: Net sales of 362,400 metric tons (MT) for 2021/2022 were down 36 percent from the previous week and 6 percent from the prior 4-week average. Increases primarily for Nigeria (98,000 MT), Japan (92,100 MT), Colombia (76,100 MT, including 31,000 MT switched from unknown destinations), Thailand (52,200 MT), and Venezuela (33,000 MT, including 30,000 MT switched from unknown destinations), were offset by reductions for unknown destinations (36,100 MT). Exports of 160,200 MT were down 65 percent from the previous week and 66 percent from the prior 4-week average. The destinations were primarily to Mexico (41,700 MT), Venezuela (33,000 MT), Colombia (32,100 MT), South Korea (30,300 MT), and Taiwan (17,600 MT).
Corn: Net sales of 1,273,100 MT for 2021/2022 were up 22 percent from the previous week and 67 percent from the prior 4-week average. Increases primarily for unknown destinations (456,700 MT), Mexico (377,100 MT, including decreases of 39,300 MT), Japan (230,100 MT, including 114,400 MT switched from unknown destinations, decreases of 62,000 MT, and 55,000 MT – late), Colombia (111,500 MT, including 59,000 MT switched from unknown destinations and decreases of 31,500 MT), and Nicaragua (76,000 MT), were offset by reductions for Guatemala (15,300 MT). Total net sales of 500 MT for 2022/2023 were for Canada. Exports of 1,041,700 MT were up 14 percent from the previous week and 36 percent from the prior 4-week average. The destinations were primarily to Mexico (447,500 MT), Japan (176,200 MT), China (143,100 MT), Colombia (93,600 MT), and Guatemala (65,100 MT).
Optional Origin Sales: For 2021/2022, new optional origin sales of 89,800 MT were reported for South Korea (65,000 MT) and Italy (24,800 MT). Decreases totaling 50,000 MT were reported for unknown destinations. The current outstanding balance of 339,800 MT is for unknown destinations (250,000 MT), South Korea (65,000 MT), and Italy (24,800 MT).
Late Reporting: For 2021/2022, net sales totaling 55,000 MT of corn were reported late for Japan.
Barley: No net sales were reported for the week. Exports of 700 MT were unchanged from the previous week, but up noticeably from the prior 4-week average. The destination was to Japan.
Sorghum: Net sales of 262,500 MT for 2021/2022 were up noticeably from the previous week and from the prior 4-week average. Increases were reported for China (127,300 MT), unknown destinations (103,000 MT), and Eritrea (32,200 MT, including 30,000 MT switched from unknown destinations). Exports of 37,800 MT were down 39 percent from the previous week and 32 percent from the prior 4-week average. The destinations were primarily to Eritrea (32,200 MT) and China (3,100 MT).
Rice: Net sales of 81,400 MT for 2021/2022–a marketing-year high–were up noticeably from the previous week and up 54 percent from the prior 4-week average. Increases primarily for Mexico (47,800 MT), Honduras (17,100 MT), El Salvador (9,000 MT), Jordan (3,700 MT), and Canada (2,600 MT), were offset by reductions primarily for Iraq (7,100 MT). Exports of 68,100 MT were up noticeably from the previous week and up 79 percent from the prior 4-week average. The destinations were primarily to Iraq (32,900 MT), Haiti (25,600 MT), Canada (4,000 MT), Mexico (3,100 MT), and Jordan (1,000 MT).
Exports for Own Account: For 2021/2022, the current exports for own account outstanding balance is 100 MT, all Canada.
Soybeans: Net sales of 2,878,400 MT for 2021/2022 were up noticeably from the previous week and from the prior 4-week average. Increases were primarily for China (1,884,400 MT, including 526,000 MT switched from unknown destinations, decreases of 6,300 MT, and 54,000 MT – late), unknown destinations (568,800 MT), the Netherlands (127,300 MT, including 124,000 MT switched from unknown destinations and decreases of 2,700 MT), Egypt (97,300 MT), and Bangladesh (57,800 MT, including 55,000 MT switched from unknown destinations). Exports of 2,207,300 MT were up 29 percent from the previous week and up noticeably from the prior 4-week average. The destinations were primarily to China (1,659,500 MT), the Netherlands (127,300 MT), Mexico (97,500 MT), Turkey (66,000 MT), and Japan (63,900 MT).
Export for Own Account: For 2021/2022, the current exports for own account outstanding balance is 5,800 MT, all Canada.
Late Reporting: For 2021/2022, net sales totaling 54,000 MT of soybeans were reported late for China.
Soybean Cake and Meal: Net sales of 240,400 MT for 2021/2022 primarily for Ecuador (64,900 MT, including decreases of 100 MT), Canada (49,800 MT, including decreases of 2,000 MT), Denmark (45,000 MT), Colombia (35,100 MT, including 9,200 MT switched from unknown destinations and decreases of 200 MT), and Nicaragua (18,000 MT), were offset by reductions primarily for Mexico (6,900 MT), Spain (6,000 MT), and Guatemala (4,600 MT). For 2022/2023, net sales of 6,100 MT were reported for Japan (3,600 MT) and the Netherlands (2,500 MT). Exports of 216,800 MT were primarily to the Philippines (48,700 MT), Colombia (47,300 MT), Guatemala (34,000 MT), Mexico (23,500 MT), and Canada (17,200 MT).
Soybean Oil: Net sales of 3,000 MT for 2021/2022 were reported for Mexico (2,200 MT) and the Dominican Republic (800 MT). Total net sales of 100 MT for 2022/2023 were for Canada. Exports of 8,000 MT were to Guatemala (7,500 MT), Mexico (400 MT), and Canada (100 MT).
Cotton: Net sales of 391,800 RB for 2021/2022 were up noticeably from the previous week and up 20 percent from the prior 4-week average. Increases were primarily for China (272,800 RB, including decreases of 100 RB), Turkey (76,900 RB), Vietnam (15,800 RB, including 300 RB switched from Japan), Mexico (6,200 RB), and Bangladesh (5,000 RB, including decreases of 100 RB). Net sales of 63,900 RB for 2022/2023 were primarily for China (50,000 RB) and Turkey (13,200 RB). Exports of 117,400 RB were up 23 percent from the previous week, but down 16 percent from the prior 4-week average. The destinations were primarily to China (46,400 RB), Mexico (18,700 RB), Turkey (11,900 RB), Pakistan (9,600 RB), and Bangladesh (8,500 RB). Net sales of Pima totaling 23,900 RB–a marketing-year high–were up noticeably from the previous week and up 58 percent from the prior 4-week average. Increases were primarily for India (17,000 RB), Peru (2,800 RB, including decreases of 300 RB), and China (1,800 RB). Exports of 5,400 RB were down 49 percent from the previous week and 28 percent from the prior 4-week average. The destinations were primarily to India (4,500 RB), Austria (500 RB), and Peru (200 RB).
Optional Origin Sales: For 2021/2022, the current outstanding balance of 8,800 RB is for Pakistan.
Exports for Own Account: For 2021/2022, the current exports for own account outstanding balance of 4,800 RB is for China (4,700 RB) and Vietnam (100 RB).
Hides and Skins: Net sales of 415,700 pieces for 2021 were up 62 percent from the previous week and 13 percent from the prior 4-week average. Increases primarily for China (277,700 whole cattle hides, including decreases of 7,900 pieces), South Korea (63,000 whole cattle hides, including decreases of 1,000 pieces), Thailand (23,700 whole cattle hides, including decreases of 1,000 pieces), Mexico (20,200 whole cattle hides, including decreases of 100 pieces), and Cambodia (10,600 whole cattle hides), were offset by reductions for Taiwan (1,000 pieces). Exports of 472,100 pieces were up 37 percent from the previous week and 35 percent from the prior 4-week average. Whole cattle hide exports were primarily to China (299,000 pieces), South Korea (53,500 pieces), Thailand (37,300 pieces), Mexico (33,600 pieces), and Taiwan (20,600 pieces).
Net sales of 150,500 wet blues for 2021 were up noticeably from the previous week and up 22 percent from the prior 4-week average. Increases primarily for China (136,200 unsplit, including decreases of 100 unsplit), Mexico (8,400 grain splits, including decreases of 400 grain splits), and Italy (7,300 unsplit and 100 grain splits, including decreases of 13,100 unsplit), were offset by reductions for Vietnam (1,300 unsplit), Thailand (200 unsplit), and South Korea (100 grain splits). Net sales of 52,100 wet blues for 2022 were reported for Italy (28,100 unsplit) and Vietnam (24,000 unsplit). Exports of 227,900 wet blues were up 75 percent from the previous week and 72 percent from the prior 4-week average. The destinations were primarily to Italy (88,700 unsplit and 12,500 grain splits), China (77,700 unsplit), Vietnam (16,000 unsplit), Thailand (13,400 unsplit), and South Korea (7,000 grain splits and 1,600 unsplit). Total net sales of 48,200 splits were reported for China, including decreases of 4,400 splits. Exports of 335,200 pounds were to China (255,200 pounds) and Vietnam (80,000 pounds).
Beef: Net sales of 7,800 MT reported for 2021–a marketing-year low–were down 50 percent from the previous week and 51 percent from the prior 4-week average. Increases were primarily for Japan (2,300 MT, including decreases of 300 MT), China (1,600 MT, including decreases of 200 MT), South Korea (1,100 MT, including decreases of 400 MT), Taiwan (1,100 MT, including decreases of 100 MT), and Mexico (300 MT, including decreases of 200 MT). Net sales reductions of 200 MT for 2022 resulting in increases primarily for Chile (200 MT) and Indonesia (100 MT), were more than offset by reductions for South Korea (500 MT). Exports of 17,100 MT were up 10 percent from the previous week, but unchanged from the prior 4-week average. The destinations were primarily to South Korea (5,400 MT), Japan (4,000 MT), China (3,000 MT), Mexico (1,400 MT), and Taiwan (1,100 MT).
Pork: Net sales of 20,900 MT reported for 2021 were down 38 percent from the previous week and 36 percent from the prior 4-week average. Increases primarily for Mexico (10,200 MT, including decreases of 500 MT), South Korea (3,700 MT, including decreases of 300 MT), Japan (3,200 MT, including decreases of 200 MT), Colombia (800 MT, including decreases of 300 MT), and the Dominican Republic (800 MT), were offset by reductions for Bahamas (200 MT) and New Zealand (100 MT). Net sales of 1,400 MT for 2022 were primarily for Chile (1,300 MT). Exports of 32,800 MT were up 11 percent from the previous week and 5 percent from the prior 4-week average. The destinations were primarily to Mexico (15,000 MT), Japan (4,400 MT), China (4,100 MT), Colombia (2,700 MT), and Canada (1,800 MT).
Terry Reilly
Senior Commodity Analyst – Grain and Oilseeds
Futures International
One Lincoln Center
18 W 140 Butterfield Rd.
Oakbrook Terrace, Il. 60181
W: 312.604.1366
ICE IM: treilly1
Skype: fi.treilly

Trading of futures, options, swaps and other derivatives is risky and is not suitable for all persons. All of these investment products are leveraged, and you can lose more than your initial deposit. Each investment product is offered only to and from jurisdictions where solicitation and sale are lawful, and in accordance with applicable laws and regulations in such jurisdiction. The information provided here should not be relied upon as a substitute for independent research before making your investment decisions. Futures International, LLC is merely providing this information for your general information and the information does not take into account any particular individual’s investment objectives, financial situation, or needs. All investors should obtain advice based on their unique situation before making any investment decision. The contents of this communication and any attachments are for informational purposes only and under no circumstances should they be construed as an offer to buy or sell, or a solicitation to buy or sell any future, option, swap or other derivative. The sources for the information and any opinions in this communication are believed to be reliable, but Futures International, LLC does not warrant or guarantee the accuracy of such information or opinions. Futures International, LLC and its principals and employees may take positions different from any positions described in this communication. Past results are not necessarily indicative of future results.