PDF attached
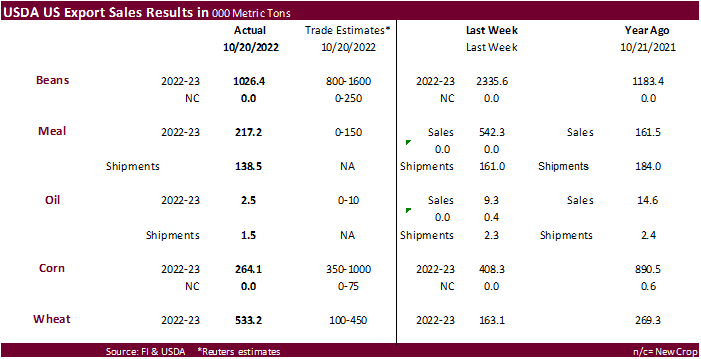
USDA export sales showed soybeans within expectations at 1.026 million tons, with China taking the bulk of that amount (1,115,600 MT, including 664,000 MT switched from unknown destinations and decreases of 10,000 MT). Soybean meal sales were better than expected and soybean oil low. Corn export sales were a poor 264,100 tons. All wheat improved to a good 533,200 tons from 163,100 tons previous week. Given US wheat prices are above the world market, we are little surprised US wheat export sales were good. HRS sales were 193,800 tons and white 209,800 tons. Pork sales were 20,300 tons.
U.S. EXPORT SALES FOR WEEK ENDING 10/20/2022
|
|
CURRENT MARKETING YEAR |
NEXT MARKETING YEAR |
||||||
|
COMMODITY |
NET SALES |
OUTSTANDING SALES |
WEEKLY EXPORTS |
ACCUMULATED EXPORTS |
NET SALES |
OUTSTANDING SALES |
||
|
CURRENT YEAR |
YEAR AGO |
CURRENT YEAR |
YEAR AGO |
|||||
|
|
THOUSAND METRIC TONS |
|||||||
|
WHEAT |
|
|
|
|
|
|
|
|
|
HRW |
67.2 |
729.1 |
1,743.8 |
41.9 |
2,538.1 |
3,210.3 |
0.0 |
6.3 |
|
SRW |
62.4 |
495.3 |
572.7 |
21.2 |
1,648.8 |
1,281.4 |
0.0 |
6.6 |
|
HRS |
193.8 |
1,051.1 |
998.2 |
51.3 |
2,469.3 |
2,381.7 |
0.0 |
10.8 |
|
WHITE |
209.8 |
789.1 |
662.7 |
22.4 |
1,963.3 |
1,606.6 |
0.0 |
0.3 |
|
DURUM |
0.0 |
61.8 |
72.4 |
0.0 |
77.5 |
77.3 |
0.0 |
0.0 |
|
TOTAL |
533.2 |
3,126.4 |
4,049.9 |
136.8 |
8,697.0 |
8,557.2 |
0.0 |
24.0 |
|
BARLEY |
0.0 |
11.6 |
22.9 |
0.0 |
3.9 |
7.2 |
0.0 |
0.0 |
|
CORN |
264.0 |
10,399.7 |
24,639.7 |
619.0 |
3,695.5 |
5,144.9 |
0.0 |
311.0 |
|
SORGHUM |
1.0 |
276.9 |
2,486.1 |
1.5 |
34.9 |
265.7 |
0.0 |
0.0 |
|
SOYBEANS |
1,026.4 |
24,228.7 |
22,209.2 |
2,748.6 |
7,321.7 |
7,930.8 |
0.0 |
0.0 |
|
SOY MEAL |
217.2 |
3,437.5 |
3,754.4 |
138.5 |
410.4 |
701.8 |
0.2 |
1.6 |
|
SOY OIL |
2.5 |
27.9 |
111.7 |
1.5 |
4.0 |
10.9 |
0.0 |
0.6 |
|
RICE |
|
|
|
|
|
|
|
|
|
L G RGH |
36.8 |
85.0 |
240.8 |
24.8 |
98.2 |
285.4 |
0.0 |
0.0 |
|
M S RGH |
0.0 |
11.4 |
7.0 |
0.8 |
6.7 |
2.2 |
0.0 |
0.0 |
|
L G BRN |
0.2 |
6.0 |
8.5 |
0.2 |
3.9 |
16.2 |
0.0 |
0.0 |
|
M&S BR |
0.0 |
4.7 |
54.3 |
0.6 |
2.8 |
14.3 |
0.0 |
0.0 |
|
L G MLD |
1.3 |
96.2 |
86.3 |
2.6 |
140.9 |
216.0 |
0.0 |
0.0 |
|
M S MLD |
1.1 |
32.5 |
69.0 |
3.9 |
74.5 |
77.9 |
0.0 |
0.0 |
|
TOTAL |
39.5 |
235.8 |
466.0 |
32.9 |
327.0 |
611.9 |
0.0 |
0.0 |
|
COTTON |
|
THOUSAND RUNNING BALES |
||||||
|
UPLAND |
68.4 |
5,891.4 |
6,453.1 |
177.6 |
2,546.9 |
1,916.6 |
7.1 |
1,090.0 |
|
PIMA |
-0.7 |
82.5 |
191.0 |
1.7 |
20.2 |
76.6 |
0.0 |
0.9 |
This summary is based on reports from exporters for the period October 14-20, 2022.
Wheat: Net sales of 533,200 metric tons (MT) for 2022/2023 primarily for South Korea (109,500 MT), unknown destinations (91,000 MT), the Philippines (66,500 MT), Japan (54,100 MT), and Mexico (49,100 MT, including decreases of 16,300 MT), were offset by reductions for Italy (500 MT). Exports of 136,800 MT were primarily to Mexico (42,700 MT), Nigeria (23,800 MT), Jamaica (22,300 MT), Japan (22,200 MT), and Italy (13,000 MT).
Corn: Net sales of 264,000 MT for 2022/2023 primarily for China (157,800 MT, including 66,000 MT switched from unknown destinations), Mexico (109,700 MT, including decreases of 300 MT), Canada (28,400 MT), Japan (18,200 MT, including 14,700 MT switched from unknown destinations), and Trinidad and Tobago (11,000 MT, including 4,000 MT switched from unknown destinations), were offset by reductions for unknown destinations (65,700 MT) and Colombia (14,000 MT). Exports of 619,000 MT were primarily to Mexico (316,400 MT), China (218,600 MT), Japan (55,600 MT), Jamaica (7,200 MT), and Canada (6,000 MT).
Barley: No net sales or exports were reported for the week.
Sorghum: Total net sales of 1,000 MT for 2022/2023 were for Mexico. Exports of 1,500 MT were primarily to Mexico (1,300 MT).
Rice: Net sales of 39,500 MT for 2022/2023 were primarily for Colombia (16,000 MT), Nicaragua (13,000 MT), El Salvador (5,600 MT), Guatemala (2,200 MT), and Canada (1,100 MT, including decreases of 100 MT). Exports of 32,900 MT were primarily to Nicaragua (23,900 MT), Mexico (3,100 MT), South Korea (2,900 MT), Canada (2,200 MT), and Taiwan (600 MT).
Soybeans: Net sales of 1,026,400 MT for 2022/2023 primarily for China (1,115,600 MT, including 664,000 MT switched from unknown destinations and decreases of 10,000 MT), Japan (119,300 MT, including 85,300 MT switched from unknown destinations and decreases of 300 MT), Pakistan (68,000 MT, including 66,000 MT switched from unknown destinations), Mexico (63,600 MT, including decreases of 7,000 MT), and Egypt (58,200 MT), were offset by reductions primarily for unknown destinations (487,000 MT). Exports of 2,748,600 MT were primarily to China (2,151,300 MT), Mexico (184,400 MT), Japan (153,500 MT), Pakistan (68,000 MT), and Algeria (45,000 MT).
Optional Origin Sales: For 2022/2023, the current outstanding balance of 300 MT, all South Korea.
Export for Own Account: For 2022/2023, new optional origin sales of 55,200 MT were reported for Canada. The current exports for own account outstanding balance is 61,500 MT, all Canada.
Soybean Cake and Meal: Net sales of 217,200 MT for 2022/2023 primarily for Mexico (99,900 MT), Canada (40,500 MT, including decreases of 400 MT), Venezula (25,000 MT), Colombia (18,000 MT), and Honduras (16,600 MT, including decreases of 28,000 MT), were offset by reductions for Morocco (2,500 MT), unknown destinations (2,400 MT), El Salvador (1,900 MT), Belgium (600 MT), and Nepal (500 MT). Total net sales of 200 MT for 2023/2024 were for Canada. Exports of 138,500 MT were primarily to Mexico (42,700 MT), Japan (33,800 MT), Canada (23,900 MT), Morocco (21,500 MT), and El Salvador (4,600 MT).
Soybean Oil: Net sales of 2,500 MT for 2022/2023 were for Canada. Exports of 1,500 MT were primarily to Canada (1,100 MT).
Cotton: Net sales of 68,400 RB for 2022/2023 primarily for Pakistan (53,200 RB, including decreases of 700 RB), Vietnam (36,200 RB, including 20,700 RB switched from China and 200 RB switched from South Korea), Taiwan (14,500 RB, including 8,800 RB switched from China), Turkey (9,500 RB, including decreases of 1,300 RB), and Ecuador (3,800 RB, including decreases of 100 RB), were offset by reductions primarily for China (49,900 RB) and Indonesia (8,000 RB). Net sales of 7,100 RB for 2023/2024 were reported for Pakistan (6,600 RB) and Japan (500 RB). Exports of 177,600 RB were primarily to China (85,000 RB), Mexico (21,200 RB), Pakistan (19,100 RB), Turkey (13,200 RB), and Vietnam (11,800 RB). Net sales reductions of Pima totaling 700 RB resulting in increases for Vietnam (900 RB), Bangladesh (100 RB), and Honduras (100 RB switched from Mexico), were more than offset by reductions for China (1,600 RB), India (100 RB), and Mexico (100 RB). Exports of 1,700 RB were primarily to Turkey (500 RB), India (300 RB), China (300 RB), South Korea (300 RB), and Pakistan (200 RB).
Optional Origin Sales: For 2022/2023, the current outstanding balance of 9,300 RB is for Malaysia.
Export for Own Account: For 2022/2023, the current exports for own account outstanding balance of 63,900 RB is for China (37,600 RB), Vietnam (23,900 RB), India (1,500 RB), Pakistan (500 RB), and Indonesia (400 RB).
Hides and Skins: Net sales of 401,800 pieces for 2022 primarily for China (279,700 whole cattle hides, including decreases of 7,100 pieces), South Korea (50,600 whole cattle hides, including decreases of 1,200 pieces), Thailand (38,600 whole cattle hides, including decreases of 3,400 pieces), Mexico (14,700 whole cattle hides, including decreases of 2,400 pieces), and Turkey (6,400 whole cattle hides, including decreases of 100 pieces), were offset by reductions for Vietnam (100 pieces). Net sales of 10,800 pieces for 2023 were reported for China (7,200 whole cattle hides) and Taiwan (3,600 whole cattle hides). Total net sales of 1,000 calf skins were for Italy. In addition, net sales reductions of 500 kip skins resulting in increases for Italy (400 kip skins), were more than offset by reductions for Belgium (700 kip skins) and Canada (200 kip skins). Exports of 345,600 whole cattle hides exports were primarily to China (212,900 pieces), South Korea (51,400 pieces), Mexico (31,200 pieces), Thailand (18,200 pieces), and Indonesia (10,300 pieces). In addition, exports of 6,300 kip skins were to Belgium (5,000 kip skins) and Canada (1,300 kip skins).
Net sales of 204,400 wet blues for 2022 primarily for China (102,000 unsplit), Vietnam (44,300 unsplit, including decreases of 100 unsplit), Thailand (34,100 unsplit), Italy (12,600 unsplit and 300 grain splits, including decreases of 400 unsplit and 200 grain splits), and Hong Kong (5,000 unsplit), were offset by reductions for Haiti (800 unsplit). Net sales of 32,200 wet blues for 2023 were reported for Vietnam (27,200 unsplit) and Hong Kong (5,000 unsplit). Exports of 162,900 wet blues were primarily to Italy (44,600 unsplit and 6,200 grain splits), Vietnam (49,700 unsplit), China (44,100 unsplit), Hong Kong (5,000 unsplit), and India (2,300 unsplit and 2,200 grain splits). Net sales reductions of 316,700 splits resulting in increases for China (44,200 pounds), were more than offset by reductions for Vietnam (359,700 pounds) and South Korea (1,200 pounds). Exports of 121,100 pounds were to Vietnam (79,900 pounds) and China (41,200 pounds).
Beef: Net sales of 14,100 MT for 2022 were primarily for South Korea (4,600 MT, including decreases of 600 MT), Japan (2,700 MT, including decreases of 400 MT), China (2,600 MT, including decreases of 100 MT), Mexico (1,000 MT), and Taiwan (800 MT, including decreases of 100 MT). Net sales of 1,900 MT for 2023 were reported for South Korea (1,200 MT), Japan (500 MT), Indonesia (100 MT), and Taiwan (100 MT). Exports of 17,400 MT were primarily to Japan (4,600 MT), South Korea (4,500 MT), China (3,000 MT), Mexico (1,500 MT), and Taiwan (1,000 MT).
Pork: Net sales of 20,300 MT for 2022 primarily for Mexico (16,900 MT, including decreases of 300 MT), China (5,600 MT, including decreases of 100 MT), South Korea (1,400 MT, including decreases of 200 MT), Colombia (900 MT, including decreases of 100 MT), and the Dominican Republic (800 MT), were offset by reductions for Australia (3,500 MT), Japan (2,600 MT), and Canada (400 MT). Exports of 30,700 MT were primarily to Mexico (14,300 MT), China (4,200 MT), Japan (3,500 MT), South Korea (2,500 MT), and Canada (2,100 MT).
Terry Reilly
Senior Commodity Analyst – Grain and Oilseeds
Futures International
One Lincoln Center
18 W 140 Butterfield Rd.
Oakbrook Terrace, Il. 60181
W: 312.604.1366
ICE IM: treilly1
Skype: fi.treilly

Trading of futures, options, swaps and other derivatives is risky and is not suitable for all persons. All of these investment products are leveraged, and you can lose more than your initial deposit. Each investment product is offered only to and from jurisdictions where solicitation and sale are lawful, and in accordance with applicable laws and regulations in such jurisdiction. The information provided here should not be relied upon as a substitute for independent research before making your investment decisions. Futures International, LLC is merely providing this information for your general information and the information does not take into account any particular individual’s investment objectives, financial situation, or needs. All investors should obtain advice based on their unique situation before making any investment decision. The contents of this communication and any attachments are for informational purposes only and under no circumstances should they be construed as an offer to buy or sell, or a solicitation to buy or sell any future, option, swap or other derivative. The sources for the information and any opinions in this communication are believed to be reliable, but Futures International, LLC does not warrant or guarantee the accuracy of such information or opinions. Futures International, LLC and its principals and employees may take positions different from any positions described in this communication. Past results are not necessarily indicative of future results.