PDF attached
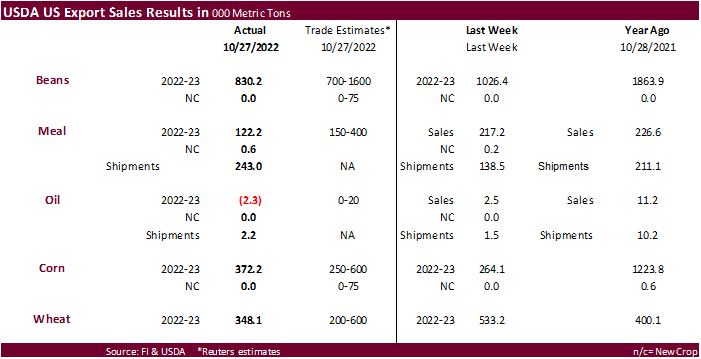
USDA export sales were at the low end of expectations for soybeans and corn. Wheat was within expectations. USDA reported meal and oil sales below a range of estimates. Net sales of 830,200 MT for 2022-23 primarily for China (745,000 MT, including 404,300 MT switched from unknown destinations and decreases of211,300 MT).
U.S. EXPORT SALES FOR WEEK ENDING 10/27/2022
|
|
CURRENT MARKETING YEAR |
NEXT MARKETING YEAR |
||||||
|
COMMODITY |
NET SALES |
OUTSTANDING SALES |
WEEKLY EXPORTS |
ACCUMULATED EXPORTS |
NET SALES |
OUTSTANDING SALES |
||
|
CURRENT YEAR |
YEAR AGO |
CURRENT YEAR |
YEAR AGO |
|||||
|
|
THOUSAND METRIC TONS |
|||||||
|
WHEAT |
|
|
|
|
|
|
|
|
|
HRW |
85.7 |
777.6 |
1,887.2 |
37.1 |
2,575.2 |
3,272.9 |
0.0 |
6.3 |
|
SRW |
20.9 |
508.1 |
600.0 |
8.1 |
1,656.9 |
1,308.4 |
0.0 |
6.6 |
|
HRS |
97.1 |
1,085.2 |
1,025.4 |
63.0 |
2,532.3 |
2,427.5 |
0.0 |
10.8 |
|
WHITE |
144.4 |
923.8 |
728.7 |
9.7 |
1,972.9 |
1,607.5 |
0.0 |
0.3 |
|
DURUM |
0.0 |
61.7 |
72.4 |
0.2 |
77.7 |
77.3 |
0.0 |
0.0 |
|
TOTAL |
348.1 |
3,356.4 |
4,313.6 |
118.1 |
8,815.1 |
8,693.6 |
0.0 |
24.0 |
|
BARLEY |
-1.5 |
10.1 |
22.8 |
0.0 |
3.9 |
7.3 |
0.0 |
0.0 |
|
CORN |
372.2 |
10,321.7 |
25,115.0 |
450.2 |
4,145.7 |
5,893.5 |
0.0 |
311.0 |
|
SORGHUM |
12.2 |
279.8 |
2,748.0 |
9.2 |
44.1 |
269.4 |
0.0 |
0.0 |
|
SOYBEANS |
830.2 |
22,407.1 |
21,422.7 |
2,651.8 |
9,890.7 |
10,581.3 |
0.0 |
0.0 |
|
SOY MEAL |
122.2 |
3,316.7 |
3,769.9 |
243.0 |
653.4 |
912.9 |
0.6 |
2.2 |
|
SOY OIL |
-2.4 |
23.4 |
112.7 |
2.2 |
6.2 |
21.1 |
0.0 |
0.6 |
|
RICE |
|
|
|
|
|
|
|
|
|
L G RGH |
5.0 |
73.0 |
222.3 |
17.0 |
115.1 |
315.9 |
0.0 |
0.0 |
|
M S RGH |
0.0 |
10.9 |
6.8 |
0.6 |
7.2 |
2.3 |
0.0 |
0.0 |
|
L G BRN |
0.1 |
6.0 |
8.4 |
0.1 |
4.1 |
16.4 |
0.0 |
0.0 |
|
M&S BR |
0.0 |
4.7 |
54.3 |
0.0 |
2.9 |
14.4 |
0.0 |
0.0 |
|
L G MLD |
100.1 |
114.6 |
86.3 |
81.7 |
222.6 |
218.5 |
0.0 |
0.0 |
|
M S MLD |
14.0 |
44.9 |
67.6 |
1.6 |
76.1 |
94.6 |
0.0 |
0.0 |
|
TOTAL |
119.2 |
254.1 |
445.6 |
101.0 |
428.0 |
662.1 |
0.0 |
0.0 |
|
COTTON |
|
THOUSAND RUNNING BALES |
||||||
|
UPLAND |
191.8 |
5,964.2 |
6,450.3 |
119.0 |
2,665.9 |
2,058.5 |
11.2 |
1,101.2 |
|
PIMA |
1.2 |
83.6 |
215.2 |
0.1 |
20.3 |
84.2 |
0.0 |
0.9 |
This summary is based on reports from exporters for the period October 21-27, 2022.
Wheat: Net sales of 348,100 metric tons (MT) for 2022/2023 primarily for South Korea (82,100 MT), Indonesia (63,000 MT), Mexico (60,800 MT, including decreases of 100 MT), Taiwan (40,200 MT), and Japan (26,500 MT), were offset by reductions for Vietnam (100 MT). Exports of 118,100 MT were primarily to Mexico (59,700 MT), Taiwan (35,700 MT), Trinidad and Tobago (9,700 MT), South Korea (8,600 MT), and Vietnam (3,200 MT).
Corn: Net sales of 372,200 MT for 2022/2023 primarily for Mexico (193,000 MT), Japan (132,100 MT, including 107,100 MT switched from unknown destinations), unknown destinations (69,600 MT), Canada (23,100 MT), and Costa Rica (9,900 MT, including decreases of 1,100 MT), were offset by reductions primarily for China (65,900 MT). Exports of 450,200 MT were primarily to China (144,300 MT), Mexico (144,200 MT), Japan (107,100 MT), Jamaica (20,000 MT), and Taiwan (13,100 MT).
Barley: Total net sales reduction of 1,500 MT for 2022/2023 were for Japan. No exports were reported for the week.
Sorghum: Total net sales of 12,200 MT for 2022/2023 were for Mexico. Exports of 9,200 MT were to Mexico.
Rice: Net sales of 119,200 MT for 2022/2023 were primarily for the Dominican Republic (77,300 MT), Haiti (15,200 MT), Japan (13,200 MT), Mexico (5,400 MT), and Jordan (4,000 MT). Exports of 101,000 MT were primarily to the Dominican Republic (78,300 MT), Colombia (15,100 MT), Mexico (3,500 MT), Canada (1,300 MT), and Saudi Arabia (1,100 MT).
Soybeans: Net sales of 830,200 MT for 2022/2023 primarily for China (745,000 MT, including 404,300 MT switched from unknown destinations and decreases of 211,300 MT), Spain (198,000 MT), the Netherlands (151,000 MT, including 147,500 MT switched from unknown destinations and decreases of 500 MT), Germany (82,800 MT), and Japan (51,700 MT, including 29,600 MT switched from unknown destinations), were offset by reductions for unknown destinations (525,100 MT) and Bangladesh (55,000 MT). Exports of 2,651,800 MT were primarily to China (1,994,900 MT), the Netherlands (151,000 MT), Egypt (125,300 MT), Mexico (108,700 MT), and Germany (82,800 MT).
Optional Origin Sales: For 2022/2023, the current outstanding balance of 300 MT, all South Korea.
Export for Own Account: For 2022/2023, new optional origin sales of 29,500 MT were reported for Canada. Decreases were reported for Canada (68,600 MT). The current exports for own account outstanding balance is 22,500 MT, all Canada.
Export Adjustments: Accumulated exports of soybeans to the Netherlands were adjusted down 82,828 MT for week ending October 13th. The correct destination for this shipment is Germany.
Soybean Cake and Meal: Net sales of 122,200 MT for 2022/2023 primarily for Mexico (40,400 MT), Morocco (30,000 MT), Canada (17,900 MT), Colombia (14,900 MT), and the Netherlands (9,100 MT, including 7,500 MT switched from Ireland), were offset by reductions primarily for Ireland (9,700 MT) and unknown destinations (7,100 MT). Total net sales of 600 MT for 2023/2024 were for Canada. Exports of 243,000 MT were primarily to the Philippines (49,600 MT), the Dominican Republic (47,400 MT), Ireland (27,800 MT), Mexico (25,200 MT), and Colombia (25,000 MT).
Soybean Oil: Total net sales reductions of 2,400 MT for 2022/2023 were for Canada. Exports of 2,200 MT were to Canada (1,600 MT) and Mexico (600 MT).
Cotton: Net sales of 191,800 RB for 2022/2023 primarily for China (122,000 RB), Pakistan (23,200 RB), Turkey (15,800 RB, including decreases of 1,500 RB), Bangladesh (11,000 RB), and Nicaragua (8,800 RB switched from Vietnam), were offset by reductions primarily for Indonesia (10,400 RB). Net sales of 11,200 RB for 2023/2024 were reported for Indonesia (10,600 RB) and Japan (600 RB). Exports of 119,000 RB were primarily to China (43,400 RB), Bangladesh (17,000 RB), Mexico (15,700 RB), Pakistan (12,500 RB), and Turkey (8,500 RB). Net sales of Pima totaling 1,200 RB were reported for Indonesia (1,000 RB) and China (200 RB). Exports of 100 RB were to Japan.
Optional Origin Sales: For 2022/2023, the current outstanding balance of 9,300 RB, all Malaysia.
Export for Own Account: For 2022/2023, the current exports for own account outstanding balance of 63,900 RB are for China (37,600 RB), Vietnam (23,900 RB), India (1,500 RB), Pakistan (500 RB), and Indonesia (400 RB).
Hides and Skins: Net sales of 350,800 pieces for 2022 primarily for China (220,600 whole cattle hides, including decreases of 7,700 pieces), Mexico (64,000 whole cattle hides, including decreases of 2,400 pieces and 12,400 whole cattle hides – late), South Korea (45,400 whole cattle hides, including decreases of 600 pieces), Thailand (6,900 whole cattle hides, including decreases of 2,100 pieces), and Turkey (3,800 whole cattle hides), were offset by reductions primarily for Brazil (400 pieces) and Vietnam (200 pieces). Total net sales of 4,600 calf skins were for Italy. In addition, total net sales of 1,500 kip skins were for Canada. Total net sales of 10,800 pieces for 2023 were for China. Exports of 779,600 whole cattle hides exports were primarily to Mexico (357,900 pieces, including 12,400 pieces – late), China (314,100 pieces), South Korea (38,000 pieces), Thailand (23,300 pieces), and Brazil (17,300 pieces). In addition, exports of 5,600 calf skins were to Italy.
Net sales of 153,900 wet blues for 2022 primarily for China (114,800 unsplit), Italy (19,500 unsplit and 1,800 grain splits, including decreases of 1,100 unsplit and 200 grain splits), Vietnam (8,500 unsplit), India (6,800 unsplit), and South Korea (2,300 grain splits), were offset by reductions for Hong Kong (2,000 unsplit). Net sales of 12,700 wet blues for 2023 were reported for Italy (10,700 unsplit) and Hong Kong (2,000 unsplit). Exports of 194,200 wet blues were primarily to Italy (70,800 unsplit and 4,200 grain splits), China (50,800 unsplit), Vietnam (27,900 unsplit), Thailand (26,100 unsplit), and Hong Kong (5,000 unsplit). Net sales reductions of 4,500 splits resulting in increases for South Korea (4,800 splits), were more than offset by reductions for Vietnam (9,300 splits). Exports of 268,100 pounds were to Vietnam.
Late Reporting: For 2022, net sales and exports totaling 12,400 pieces of whole cattle hides were reported late for Mexico.
Beef: Net sales of 9,200 MT for 2022 primarily for Japan (3,000 MT, including decreases of 400 MT), South Korea (1,900 MT, including decreases of 600 MT), Taiwan (1,800 MT, including decreases of 100 MT), Canada (1,100 MT, including decreases of 100 MT), and Mexico (700 MT), were offset by reductions for China (900 MT). Net sales of 3,800 MT for 2023 were primarily for Japan (2,500 MT). Exports of 18,000 MT were primarily to South Korea (5,200 MT), Japan (3,900 MT), China (2,800 MT), Mexico (1,700 MT), and Taiwan (1,300 MT).
Pork: Net sales of 47,900 MT for 2022 primarily for Mexico (12,700 MT, including decreases of 400 MT), China (11,200 MT, including decreases of 400 MT), Japan (9,300 MT, including decreases of 200 MT), Canada (3,900 MT, including decreases of 500 MT), and Australia (3,600 MT), were offset by reductions for the Philippines (100 MT). Net sales of 500 MT for 2023 were for China. Exports of 30,700 MT were primarily to Mexico (14,100 MT), China (4,700 MT), Japan (3,200 MT), South Korea (2,900 MT), and Canada (1,400 MT).
Late Reporting: For 2022, net sales totaling 400 MT of pork were reported late for Panama (100 MT), Vietnam (100 MT), the Dominican Republic (100 MT), and South Korea (100 MT). Exports totaling 200 MT were reported late to the Dominican Republic (100 MT) and South Korea (100 MT).
November 3, 2022 1 FOREIGN AGRICULTURAL SERVICE/USDA
Terry Reilly
Senior Commodity Analyst – Grain and Oilseeds
Futures International
One Lincoln Center
18 W 140 Butterfield Rd.
Oakbrook Terrace, Il. 60181
W: 312.604.1366
ICE IM: treilly1
Skype: fi.treilly

Trading of futures, options, swaps and other derivatives is risky and is not suitable for all persons. All of these investment products are leveraged, and you can lose more than your initial deposit. Each investment product is offered only to and from jurisdictions where solicitation and sale are lawful, and in accordance with applicable laws and regulations in such jurisdiction. The information provided here should not be relied upon as a substitute for independent research before making your investment decisions. Futures International, LLC is merely providing this information for your general information and the information does not take into account any particular individual’s investment objectives, financial situation, or needs. All investors should obtain advice based on their unique situation before making any investment decision. The contents of this communication and any attachments are for informational purposes only and under no circumstances should they be construed as an offer to buy or sell, or a solicitation to buy or sell any future, option, swap or other derivative. The sources for the information and any opinions in this communication are believed to be reliable, but Futures International, LLC does not warrant or guarantee the accuracy of such information or opinions. Futures International, LLC and its principals and employees may take positions different from any positions described in this communication. Past results are not necessarily indicative of future results.