PDF attached
USDA Export Sales
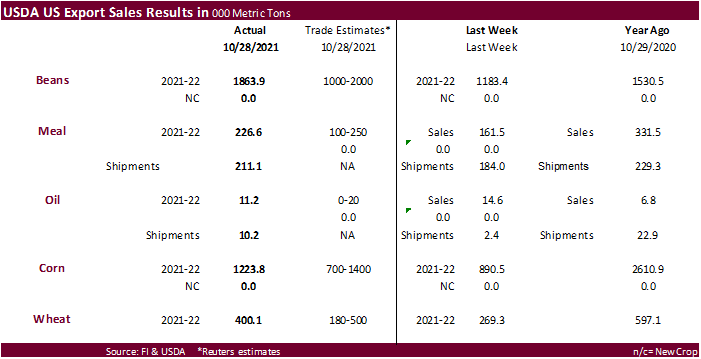
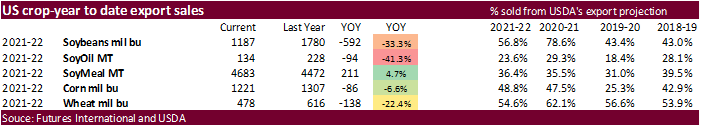
Sales were reported at the high end of a range of expectations for the soybean complex, corn and wheat. Soybean sales of 1.86 million tons included 1.2 million tons, but 510,000 tons of this was switched from unknow. Soybean commitments are running 33 percent below the previous year’s pace and represent 57 percent of USDA’s export projection. Soybean meal sales were 2266,600 tons and shipments were good at 211,100 tons. Soybean oil sales of 11,200 tons were down slightly from the previous week, and shipments were 10,200 tons, an improvement. USDA corn export sales of 1.224 million tons surprised us with the lack of 24-hour announcements for the week ending October 28 and included regular importing countries (no China). Corn commitments are running 7 percent below year ago and sales are running 49 percent of USDA’s export projection. Sorghum sales were an impressive 265,600 tons including 268,500 tons for China (unknown decrease of 3,000). All-wheat sales improved 400,100 tons from 269,300 tons previous week.
U.S. EXPORT SALES FOR WEEK ENDING 10/28/2021
FAX 202-690-3275
|
|
CURRENT MARKETING YEAR |
NEXT MARKETING YEAR |
||||||
|
COMMODITY |
NET SALES |
OUTSTANDING SALES |
WEEKLY EXPORTS |
ACCUMULATED EXPORTS |
NET SALES |
OUTSTANDING SALES |
||
|
CURRENT YEAR |
YEAR |
CURRENT YEAR |
YEAR |
|||||
|
|
THOUSAND METRIC TONS |
|||||||
|
WHEAT |
|
|
|
|
|
|
|
|
|
HRW |
206.0 |
1,887.2 |
1,633.2 |
62.7 |
3,272.9 |
4,484.4 |
0.0 |
0.0 |
|
SRW |
54.2 |
600.0 |
418.6 |
27.0 |
1,308.4 |
937.7 |
0.0 |
0.0 |
|
HRS |
73.0 |
1,025.4 |
1,616.6 |
45.8 |
2,427.5 |
3,108.5 |
0.0 |
0.0 |
|
WHITE |
66.9 |
728.7 |
1,936.2 |
0.9 |
1,607.5 |
2,080.8 |
0.0 |
0.0 |
|
DURUM |
0.0 |
72.4 |
200.9 |
0.0 |
77.3 |
340.0 |
0.0 |
0.0 |
|
TOTAL |
400.1 |
4,313.6 |
5,805.5 |
136.4 |
8,693.6 |
10,951.4 |
0.0 |
0.0 |
|
BARLEY |
0.0 |
22.8 |
31.1 |
0.1 |
7.3 |
10.9 |
0.0 |
0.0 |
|
CORN |
1,223.8 |
25,115.0 |
26,335.3 |
748.5 |
5,893.5 |
6,853.9 |
0.0 |
337.4 |
|
SORGHUM |
265.6 |
2,748.0 |
3,027.0 |
3.7 |
269.4 |
614.8 |
0.0 |
0.0 |
|
SOYBEANS |
1,863.9 |
21,422.7 |
31,853.2 |
2,650.5 |
10,892.7 |
16,578.6 |
0.0 |
19.8 |
|
SOY MEAL |
226.6 |
3,769.9 |
3,596.4 |
211.1 |
912.9 |
875.5 |
-0.2 |
36.9 |
|
SOY OIL |
11.2 |
112.7 |
174.2 |
10.2 |
21.1 |
53.8 |
0.0 |
0.1 |
|
RICE |
|
|
|
|
|
|
|
|
|
L G RGH |
11.9 |
222.3 |
464.5 |
30.4 |
315.9 |
215.2 |
0.0 |
0.0 |
|
M S RGH |
0.0 |
6.8 |
20.4 |
0.2 |
2.3 |
8.5 |
0.0 |
0.0 |
|
L G BRN |
0.1 |
8.4 |
11.3 |
0.2 |
16.4 |
10.3 |
0.0 |
0.0 |
|
M&S BR |
0.1 |
54.3 |
18.7 |
0.1 |
14.4 |
29.8 |
0.0 |
0.0 |
|
L G MLD |
2.5 |
86.3 |
87.1 |
2.5 |
218.5 |
112.7 |
0.0 |
0.0 |
|
M S MLD |
15.3 |
67.6 |
146.6 |
16.8 |
94.6 |
103.9 |
0.0 |
0.0 |
|
TOTAL |
29.8 |
445.6 |
748.8 |
50.2 |
662.1 |
480.5 |
0.0 |
0.0 |
|
COTTON |
|
THOUSAND RUNNING BALES |
||||||
|
UPLAND |
139.1 |
6,450.3 |
5,667.3 |
141.9 |
2,058.5 |
3,197.9 |
20.6 |
856.9 |
|
PIMA |
31.8 |
215.2 |
266.3 |
7.6 |
84.2 |
161.0 |
1.8 |
1.8 |
This summary is based on reports from exporters for the period October 22-28, 2021.
Wheat: Net sales of 400,100 metric tons (MT) for 2021/2022 were up 49 percent from the previous week and 4 percent from the prior 4-week average. Increases primarily for Mexico (101,400 MT, including decreases of 26,000 MT), South Korea (50,000 MT), Taiwan (48,400 MT), unknown destinations (31,700 MT), and Japan (30,300 MT), were offset by reductions for China (100 MT). Exports of 136,400 MT were down 27 percent from the previous week and 60 percent from the prior 4-week average. The destinations were primarily to Mexico (27,000 MT), Panama (24,600 MT), Honduras (23,400 MT), Jamaica (22,500 MT), and Canada (17,800 MT).
Corn: Net sales of 1,223,800 MT for 2021/2022 were up 37 percent from the previous week and 10 percent from the prior 4-week average. Increases primarily for Mexico (666,300 MT, including decreases of 18,300 MT), Japan (114,900 MT, including 50,900 MT switched from unknown destinations and decreases of 15,500 MT), Guatemala (105,400 MT), Colombia (77,500 MT, including 50,000 MT switched from unknown destinations), and Saudi Arabia (74,000 MT), were offset by reductions for unknown destinations (12,900 MT) and Panama (1,800 MT). Exports of 748,500 MT were up 9 percent from the previous week, but down 17 percent from the prior 4-week average. The destinations were primarily to Mexico (317,300 MT), Japan (162,900 MT), Colombia (136,200 MT), Venezuela (43,600 MT), and Nicaragua (26,300 MT).
Optional Origin Sales: For 2021/2022, new optional origin sales of 29,000 MT were reported for Italy (20,000 MT) and unknown destinations (9,000 MT). The current outstanding balance of 508,300 MT is for unknown destinations (379,000 MT), South Korea (65,000 MT), Italy (55,300 MT), and Saudi Arabia (9,000 MT).
Barley: No net sales were reported for the week. Exports of 100 MT were down 92 percent from the previous week and 90 percent from the prior 4-week average. The destination was to Taiwan.
Sorghum: Net sales of 265,600MT for 2021/2022 resulting in increases for China (268,500 MT) and Japan (100 MT), were offset by reductions for unknown destinations (3,000 MT). Exports of 3,700 MT were up 77 percent from the previous week, but down 90 percent from the prior 4-week average. The destination was primarily to China (2,300 MT).
Rice: Net sales of 29,800 MT for 2021/2022 were up 19 percent from the previous week, but down 44 percent from the prior 4-week average. Increases were primarily for Japan (13,000 MT), Guatemala (10,200 MT), Canada (1,700 MT), Mexico (1,500 MT), and Honduras (1,300 MT). Exports of 50,200 MT were down 20 percent from the previous week and 4 percent from the prior 4-week average. The destinations were primarily to Honduras (21,800 MT), Japan (13,000 MT), Mexico (9,200 MT), Canada (2,200 MT), and Jordan (2,100 MT).
Exports for Own Account: For 2021/2022, new exports for own account totaling 100 MT were to Canada. The current exports for own account outstanding balance is 200 MT, all Canada.
Soybeans: Net sales of 1,863,900 MT for 2021/2022 were up 58 percent from the previous week and 19 percent the prior 4-week average. Increases primarily for China (1,207,300 MT, including 510,000 MT switched from unknown destinations and decreases of 14,000 MT), Mexico (157,400 MT, including decreases of 1,100 MT), the Netherlands (142,100 MT, including 120,000 MT switched from unknown destinations and decreases of 3,900 MT), Egypt (140,500 MT, including decreases of 1,600 MT), and Spain (92,900 MT, including 64,000 MT switched from China and 26,000 MT switched unknown destinations), were offset by reductions for unknown destinations (137,600 MT). Exports of 2,650,500 MT were up 10 percent from the previous week and 46 percent from the prior 4-week average. The destinations were primarily to China (1,864,500 MT), Mexico (178,600 MT), the Netherlands (142,100 MT), Spain (92,900 MT), and Egypt (87,100 MT).
Export for Own Account: For 2021/2022, new exports for own account totaling 29,800 MT were for Canada. The current exports for own account outstanding balance is 66,400 MT, all Canada.
Soybean Cake and Meal: Net sales of 226,600 MT for 2021/2022 primarily for Mexico (71,000 MT), Guatemala (44,200 MT), Morocco (24,000 MT), El Salvador (22,700 MT), and Venezuela (20,500 MT, including 18,000 MT switched from unknown destinations), were offset by reductions primarily for unknown destinations (18,600 MT). Total net sales reductions of 200 MT for 2022/2023 were for Japan. Exports of 211,100 MT were primarily to Ecuador (40,300 MT), Honduras (34,000 MT), Canada (30,500 MT), Mexico (23,900 MT), and Venezuela (20,500 MT).
Soybean Oil: Net sales of 11,200 MT for 2021/2022 were primarily for Mexico (6,500 MT), Costa Rica (4,000 MT), and Guatemala (500 MT). Exports of 10,200 MT were primarily to Costa Rica (4,200 MT), Jamaica (3,500 MT), Mexico (1,200 MT), and Honduras (1,000 MT).
Cotton: Net sales of 139,100 RB for 2021/2022 were down 61 percent from the previous week and 51 percent from the prior 4-week average. Increases were primarily for China (44,800 RB, including decreases of 30,400 RB), India (24,300 RB), Turkey (23,700 RB), Vietnam (18,100 RB), and Peru (13,700 RB). Net sales of 20,600 RB for 2022/2023 reported for Turkey (13,200 RB) and Pakistan (8,800 RB), were offset by reductions for China (1,400 RB). Exports of 141,900 RB were up noticeably from the previous week and up 42 percent from the prior 4-week average. The destinations were primarily to China (61,100 RB), Mexico (24,400 RB), Pakistan (13,100 RB), Turkey (7,400 RB), and El Salvador (6,900 RB). Net sales of Pima totaling 31,800 RB–a marketing-year high–were up noticeably from the previous week and from the prior 4-week average. Increases were primarily for Vietnam (8,700 RB), India (7,900 RB, including decreases of 400 RB), China (7,300 RB), Pakistan (3,700 RB), and Turkey (2,200 RB). Total net sales of 1,800 RB for 2022/2023 were for Egypt. Exports of 7,600 RB were up noticeably from the previous week and up 39 percent from the prior 4-week average. The destinations were primarily to India (5,400 RB), Peru (1,600 RB), and Thailand (400 RB).
Optional Origin Sales: For 2021/2022, the current outstanding balance of 8,800 RB is for Pakistan.
Exports for Own Account: For 2021/2022, the current exports for own account totaling 4,700 RB to China were applied to new or outstanding sales. The outstanding balance of 100 RB is for Vietnam.
Hides and Skins: Net sales of 463,500 pieces for 2021 were down 18 percent from the previous week, but up 3 percent from the prior 4-week average. Increases primarily for China (378,400 whole cattle hides, including decreases of 17,000 pieces), South Korea (36,200 whole cattle hides, including decreases of 1,200 pieces), Thailand (25,700 whole cattle hides, including decreases of 400 pieces), Indonesia (9,600 whole cattle hides), and Mexico (8,500 whole cattle hides, including decreases of 3,300 pieces), were offset by reductions primarily for Cambodia (4,800 pieces). Net sales of 6,200 pieces for 2022 were reported for China (3,600 whole cattle hides) and Mexico (2,600 whole cattle hides). Total net sales reductions of 2,800 calf skins were for Italy. In addition, total net sales of 1,400 kip skins were for Italy. Exports of 402,400 pieces were down 1 percent from the previous week and 7 percent from the prior 4-week average. Whole cattle hide exports were primarily to China (261,800 pieces), South Korea (58,300 pieces), Mexico (31,200 pieces), Thailand (29,700 pieces), and Brazil (13,600 pieces).
Net sales of 92,400 wet blues for 2021 were down 57 percent from the previous week and 37 percent from the prior 4-week average. Increases primarily for Italy (47,900 unsplit, 100 grain splits, and decreases of 200 grain splits), Thailand (20,200 unsplit), China (13,700 unsplit), Vietnam (10,500 unsplit), and Mexico (1,300 unsplit, including decreases 3,000 unsplit and 200 grain splits), were offset by reductions for Brazil (1,800 unsplit). Net sales reductions of 200 wet blues for 2022 resulting in increases for Mexico (3,000 unsplit) and Italy (1,600 unsplit), were more than offset by reductions for Vietnam (4,800 unsplit). Exports of 134,200 wet blues were up 7 percent from the previous week, but down 13 percent from the prior 4-week average. The destinations were primarily to China (46,600 unsplit), Italy (30,100 unsplit and 11,300 grain splits), Vietnam (29,400 unsplit), Mexico (5,000 grain splits and 4,300 unsplit), and Thailand (6,200 unsplit). Net sales of 961,900 splits were for Vietnam (960,000 splits) and China (1,900 splits). Exports of 242,900 pounds were to Vietnam (200,000 pounds) and China (42,900 pounds).
Beef: Net sales of 16,700 MT for 2021 were down 13 percent from the previous week, but up 15 percent from the prior 4-week average. Increases were primarily for South Korea (6,700 MT, including decreases of 500 MT), China (2,800 MT, including decreases of 100 MT), Japan (2,200 MT, including decreases of 500 MT), Taiwan (1,600 MT, including decreases of 100 MT), and Canada (1,000 MT, including decreases of 100 MT). Net sales of 3,500 MT for 2022 were primarily for South Korea (2,700 MT) and Japan (700 MT). Exports of 16,800 MT were unchanged from the previous week, but up 3 percent from the prior 4-week average. The destinations were primarily to South Korea (4,600 MT), Japan (4,500 MT), China (3,100 MT), Taiwan (1,100 MT), and Mexico (1,100 MT).
Pork: Net sales of 45,700 MT for 2021 were up 55 percent from the previous week and 72 percent from the prior 4-week average. Increases primarily for Mexico (18,500 MT, including decreases of 500 MT), China (16,000 MT, including decreases of 300 MT), Japan (3,500 MT, including decreases of 200 MT), Canada (2,500 MT, including decreases of 400 MT), and South Korea (2,000 MT, including decreases of 1,100 MT), were offset by reductions for Chile (700 MT). Net sales of 400 MT for 2022 were reported for Japan. Exports of 33,800 MT were up 3 percent from the previous week and 9 percent from the prior 4-week average. The destinations were primarily to Mexico (15,800 MT), China (4,400 MT), Japan (4,300 MT), Colombia (2,800 MT), and South Korea (2,300 MT).
Export Adjustment: Accumulated exports of pork to the Dominican Republic were adjusted down 3 MT for week e
Terry Reilly
Senior Commodity Analyst – Grain and Oilseeds
Futures International
One Lincoln Center
18 W 140 Butterfield Rd.
Oakbrook Terrace, Il. 60181
W: 312.604.1366
ICE IM: treilly1
Skype: fi.treilly

Trading of futures, options, swaps and other derivatives is risky and is not suitable for all persons. All of these investment products are leveraged, and you can lose more than your initial deposit. Each investment product is offered only to and from jurisdictions where solicitation and sale are lawful, and in accordance with applicable laws and regulations in such jurisdiction. The information provided here should not be relied upon as a substitute for independent research before making your investment decisions. Futures International, LLC is merely providing this information for your general information and the information does not take into account any particular individual’s investment objectives, financial situation, or needs. All investors should obtain advice based on their unique situation before making any investment decision. The contents of this communication and any attachments are for informational purposes only and under no circumstances should they be construed as an offer to buy or sell, or a solicitation to buy or sell any future, option, swap or other derivative. The sources for the information and any opinions in this communication are believed to be reliable, but Futures International, LLC does not warrant or guarantee the accuracy of such information or opinions. Futures International, LLC and its principals and employees may take positions different from any positions described in this communication. Past results are not necessarily indicative of future results.