PDF attached
USDA Export Sales
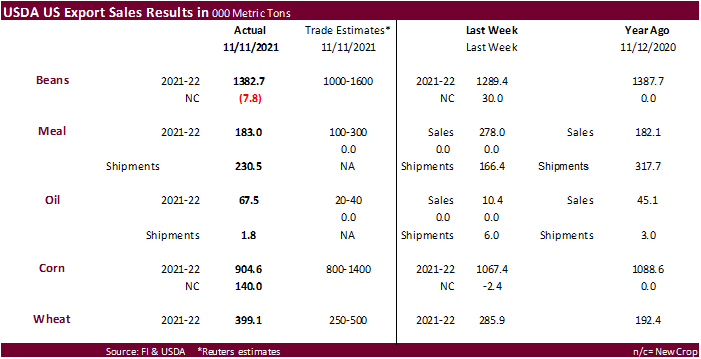
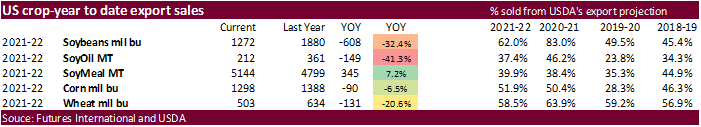
Good sales all around. USDA export sales for soybeans of 1.383 million topped expectations and included 727,500 tons for China (394k were switched from unknown). Crop year to date soybean sales are running 32 percent below last year’s pace. Soybean meal sales were 183,000 tons, within expectations and shipments were 230,500 tons, up from 166,400 tons previous week. Soybean oil sales were 67,500 tons that included the 22,000 ton 24-hour sale to unknown. Dominican Republic booked 19,500 tons and South Korea 12,000 tons. US corn export sales were 904,600 tons, low end for expectations. Canada, Mexico and Japan were largest buyers. Crop year corn sales are running 7 percent below last year’s pace. Sorghum sales of 323,100 tons were a marketing year high and included 195,000 tons to unknown and 124,000 tons for China. Pork sales were 25,000 tons. US all-wheat export sales were 399,100 tons. Within expectations.
This summary is based on reports from exporters for the period November 5-11, 2021.
Wheat: Net sales of 399,100 metric tons (MT) for 2021/2022 were up 40 percent from the previous week and 21 percent from the prior 4-week average. Increases primarily for Nigeria (84,200 MT, including 27,500 MT switched from unknown destinations), Vietnam (66,000 MT), Japan (62,500 MT), the Philippines (61,500 MT), and Mexico (39,200 MT, including decreases of 5,300 MT), were offset by reductions primarily for unknown destinations (45,600 MT). Exports of 310,900 MT were up 15 percent from the previous week and 65 percent from the prior 4-week average. The destinations were primarily to Nigeria (130,500 MT), Venezuela (33,600 MT), Guatemala (31,900 MT), Japan (27,400 MT), and Mexico (22,300 MT).
Corn: Net sales of 904,600 MT for 2021/2022 were down 15 percent from the previous week and 19 percent from the prior 4-week average. Increases primarily for Canada (230,000 MT), Mexico (210,400 MT, including decreases of 6,300 MT), Japan (201,600 MT, including 110,800 MT switched from unknown destinations and decreases of 6,000 MT), Colombia (69,300 MT, including 50,900 MT switched from unknown destinations and decreases of 103,000 MT), and Guatemala (47,200 MT, including 18,700 MT switched from Nicaragua, 13,500 MT switched from Costa Rica, 7,500 MT switched from Honduras, and decreases of 9,100 MT), were offset by reductions for Nicaragua (16,000 MT) and Costa Rica (12,600 MT). Total net sales of 140,000 MT for 2022/2023 were for Mexico. Exports of 1,167,700 MT–a marketing-year high–were up 63 percent from the previous week and 46 percent from the prior 4-week average. The destinations were primarily to Mexico (404,300 MT), Colombia (222,800 MT), Japan (154,200 MT), Canada (151,000 MT), and Guatemala (127,900 MT).
Optional Origin Sales: For 2021/2022, new optional origin sales of 55,400 MT were reported for unknown destinations (50,000 MT) and Italy (5,400 MT). The current outstanding balance of 498,700 MT is for unknown destinations (429,000 MT), Italy (60,700 MT), and Saudi Arabia (9,000 MT).
Barley: Total net sales reductions of 100 MT for 2021/2022 were for South Korea. Exports of 200 MT were unchanged from the previous week, but down 59 percent from the prior 4-week average. The destination was to Taiwan.
Sorghum: Net sales of 323,100 MT for 2021/2022–a marketing-year high–were up 24 percent from the previous week and 40 percent from the prior 4-week average. Increases were reported for unknown destinations (195,000 MT), China (124,000 MT), and Mexico (4,100 MT). Exports of 2,600 MT were down 97 percent from the previous week and 92 percent from the prior 4-week average. The destinations were to China (2,200 MT) and Mexico (400 MT).
Rice: Net sales of 102,100 MT for 2021/2022–a marketing-year high–were up noticeably from the previous week and from the prior 4-week average. Increases were primarily for Mexico (34,700 MT), Honduras (20,800 MT), Haiti (16,100 MT, including decreases of 200 MT), Guatemala (12,200 MT), and Nicaragua (10,000 MT). Exports of 88,000 MT were up noticeably from the previous week and up 78 percent from the prior 4-week average. The destinations were primarily to Mexico (35,900 MT), Honduras (30,600 MT), Haiti (15,100 MT), Saudi Arabia (2,100 MT), and Canada (2,000 MT).
Exports for Own Account: For 2021/2022, the current exports for own account outstanding balance is 100 MT, all Canada.
Late Reporting: For 2021/2022, net sales and exports totaling 500 MT of medium, short and other classes of rice were reported late for Japan.
Soybeans: Net sales of 1,382,700 MT for 2021/2022 were up 13 percent from the previous week, but down 20 percent the prior 4-week average. Increases primarily for China (727,500 MT, including 394,000 MT switched from unknown destinations and decreases of 5,700 MT), the Netherlands (133,000 MT, including 126,000 MT switched from unknown destinations), Spain (113,700 MT, including 65,000 MT switched from unknown destinations), Thailand (74,600 MT, including 66,000 MT switched from unknown destinations), and unknown destinations (60,100 MT), were offset by reductions for Bangladesh (2,900 MT). Total net sales reductions of 7,800 MT for 2022/2023 were for Cuba. Exports of 2,344,200 MT were down 36 percent from the previous week and 12 percent from the prior 4-week average. The destinations were primarily to China (1,657,200 MT), the Netherlands (133,000 MT), Mexico (123,200 MT), Thailand (76,000 MT), and Spain (71,700 MT).
Export for Own Account: For 2021/2022, new exports for own account totaling 11,300 MT were for Canada. The current exports for own account outstanding balance is 11,300 MT, all Canada.
Export Adjustments: Accumulated export of soybeans to China were adjusted down 70,000 MT for week ending November 4th. This shipment was reported in error.
Soybean Cake and Meal: Net sales of 183,000 MT for 2021/2022 were down 34 percent from the previous week and 19 percent from the prior 4-week average. Increases primarily for the Philippines (99,700 MT), Morocco (27,000 MT), Guatemala (18,600 MT, including 5,000 MT switched from Costa Rica and decreases of 6,100 MT), Honduras (12,000 MT), and Canada (8,000 MT, including decreases of 1,200 MT), were offset by reductions for Costa Rica (5,000 MT), Belgium (1,500 MT), and Colombia (500 MT). Total net sales reductions of 600 MT for 2022/2023 were for Japan. Exports of 230,500 MT were up 39 percent from the previous week and 19 percent from the prior 4-week average. The destinations were primarily to Colombia (109,500 MT), the Dominican Republic (28,600 MT), Guatemala (27,800 MT), Canada (19,700 MT), and Mexico (16,900 MT).
Soybean Oil: Net sales of 67,500 MT for 2021/2022 were up noticeably from the previous week and from the prior 4-week average. Increases were primarily for unknown destinations (22,000 MT), the Dominican Republic (19,500 MT), South Korea (12,000 MT), Mexico (6,900 MT), and Guatemala (3,000 MT). Exports of 1,800 MT were down 70 percent from the previous week and 73 percent from the prior 4-week average. The destinations were to Mexico (1,600 MT) and Canada (200 MT).
Cotton: Net sales of 136,700 RB for 2021/2022 were up 7 percent from the previous week, but down 46 percent from the prior 4-week average. Increases were primarily for Vietnam (40,400 RB, including 600 RB switched from Thailand, 200 RB switched from Japan, and 100 RB switched from China), Turkey (30,800 RB, including 4,400 RB switched from Vietnam), China (13,500 RB), Nicaragua (13,200 RB, including 8,800 RB switched from Vietnam), and Indonesia (6,500 RB). Net sales of 7,200 RB for 2022/2023 were reported for Turkey (4,400 RB) and Colombia (2,800 RB). Exports of 77,900 RB were down 11 percent from the previous week and 24 percent from the prior 4-week average. The destinations were primarily to Mexico (30,200 RB), China (20,500 RB), Vietnam (6,500 RB), Pakistan (6,300 RB), and Thailand (2,100 RB). Net sales of Pima totaling 20,600 RB were up noticeably from the previous week and up 17 percent from the prior 4-week average. Increases were primarily for Peru (8,200 RB), India (8,100 RB), Turkey (1,300 RB), Germany (1,100 RB), and China (900 RB). Exports of 6,500 RB were down 32 percent from the previous week, but up 6 percent from the prior 4-week average. The destinations were to India (4,900 RB), Italy (1,100 RB), Taiwan (400 RB), and Thailand (100 RB)
Optional Origin Sales: For 2021/2022, the current outstanding balance of 8,800 RB is for Pakistan.
Exports for Own Account: For 2021/2022, the current exports for own account outstanding balance of 100 RB is for Vietnam.
Hides and Skins: Net sales of 513,300 pieces for 2021 were down 20 percent from the previous week and 2 percent from the prior 4-week average. Increases primarily for China (314,100 whole cattle hides, including decreases of 6,800 pieces), South Korea (109,300 whole cattle hides, including decreases of 1,200 pieces), Mexico (31,100 whole cattle hides, including deceases of 1,000 pieces), Thailand (19,400 whole cattle hides, including decreases of 200 pieces), and Indonesia (11,600 whole cattle hides, including decreases of 100 pieces), were offset by reductions for Vietnam (100 whole cattle hides). Total net sales reductions of 400 kip skins were for Belgium. Net sales of 44,900 pieces for 2022 were reported for China (32,100 whole cattle hides) and Indonesia (12,800 whole cattle hides). Exports of 399,000 pieces were up 10 percent from the previous week, but down 3 percent from the prior 4-week average. Whole cattle hide exports were primarily to China (272,900 pieces), South Korea (46,600 pieces), Mexico (21,300 pieces), Thailand (17,300 pieces), and Brazil (13,200 pieces). In addition, exports of 8,000 kip skins were to Belgium.
Net sales of 146,300 wet blues for 2021 were up noticeably from the previous week and up 18 percent from the prior 4-week average. Increases primarily for China (64,800 unsplit), Italy (20,100 unsplit, 11,700 grain splits, and decreases of 200 unsplit), Vietnam (28,800 unsplit), Japan (16,000 grain splits), and Brazil (3,100 unsplit), were offset by reductions for Taiwan (100 unsplit). Net sales of 102,600 wet blues for 2022 were reported for Italy (86,000 unsplit), China (15,000 unsplit), and Vietnam (1,600 unsplit). In addition, total net sales reductions of 11,800 grain splits were reported for Italy. Exports of 142,400 wet blues were up 50 percent from the previous week, but down 2 percent from the prior 4-week average. The destinations were primarily to China (46,200 unsplit), Italy (33,400 unsplit and 5,500 grain splits), Vietnam (34,900 unsplit), Thailand (12,300 unsplit), and Mexico (3,400 grain splits and 900 unsplit). Net sales of 274,900 splits were reported for Vietnam (227,500 splits) and China (47,400 splits). Total net sales of 421,200 splits for 2022 were for Vietnam. Exports of 208,300 pounds were primarily to Vietnam (123,000 pounds).
Beef: Net sales of 25,500 MT for 2021 were up 23 percent from the previous week and 58 percent from the prior 4-week average. Increases primarily for China (13,800 MT, including decreases of 200 MT), Taiwan (3,600 MT, including decreases of 100 MT), Japan (3,200 MT, including decreases of 500 MT), South Korea (1,700 MT, including decreases of 500 MT), and Mexico (800 MT, including decreases of 100 MT), were offset by reductions for Colombia (100 MT). For 2022, net sales of 4,600 MT were primarily for South Korea (2,600 MT), Japan (1,300 MT), and China (400 MT). Exports of 18,200 MT were up 8 percent from the previous week and from the prior 4-week average. The destinations were primarily to South Korea (5,400 MT), Japan (4,100 MT), China (3,200 MT), Mexico (1,500 MT), and Taiwan (1,100 MT).
Pork: Net sales of 25,000 MT for 2021 were up 7 percent from the previous week, but down 16 percent from the prior 4-week average. Increases primarily for Mexico (16,900 MT, including decreases of 600 MT), Japan (3,800 MT, including decreases of 200 MT), Canada (1,600 MT, including decreases of 600 MT), Colombia (1,100 MT, including decreases of 100 MT), and Australia (700 MT, including decreases of 100 MT), were offset by reductions for South Korea (900 MT). Net sales of 5,100 MT for 2022 were primarily for South Korea (4,200 MT) and Australia (800 MT). Exports of 34,700 MT were up 9 percent from the previous week and 6 percent from the prior 4-week average. The destinations were primarily to Mexico (16,200 MT), Japan (4,600 MT), China (4,400 MT), South Korea (3,000 MT), and Colombia (2,100 MT).
U.S. EXPORT SALES FOR WEEK ENDING 11/11/2021
FAX 202-690-3275
|
|
CURRENT MARKETING YEAR |
NEXT MARKETING YEAR |
||||||
|
COMMODITY |
NET SALES |
OUTSTANDING SALES |
WEEKLY EXPORTS |
ACCUMULATED EXPORTS |
NET SALES |
OUTSTANDING SALES |
||
|
CURRENT YEAR |
YEAR |
CURRENT YEAR |
YEAR |
|||||
|
|
THOUSAND METRIC TONS |
|||||||
|
WHEAT |
|
|
|
|
|
|
|
|
|
HRW |
115.9 |
1,835.4 |
1,567.2 |
134.4 |
3,500.3 |
4,646.2 |
0.0 |
0.0 |
|
SRW |
107.0 |
574.6 |
412.9 |
65.6 |
1,448.6 |
954.8 |
0.0 |
22.5 |
|
HRS |
93.6 |
1,184.0 |
1,459.7 |
51.4 |
2,519.2 |
3,377.8 |
0.0 |
0.0 |
|
WHITE |
82.6 |
771.5 |
2,031.5 |
59.4 |
1,709.9 |
2,256.2 |
0.0 |
0.0 |
|
DURUM |
0.0 |
52.4 |
201.9 |
0.0 |
96.5 |
341.9 |
0.0 |
0.0 |
|
TOTAL |
399.1 |
4,417.8 |
5,673.0 |
310.9 |
9,274.5 |
11,576.8 |
0.0 |
22.5 |
|
BARLEY |
-0.1 |
22.6 |
31.0 |
0.2 |
7.4 |
11.8 |
0.0 |
0.0 |
|
CORN |
904.6 |
25,201.1 |
26,826.7 |
1,167.7 |
7,779.2 |
8,429.4 |
140.0 |
474.9 |
|
SORGHUM |
323.1 |
3,249.6 |
2,995.9 |
2.6 |
352.0 |
940.9 |
0.0 |
0.0 |
|
SOYBEANS |
1,382.7 |
18,048.9 |
28,940.9 |
2,344.2 |
16,557.2 |
22,221.7 |
-7.8 |
42.0 |
|
SOY MEAL |
183.0 |
3,834.1 |
3,381.5 |
230.5 |
1,309.8 |
1,417.7 |
-0.6 |
36.2 |
|
SOY OIL |
67.5 |
182.8 |
291.0 |
1.8 |
29.0 |
70.1 |
0.0 |
0.0 |
|
RICE |
|
|
|
|
|
|
|
|
|
L G RGH |
79.2 |
230.3 |
391.3 |
65.0 |
389.3 |
332.9 |
0.0 |
0.0 |
|
M S RGH |
0.0 |
6.5 |
19.6 |
0.3 |
2.6 |
9.3 |
0.0 |
0.0 |
|
L G BRN |
0.1 |
9.4 |
10.7 |
0.1 |
16.6 |
11.2 |
0.0 |
0.0 |
|
M&S BR |
0.1 |
68.5 |
19.7 |
0.1 |
14.5 |
30.0 |
0.0 |
0.0 |
|
L G MLD |
19.2 |
91.3 |
79.8 |
19.1 |
240.8 |
143.6 |
0.0 |
0.0 |
|
M S MLD |
3.5 |
79.5 |
157.2 |
3.5 |
103.5 |
112.1 |
0.0 |
0.0 |
|
TOTAL |
102.1 |
485.7 |
678.4 |
88.0 |
767.3 |
639.0 |
0.0 |
0.0 |
|
COTTON |
|
THOUSAND RUNNING BALES |
||||||
|
UPLAND |
136.7 |
6,549.2 |
5,465.1 |
77.9 |
2,224.2 |
3,763.3 |
7.2 |
875.7 |
|
PIMA |
20.6 |
226.2 |
250.5 |
6.5 |
100.3 |
201.7 |
0.0 |
1.8 |
Terry Reilly
Senior Commodity Analyst – Grain and Oilseeds
Futures International
One Lincoln Center
18 W 140 Butterfield Rd.
Oakbrook Terrace, Il. 60181
W: 312.604.1366
ICE IM: treilly1
Skype: fi.treilly

Trading of futures, options, swaps and other derivatives is risky and is not suitable for all persons. All of these investment products are leveraged, and you can lose more than your initial deposit. Each investment product is offered only to and from jurisdictions where solicitation and sale are lawful, and in accordance with applicable laws and regulations in such jurisdiction. The information provided here should not be relied upon as a substitute for independent research before making your investment decisions. Futures International, LLC is merely providing this information for your general information and the information does not take into account any particular individual’s investment objectives, financial situation, or needs. All investors should obtain advice based on their unique situation before making any investment decision. The contents of this communication and any attachments are for informational purposes only and under no circumstances should they be construed as an offer to buy or sell, or a solicitation to buy or sell any future, option, swap or other derivative. The sources for the information and any opinions in this communication are believed to be reliable, but Futures International, LLC does not warrant or guarantee the accuracy of such information or opinions. Futures International, LLC and its principals and employees may take positions different from any positions described in this communication. Past results are not necessarily indicative of future results.