PDF attached
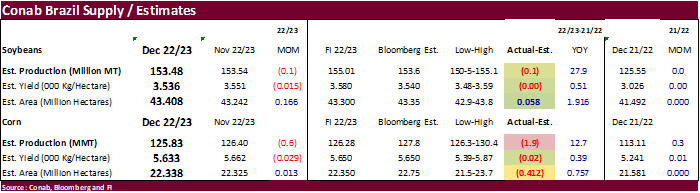
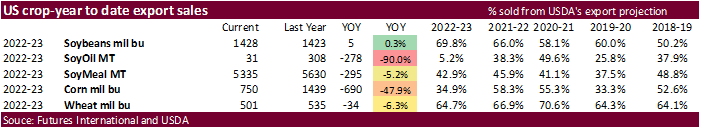
Good export sales were posted for soybeans that included China (839,600 MT, including 396,000 MT switched from unknown destinations and decreases of108,200 MT), Mexico (143,300 MT, including 47,500 MT switched from unknown destinations and decreases of 300 MT) and Germany (140,400 MT). Soybean meal sales were within expectations and soybean oil poor. Shipments of meal were ok. Corn export sales improved from the previous week and were within expectations. All-wheat sales were within expectations but slow for this time of year. Pork sales were 7,900 tons. US soybean commitments are running near year ago level and at a rate that should reach USDA’s export projection while corn commitments are very slow and suggest USDA maybe too high on their export projection.
U.S. EXPORT SALES FOR WEEK ENDING 12/1/2022
|
|
CURRENT MARKETING YEAR |
NEXT MARKETING YEAR |
||||||
|
COMMODITY |
NET SALES |
OUTSTANDING SALES |
WEEKLY EXPORTS |
ACCUMULATED EXPORTS |
NET SALES |
OUTSTANDING SALES |
||
|
CURRENT YEAR |
YEAR AGO |
CURRENT YEAR |
YEAR AGO |
|||||
|
|
THOUSAND METRIC TONS |
|||||||
|
WHEAT |
|
|
|
|
|
|
|
|
|
HRW |
76.9 |
868.5 |
1,963.1 |
45.8 |
2,846.2 |
3,806.6 |
0.0 |
6.3 |
|
SRW |
28.5 |
550.6 |
632.7 |
7.0 |
1,690.0 |
1,502.7 |
0.0 |
13.6 |
|
HRS |
16.4 |
1,302.5 |
1,123.4 |
84.6 |
2,853.1 |
2,779.8 |
0.0 |
10.8 |
|
WHITE |
66.9 |
1,075.9 |
765.9 |
87.4 |
2,233.8 |
1,851.5 |
0.0 |
0.3 |
|
DURUM |
1.1 |
91.7 |
35.9 |
32.6 |
129.1 |
97.2 |
0.0 |
0.0 |
|
TOTAL |
189.9 |
3,889.2 |
4,521.1 |
257.4 |
9,752.2 |
10,037.9 |
0.0 |
31.0 |
|
BARLEY |
0.0 |
6.1 |
21.5 |
0.5 |
5.5 |
9.0 |
0.0 |
0.0 |
|
CORN |
691.6 |
12,370.6 |
26,011.4 |
900.1 |
6,673.4 |
10,551.3 |
0.0 |
969.0 |
|
SORGHUM |
3.5 |
186.4 |
3,417.3 |
72.0 |
174.1 |
931.0 |
0.0 |
0.0 |
|
SOYBEANS |
1,716.2 |
17,700.8 |
15,300.6 |
2,247.6 |
21,173.1 |
23,439.4 |
30.0 |
40.0 |
|
SOY MEAL |
226.2 |
3,579.8 |
3,473.6 |
260.9 |
1,755.4 |
2,156.3 |
15.0 |
18.3 |
|
SOY OIL |
0.5 |
18.8 |
185.3 |
0.4 |
11.9 |
123.1 |
0.0 |
0.6 |
|
RICE |
|
|
|
|
|
|
|
|
|
L G RGH |
27.7 |
142.3 |
170.9 |
1.0 |
135.1 |
523.6 |
0.0 |
0.0 |
|
M S RGH |
3.0 |
14.7 |
6.5 |
0.5 |
10.2 |
2.6 |
0.0 |
0.0 |
|
L G BRN |
0.1 |
6.4 |
4.5 |
0.4 |
6.7 |
25.3 |
0.0 |
0.0 |
|
M&S BR |
0.2 |
9.8 |
68.5 |
0.3 |
4.7 |
14.8 |
0.0 |
0.0 |
|
L G MLD |
18.3 |
122.8 |
59.2 |
2.9 |
206.3 |
321.9 |
0.0 |
0.0 |
|
M S MLD |
28.5 |
94.2 |
66.9 |
3.9 |
91.1 |
124.7 |
0.0 |
0.0 |
|
TOTAL |
77.7 |
390.2 |
376.5 |
8.9 |
454.1 |
1,012.9 |
0.0 |
0.0 |
|
COTTON |
|
THOUSAND RUNNING BALES |
||||||
|
UPLAND |
32.6 |
5,352.4 |
7,220.4 |
141.1 |
3,381.2 |
2,507.5 |
26.4 |
1,170.5 |
|
PIMA |
1.4 |
77.2 |
240.5 |
6.9 |
36.1 |
117.7 |
0.2 |
1.1 |
This summary is based on reports from exporters for the period November 25-December 1, 2022.
Wheat: Net sales of 189,900 metric tons (MT) for 2022/2023 were primarily for China (65,000 MT), Iraq (50,000 MT), Mexico (34,200 MT, including decreases of 100 MT), Italy (15,700 MT, including decreases of 400 MT), and Haiti (7,000 MT). Exports of 257,400 MT were primarily to the Philippines (110,000 MT), Japan (35,000 MT), Algeria (32,600 MT), Mexico (31,700 MT), and Nigeria (30,000 MT).
Corn: Net sales of 691,600 MT for 2022/2023 primarily for Mexico (333,100 MT, including decreases of 32,400 MT), China (204,900 MT, including 189,200 MT switched from unknown destinations), Costa Rica (122,300 MT), Guatemala (32,100 MT), and Honduras (28,800 MT), were offset by reductions for unknown destinations (108,700 MT). Exports of 900,100 MT were primarily to China (474,900 MT), Mexico (344,200 MT), Japan (39,300 MT), Canada (24,400 MT), and Taiwan (6,300 MT).
Barley: No net sales were reported for the week. Exports of 500 MT were to Japan.
Sorghum: Net sales of 3,500 MT for 2022/2023 primarily for China (71,400 MT, including 68,000 MT switched from unknown destinations), were offset by reductions for unknown destinations (68,000 MT). Exports of 72,000 MT were to China (71,400 MT) and Mexico (600 MT).
Rice: Net sales of 77,700 MT for 2022/2023 primarily for Jordan (27,400 MT), Panama (27,000 MT), Haiti (15,200 MT), Mexico (5,000 MT), and Canada (2,200 MT), were offset by reductions for Morocco (400 MT) and Colombia (100 MT). Exports of 8,900 MT were primarily to Mexico (2,900 MT), South Korea (2,600 MT), Canada (2,400 MT), Saudi Arabia (300 MT), and Germany (100 MT).
Export Adjustments: Accumulated exports of long grain, milled rice to Jordan were adjusted down 3,628 MT. Of the total 710 MT for week ending August 25th, 353 MT September 22nd, 990 MT October 13th, 877 MT October 27th, and 698 MT November 3rd. This class of rice was reported in error. The correct class is medium, short and other classes, milled rice and included in this week’s report.
Soybeans: Net sales of 1,716,200 MT for 2022/2023 primarily for China (839,600 MT, including 396,000 MT switched from unknown destinations and decreases of 108,200 MT), Mexico (143,300 MT, including 47,500 MT switched from unknown destinations and decreases of 300 MT), Germany (140,400 MT), Indonesia (120,800 MT, including 110,000 MT switched from unknown destinations and decreases of 100 MT), and unknown destinations (108,400 MT), were offset by reductions for Honduras (5,000 MT). Total net sales of 30,000 MT for 2023/2024 were for China. Exports of 2,247,600 MT were primarily to China (1,669,700 MT), Germany (140,400 MT), Indonesia (125,800 MT), Taiwan (96,400 MT), and Mexico (78,900 MT).
Optional Origin Sales: For 2022/2023, the current outstanding balance of 300 MT, all South Korea.
Export for Own Account: For 2022/2023, the current exports for own account outstanding balance is 6,300 MT, all Canada.
Export Adjustments: Accumulated exports of soybeans to the Netherlands were adjusted down 140,400 MT. Of the total 69,925 MT for week ending November 17th and 70,475 MT November 24th. The correct destination for these shipments is Germany.
Soybean Cake and Meal: Net sales of 226,200 MT for 2022/2023 primarily for Mexico (104,800 MT, including decreases of 400 MT), Japan (24,300 MT, including decreases of 700 MT), Honduras (16,300 MT), unknown destinations (14,500 MT), and Nicaragua (13,900 MT), were offset by reductions primarily for Ireland (7,500 MT) and Colombia (1,100 MT). Total net sales of 15,000 MT for 2023/2024 were for Mexico. Exports of 260,900 MT were primarily to Japan (100,600 MT), the Philippines (49,100 MT), Mexico (34,500 MT), the Dominican Republic (26,100 MT), and the Netherlands (21,000 MT).
Soybean Oil: Net sales of 500 MT for 2022/2023 were for Canada. Exports of 400 MT were to Canada.
Cotton: Net sales of 32,600 RB for 2022/2023 primarily for China (11,000 RB, including decreases of 100 RB), Bangladesh (7,300 RB, including decreases of 100 RB), Turkey (6,500 RB), Vietnam (4,300 RB, including 3,100 RB switched from Taiwan and 1,300 RB switched from South Korea), and Pakistan (3,400 RB, including decreases of 2,200 RB), were offset by reductions primarily for Thailand (1,700 RB) and South Korea (1,300 RB). Net sales of 26,400 RB for 2023/2024 were reported for Pakistan (22,000 RB) and Turkey (4,400 RB). Exports of 141,100 RB were primarily to China (59,900 RB), Pakistan (36,200 RB), Mexico (10,000 RB), El Salvador (7,000 RB), and Vietnam (5,600 RB). Net sales of Pima totaling 1,400 RB primarily for China (1,100 RB, including 900 RB switched from Germany), Thailand (900 RB), Guatemala (600 RB), South Korea (300 RB), and Japan (200 RB), were offset by reductions for Germany (900 RB) and India (800 RB). Total net sales of 200 RB for 2023/2024 were for Guatemala. Exports of 6,900 RB were primarily to India (2,600 RB), Indonesia (1,300 RB), Thailand (1,000 RB), Turkey (900 RB), and China (900 RB).
Optional Origin Sales: For 2022/2023, the current outstanding balance of 9,300 RB, all Malaysia.
Export for Own Account: For 2022/2023, new exports for own account totaling 13,700 RB were to China. Exports for own account totaling 4,400 RB to China were applied to new or outstanding sales. The current exports for own account outstanding balance of 115,000 RB are for China (71,100 RB), Vietnam (23,900 RB), Pakistan (18,100 RB), India (1,500 RB), and Indonesia (400 RB).
Hides and Skins: Net sales of 488,000 pieces for 2022 primarily for China (340,500 whole cattle hides, including decreases of 18,200 pieces), Mexico (57,700 whole cattle hides, including decreases of 2,100 pieces), South Korea (51,200 whole cattle hides, including decreases of 4,500 pieces), Turkey (38,000 whole cattle hides), and Taiwan (2,100 whole cattle hides), were offset by reductions for Brazil (400 pieces) and Canada (100 pieces). Total net sales reductions of 2,200 calf skins were for China. In addition, total net sales reductions of 1,500 kip skins were for Canada. Net sales of 48,400 pieces for 2023 were primarily for China (37,100 whole cattle hides) and South Korea (7,800 whole cattle hides). Exports of 591,300 whole cattle hides exports were primarily to China (394,000 pieces), Mexico (76,900 pieces), South Korea (56,000 pieces), Turkey (32,900 pieces), and Brazil (13,900 pieces).
Net sales of 10,800 wet blues for 2022 primarily for Mexico (7,900 unsplit and 6,400 grain splits), Japan (4,800 grain splits), South Korea (3,600 grain splits), China (1,800 unsplit), and Vietnam (200 unsplit), were offset by reductions primarily for Hong Kong (9,000 unsplit), Thailand (2,800 unsplit), and Italy (1,900 grain splits and 100 unsplit). Net sales of 213,400 wet blues for 2023 were reported for Italy (188,600 unsplit and 1,900 grain splits), Hong Kong (9,000 unsplit), China (7,500 unsplit), the Dominican Republic (3,200 unsplit), and Thailand (3,200 unsplit). Exports of 84,200 wet blues were primarily to Italy (14,800 unsplit and 3,600 grain splits), Thailand (18,000 unsplit), Hong Kong (13,000 unsplit), Vietnam (9,100 unsplit), and Mexico (3,500 unsplit and 3,200 grain splits). Net sales reductions of 160,100 splits resulting in increases for Canada (3,800 pounds), were more than offset by reductions for South Korea (163,900 pounds). Total net sales of 156,000 splits for 2023 were for South Korea. Exports of 118,200 splits were to South Korea.
Beef: Net sales of 1,600 MT for 2022 primarily for China (4,800 MT, including decreases of 300 MT), Japan (1,600 MT, including decreases of 1,100 MT), Mexico (900 MT, including decreases of 100 MT), Canada (500 MT, including decreases of 200 MT), and Taiwan (400 MT, including decreases of 200 MT), were offset by reductions primarily for South Korea (7,900 MT). Net sales of 16,300 MT for 2023 were primarily for South Korea (13,100 MT), Japan (1,300 MT), Hong Kong (700 MT), China (300 MT), and Guatemala (300 MT). Exports of 16,900 MT were primarily to South Korea (5,100 MT), Japan (4,300 MT), Mexico (1,900 MT), China (1,600 MT), and Taiwan (1,300 MT).
Pork: Net sales reductions of 7,900 MT for 2022 resulting in increases for Mexico (3,100 MT, including decreases of 4,000 MT), China (900 MT, including decreases of 300 MT), Honduras (200 MT), the Dominican Republic (200 MT, including decreases of 200 MT), and Chile (100 MT), were more than offset by reductions primarily for Japan (4,400 MT), Australia (3,400 MT), South Korea (2,300 MT), and Canada (2,200 MT). Net sales of 2,400 MT for 2023 were primarily for Colombia (1,300 MT), Japan (500 MT), South Korea (200 MT), and Nicaragua (200 MT). Exports of 32,500 MT were primarily to Mexico (15,900 MT), China (4,700 MT), Japan (3,300 MT), South Korea (2,100 MT), and Canada (1,900 MT).
Terry Reilly
Senior Commodity Analyst – Grain and Oilseeds
Futures International
One Lincoln Center
18 W 140 Butterfield Rd.
Oakbrook Terrace, Il. 60181
W: 312.604.1366
ICE IM: treilly1
Skype: fi.treilly

Trading of futures, options, swaps and other derivatives is risky and is not suitable for all persons. All of these investment products are leveraged, and you can lose more than your initial deposit. Each investment product is offered only to and from jurisdictions where solicitation and sale are lawful, and in accordance with applicable laws and regulations in such jurisdiction. The information provided here should not be relied upon as a substitute for independent research before making your investment decisions. Futures International, LLC is merely providing this information for your general information and the information does not take into account any particular individual’s investment objectives, financial situation, or needs. All investors should obtain advice based on their unique situation before making any investment decision. The contents of this communication and any attachments are for informational purposes only and under no circumstances should they be construed as an offer to buy or sell, or a solicitation to buy or sell any future, option, swap or other derivative. The sources for the information and any opinions in this communication are believed to be reliable, but Futures International, LLC does not warrant or guarantee the accuracy of such information or opinions. Futures International, LLC and its principals and employees may take positions different from any positions described in this communication. Past results are not necessarily indicative of future results.