From: Terry Reilly
Sent: Friday, January 03, 2020 2:28:54 PM (UTC-06:00) Central Time (US & Canada)
Subject: FI Evening Grain Comments 01/03/20
PDF attached includes FI’s US S&D’s, but the funds were not available at the time this was written
US
airstrike near Baghdad’s airport killing a top Tehran general is widely affecting global markets. Gold and most energies were up sharply.
CFTC
is delayed until Monday
US
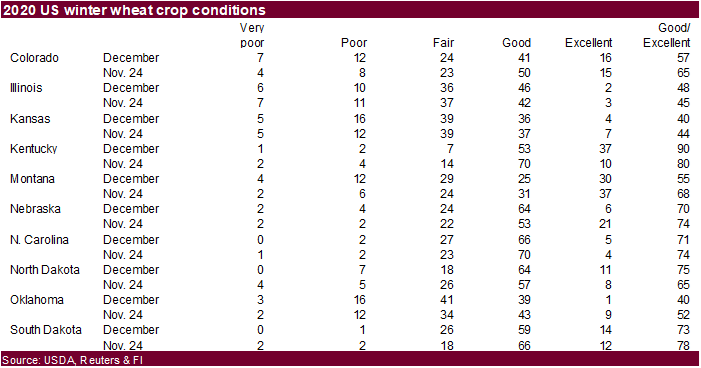
selected winter wheat crop ratings: (see expanded table in wheat section)
・
Kansas: 40% G/E vs. 44% at the end of November
・
Oklahoma: 40% G/E vs. 52% at the end of November
・
Nebraska: 70% G/E vs. 74% at the end of November
・
South Dakota: 73% G/E vs. 78% at the end of November
China
may see its largest snow event in years. This weekend into Tuesday, snowfall of 4 to 10 inches and local totals of 10-20 inches will fall across much of Shaanxi, Shanxi, Shandong, northern Henan, northwestern Hubei and northeastern Shandong.
MARKET
WEATHER MENTALITY FOR CORN AND SOYBEANS:
South
America weather will be mixed with some concern about drying in northern Argentina, Paraguay and southern Brazil, but the odds seem to favor some timely rain in these areas especially in the Jan. 9-16 period and as long as that evolves production potentials
will not be changed. Weather in southern Argentina and the remainder of Brazil should be favorable with temporary improvements in northeastern Brazil.
In
the meantime, recent rain in southern Sumatra and western and central Java and has been improving soil moisture for better oil palm production potentials in 2020. The rain must be sustainable over multiple weeks and it looks like that may be the case.
South
Africa crop weather will remain varied offering some timely rainfall to many areas, but frequent follow up rain will be needed to seriously change crop moisture and development potential. Some areas may not get enough rain to counter evaporation in the next
two weeks while many others will.
India
will get some additional showers over the next couple of week benefiting some winter crops. Timely precipitation has occurred in many other areas and more is expected next week to support good yields.
Winter
crops in China and Europe are semi-dormant and mostly in good shape. Rain and snow in China this weekend into early next week will help to improve soil moisture for better winter rapeseed establishment prior to reproduction in the spring. That same storm in
China will produce some significant impacts on travel and livestock this weekend with substantial rain and snow in east-central parts of the nation.
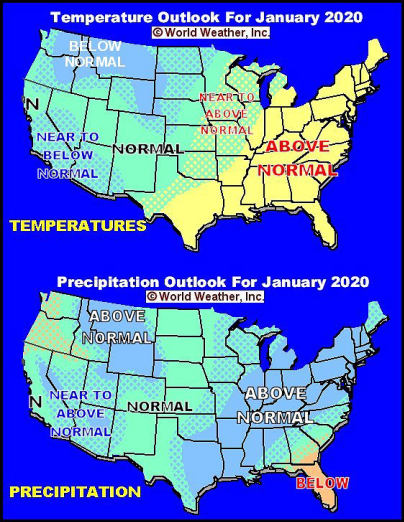
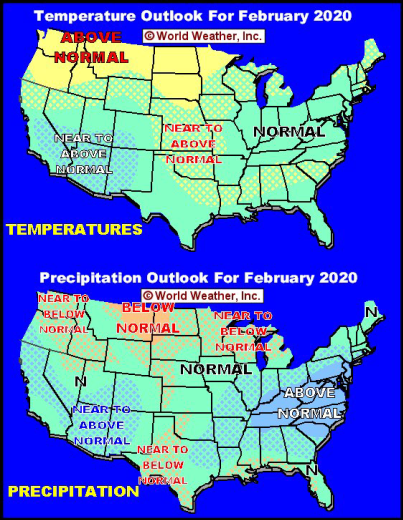
Late season farming activity in the United States will not advance very well for a while, but that is no change from recent weeks.
Overall, weather today will provide a mixed influence on market mentality.
MARKET
WEATHER MENTALITY FOR WHEAT: Precipitation
in the U.S. hard red winter wheat production region last weekend bolstered topsoil moisture for improved wheat establishment in the spring. Additional moisture will be needed periodically through the winter to ensure the best crop development potential.
More
rain in the U.S. Midwest and southeastern Canada over the next couple of weeks will maintain wet and in some cases snow covered conditions which should be good for crops in the spring.
Winter
crop conditions in China will improve if precipitation falls as expected this weekend and early next week. The moisture will fall in areas that were a little dry in the autumn. Improvements in wheat establishment prior to reproduction cannot occur until warmer
weather comes along in the spring, but the moisture should still be available to crops unless a warm and dry finish to winter and start to spring takes place. The same weekend storm in China will threaten livestock, induce power outages and cause travel delays
as significant rain and snow fall.
India
wheat production areas will receive some welcome precipitation over the next week to ten days further ensuring high yields this winter.
Crops
in Europe and the western CIS are dormant and mostly in fair to good shape. Some significant snowfall is likely in northwestern Russia and some neighboring areas. Dryness in the autumn left many crops in southeastern Europe, including Ukraine, and Kazakhstan
with poor emergence and establishment. Timely precipitation and seasonable temperatures will be needed in the spring. Until then, snow is needed to protect poorly established crops from any harsh or extreme weather that suddenly evolves. There is no threat
of damaging cold for the next two weeks and snow will be widespread in northern Russia and a few neighboring areas.
North Africa wheat is in fair to good shape. Crops in southwestern Morocco are not well established and need timely rain in the next few weeks to induce better establishment prior to reproduction.
Argentina
harvesting was disrupted by rain recently and additional precipitation is expected late this weekend, but good field working conditions should occur into Saturday to get some of the remaining wheat and barley crop harvested.
Overall,
weather today will likely provide a bearish bias to market weather mentality.
Source:
World Weather Inc. and FI
Source:
World Weather Inc. and FI
Source:
World Weather Inc. and FI
- USDA
weekly crop net-export sales for corn, soybeans, wheat, 8:30am - EIA
U.S. weekly ethanol inventories, production, 11am - ICE
Futures Europe weekly commitments of traders report on coffee, cocoa, sugar positions ~1:30pm (~6:30pm London)
MONDAY,
JAN. 6:
- USDA
weekly corn, soybean, wheat export inspections, 11am - EU
weekly grain, oilseed import and export data - CFTC
COT C after the close - Ivory
Coast cocoa arrivals
TUESDAY,
JAN. 7:
- New
Zealand global dairy trade auction
WEDNESDAY,
JAN. 8:
- Conab
releases 4th estimate for Brazil’s soy, corn crops
THURSDAY,
JAN. 9:
- USDA
weekly crop net-export sales for corn, soybeans, wheat, 8:30am - Port
of Rouen data on French grain exports - United
Nation’s FAO Food Price Index - Australia’s
Bureau of Meteorology releases climate statement - New
Zealand commodity price
FRIDAY,
JAN. 10:
- USDA’s
monthly World Agricultural Supply and Demand (WASDE) report, noon - Malaysia
end-2019 palm oil stocks, production, export numbers; Jan. 1-10 palm oil export data from AmSpec, Intertek and SGS - U.S.
winter wheat seeding forecast - USDA
quarterly wheat, barley, corn, soybean stocks, noon - ICE
Futures Europe weekly commitments of traders report on coffee, cocoa, sugar positions ~1:30pm (~6:30pm London) - CFTC
commitments of traders weekly report on positions for various U.S. futures and options, 3:30pm
Source:
Bloomberg and FI
2019
USDA Loan
・
USDA Loan Activity: 2019 Crop Sorghum Outstanding 0.988M Cwt
・
USDA Loan Activity: 2019 Crop Corn Outstanding 511.441M Bu
・
USDA Loan Activity: 2019 Crop Soybeans Outstanding 112.977M Bu
・
USDA Loan Activity: 2019 Crop Wheat Outstanding 51.569M Bu
・
USDA Loan Activity: 2019-2020 Cotton Under Loan Up 831,705
– DJ
Weekly
Bloomberg bull/bear (taken Thursday)
・
Soybeans: Bullish: 9 Bearish: 4 Neutral: 5
・
Corn: Bullish: 8 Bearish: 4 Neutral: 6
・
Wheat: Bullish: 5 Bearish: 4 Neutral: 9
・
Raw sugar: Bullish: 2 Bearish: 3 Neutral: 3
・
White sugar: Bullish: 2 Bearish: 3 Neutral: 3
・
White-sugar premium: Bullish: 2 Bearish: 1 Neutral: 5
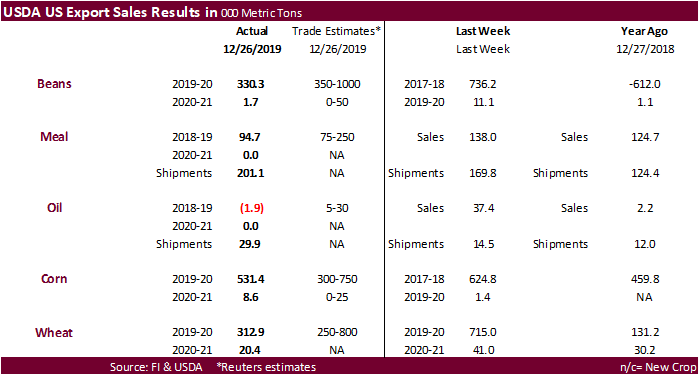
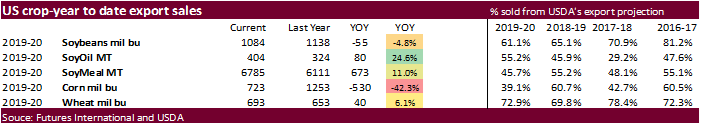
USDA
export sales
were poor all around (holiday week). Soybean oil and all-wheat crop-year to date commitments lost some of its edge to the year ago pace. Soybean oil sales were negative 1,900 tons. Soybean sales were below expectations and a marketing year low. Soybean meal
sales of less than 100,000 tons were at the low end of expectations. Corn sales of 531,400 tons were within expectations, lowest since October 31 and well below its previous 4-week weekly average of 938,400 tons. Corn commitments to Japan and especially
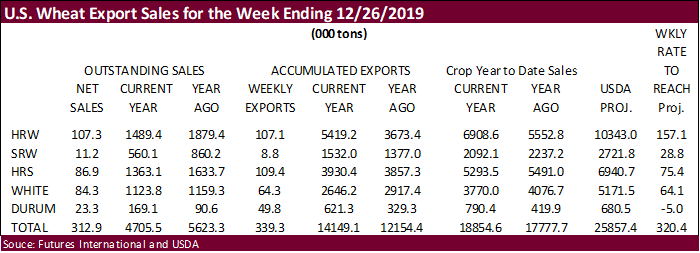
South Korea, are running below their respected 3-year averages. All-wheat sales of 312,900 tons were down from 715,000 tons previous week. Pork sales were a marketing year low.
Corn.
・
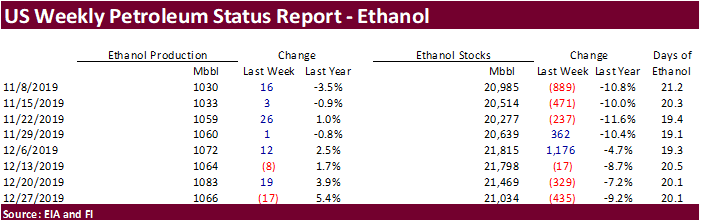
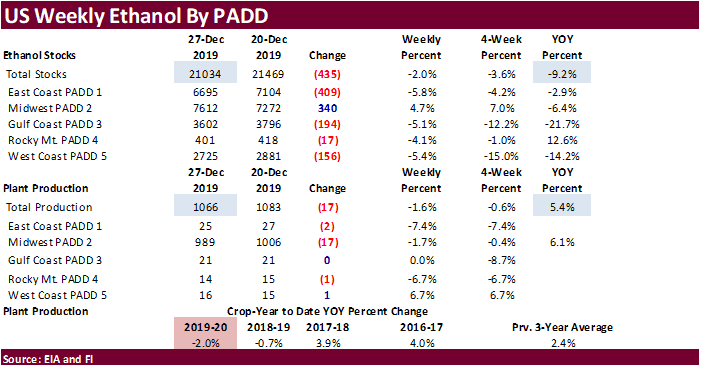
Corn traded 1.75-5.00 cents lower (bear spreading) on weakness in wheat, livestock disease concerns, and slow US export developments. EIA reported a decline in US ethanol production, but stocks were down for
the third consecutive week. Yesterday USDA reported the November corn for ethanol use a little higher than expected, but the discrepancy was not large enough for us to think USDA will change its outlook for corn for ethanol use on January 10.
・
Predicting December 1 US stocks this year for corn and soybeans was much more difficult than recent years, given the uncertainty what USDA will do with 2019 US supply (planted, harvested, yield, production).
Our December 1 US stocks estimate may end up near the lower end of trade expectations, based on a bullish Q1 corn for feed estimate amid higher animal unit numbers and lower harvested area. Our working December 1 corn ending stocks is 11.489 billion bushels,
well below 11.665 billion University of Ill projected. FI’s full list of estimates for USDA’s January reports will be in selected polls released on Monday.
・
Geopolitical tensions were in focus today as traders assess the impact over the US air strike near Baghdad’s airport killing a top Iranian general and other government official.
・
Gold was up about $22 as of 1:33 pm CT and Dow futures down 213 points.
・
USD was 31 points higher as of 1:33 pm CT.
・
Bulgaria will cull 24,000 pigs after ASF was discovered at a pig farm in the northeast of the country, its first industrial farm case since August.
・
Baltic Dry index fell 7 percent on Friday. Yesterday it was down nearly 10.5 percent.
o
Last trade: 907 on 1/3/20, 8-month low
o
Dn 69 from previous trading day
o
Dn 183 from a week ago, or 17%
o
Dn 43% month over month
o
Dn 29% from December 31, 2018
o
Record high was 11,793 on 5/20/2008
o
CRB Index is up 4.5% from this time last month and up 10.4% from the end of 2018.
・
China plans to sell 30k frozen pork from reserves today.
-
India’s
MMTC delayed their import tender for 50,000 tons of non-GMO corn from Jan 2 to January 7,
for shipment by February 10. Another source put shipment by Jan 22.
・
Soybeans and meal started the day lower on geopolitical problems and lack of confirmation China bought US soybeans over the past week. Soybean oil started the day near unchanged. Less than an hour into the
session prices tanked, presumably on reports Phase One of the US/China trade deal could be delayed after the US launched a strike against an Iranian convoy in Iraq, killing a top general. While in a lower trade, stops sent soybeans down about 19 cents in
early day session trading. Nearly 6k SH traded @ 9:22 am CT, sending March from $9.43 to $9.3750. At the same time 2000 meal and 2000 corn traded. Profit taking, bird flu discovery in Poland reported yesterday, ASF reported in Bulgaria, and slow US export
developments weighted on not only soybean, but soybean meal prices. Soybean oil followed soybeans lower.
・
March soybeans were down 14.75 cents at $9.4150, March meal off $4.40 at $301.20/short ton, and March soybean oil down 16 points at 35.08 cents. The soybean crush rallied again with March up 3.25 at $1.07.
・
USDA soybean export sales were a marketing year low and we look for another week of slow sales to be reported next week. Buyers were nonexistent this week for Gulf and PNW soybeans.
・
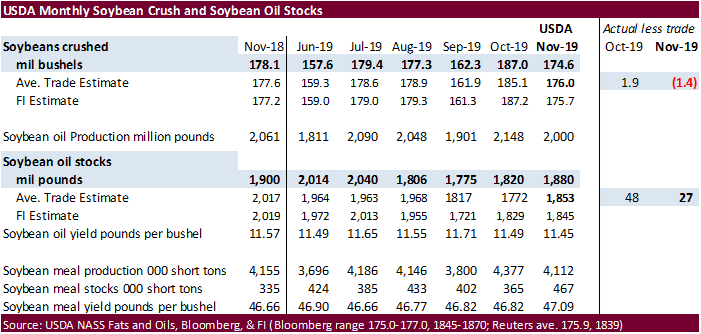
We were a little surprised soybean oil was able to hold earlier in the session after USDA NASS reported a lower than expected November crush and higher than trade average soybean oil stocks. Yesterday we
cautioned soybean oil longs after seeing end of November soybean oil stocks appeared to be rising and catching up to last year’s level. Our theory of the ongoing soybean oil/soybean meal spreading relates to ASF and bird flu worries, along with expectations
US soybean oil use will increase for biodiesel feedstock throughout 2020. Note the
USDA NASS US soybean crush for November was 174.6 million bushels, 1.4 million below a Bloomberg trade average and end of November US soybean oil stocks were 1.880 billion pounds, 27 million above an average estimate, and slightly below
1.900 billion at the end of November 2018.
・
Southern Argentina has a chance for rain over the weekend. Brazil saw good rain on Thursday and more rain is expected next week. Note yesterday USDA’s Attaché estimated the Brazil soybean crop at a record
123.5 million tons.
・
Offshore values this morning were leading CBOT soybean oil 47 points lower and meal $1.60 lower.
・
China cash crush was last 145 cents per bushel (139 prev.), compared to 131 on Friday and 11 cents year ago.
-
USDA
CCC seeks 14,650 tons of packaged vegetable oils for export to Yemen on January 7 with shipment February 1-29 (Feb. 16-Mar. 15 for plants at ports).
・
US wheat futures fell on profit taking and uncertainty over US grain demand for the Middle East after the US airstrike in Iraq. Fears US wheat and corn shipments into the Middle East may be compromised by
a military conflict weighed on prices. In addition, there were rumors China could back off from the Phase One trade deal that could put millions of tons of US grain sales at risk. KC and Mn wheat were hardest hit today with nearby contracts 10.25-11.25 cents
lower. Chicago finished 3.50-5.75 lower.
・
US selected state winter wheat condition ratings fell from late November for a few key states.
・
March Paris wheat futures closed 1 euro lower at 188.50.
・
Northeast Ukraine and Russia’s central region and Volga Valley will see snow over the next few days.
- Results
are awaited on Ethiopia in for 80,000 tons of durum wheat and another 75,000 tons of soft wheat after awarding 600,000 tons of wheat earlier this week.
- Jordan
seeks 120,000 tons of wheat on January 7. - Morocco
seeks to import about 354,000 tons of US durum wheat on January 9 for arrival by May 31.
- Mauritius
seeks 95,000 tons of optional origin wheat flour on Jan. 10, 2020, for shipment between July 1, 2020, and June 20, 2021.
- Turkey
seeks 550,000 tons of red milling wheat on January 14, minimum protein content of 13.5% for January 21-February 15 shipment.
- Turkey
seeks 100,000 tons of durum wheat on January 14 for Jan 25-Feb 25 shipment.
・
Syria seeks 200,000 tons of soft wheat from Russia on January 20, 2020.
Rice/Other
- China
sold 19,644 tons of 2014-2015 rice out of auction at 1,922 yuan per ton.
- China
sold 878 tons of 2016-2018 rice out of auction at 2,300 yuan per ton. - Syria
seeks 45,000 tons of white rice on Jan. 6, 2020. (Reuters) Short grain white rice of third or fourth class was sought. No specific country of origin was specified in the tender, traders said. Some 25,000 tons was sought for supply 90 days after confirmation
of the order and 20,000 tons 180 days after supply of the first consignment. The rice was sought packed in bags and offers should be submitted in euros. A previous tender from the agency for 45,000 tons of rice with similar conditions had closed on
Nov.
13. - South
Korea seeks another 30,764 tons of rice on Jan 7 for Sep-Oct arrival.
Details
of the new tender are as follows:
TONNES(M/T) GRAIN TYPE ARRIVAL/PORT
20,000 Brown Medium Sept.1-Oct.31,2020/Busan
10,764 Brown Medium Sept.1-Oct.31,2020/Gwangyang
U.S. EXPORT SALES FOR WEEK ENDING 12/26/2019
|
|
CURRENT MARKETING YEAR |
NEXT MARKETING YEAR |
||||||
|
COMMODITY |
NET SALES |
OUTSTANDING SALES |
WEEKLY EXPORTS |
ACCUMULATED EXPORTS |
NET SALES |
OUTSTANDING SALES |
||
|
CURRENT YEAR |
YEAR |
CURRENT YEAR |
YEAR |
|||||
|
|
THOUSAND METRIC TONS |
|||||||
|
WHEAT |
|
|
|
|
|
|
|
|
|
HRW |
107.3 |
1,489.4 |
1,879.4 |
107.1 |
5,419.2 |
3,673.4 |
0.0 |
0.0 |
|
SRW |
11.2 |
560.1 |
860.2 |
8.8 |
1,532.0 |
1,377.0 |
0.4 |
4.5 |
|
HRS |
86.9 |
1,363.1 |
1,633.7 |
109.4 |
3,930.4 |
3,857.3 |
0.0 |
4.8 |
|
WHITE |
84.3 |
1,123.8 |
1,159.3 |
64.3 |
2,646.2 |
2,917.4 |
0.0 |
0.0 |
|
DURUM |
23.3 |
169.1 |
90.6 |
49.8 |
621.3 |
329.3 |
20.0 |
61.0 |
|
TOTAL |
312.9 |
4,705.5 |
5,623.3 |
339.3 |
14,149.1 |
12,154.4 |
20.4 |
70.3 |
|
BARLEY |
0.0 |
30.2 |
31.5 |
1.3 |
28.7 |
26.8 |
0.0 |
0.0 |
|
CORN |
531.4 |
9,979.6 |
13,226.0 |
447.5 |
8,375.0 |
18,601.6 |
8.6 |
815.6 |
|
SORGHUM |
0.4 |
569.9 |
136.9 |
23.9 |
517.4 |
327.8 |
0.0 |
0.0 |
|
SOYBEANS |
330.3 |
8,570.8 |
14,037.2 |
1,076.4 |
20,920.8 |
16,943.9 |
1.7 |
180.1 |
|
SOY MEAL |
94.7 |
2,915.6 |
3,935.8 |
201.1 |
2,623.0 |
2,849.1 |
1.5 |
87.3 |
|
SOY OIL |
-1.9 |
154.9 |
220.5 |
29.9 |
270.8 |
183.2 |
0.0 |
0.5 |
|
RICE |
|
|
|
|
|
|
|
|
|
L G RGH |
33.9 |
361.7 |
222.9 |
0.6 |
619.0 |
564.4 |
0.0 |
0.0 |
|
M S RGH |
0.0 |
15.4 |
4.5 |
0.0 |
15.4 |
23.1 |
0.0 |
0.0 |
|
L G BRN |
0.1 |
22.0 |
5.2 |
0.5 |
18.3 |
24.6 |
0.0 |
0.0 |
|
M&S BR |
0.1 |
48.0 |
28.8 |
4.3 |
11.1 |
43.3 |
0.0 |
0.0 |
|
L G MLD |
1.0 |
179.7 |
145.2 |
14.6 |
458.8 |
367.2 |
0.0 |
0.0 |
|
M S MLD |
11.0 |
152.9 |
207.2 |
8.6 |
247.6 |
188.5 |
0.0 |
0.0 |
|
TOTAL |
45.9 |
779.7 |
613.9 |
28.7 |
1,370.2 |
1,211.1 |
0.0 |
0.0 |
|
COTTON |
|
THOUSAND RUNNING BALES |
||||||
|
UPLAND |
246.2 |
7,549.0 |
7,187.2 |
224.5 |
3,925.5 |
3,391.8 |
19.4 |
997.5 |
|
PIMA |
15.3 |
181.5 |
304.8 |
6.3 |
167.1 |
156.4 |
0.9 |
35.3 |
Export Sales Highlights
This summary is based on reports from exporters for the period December 20-26, 2019.
Wheat: Net sales of 312,900 metric tons for 2019/2020 were down 56 percent from the previous week and 46 percent from the prior 4-week average. Increases primarily
for Indonesia (71,100 MT, including decreases of 200 MT), Mexico (61,200 MT, including decreases of 100 MT), Yemen (50,000 MT), Italy (48,300 MT, including 25,000 MT switched from unknown destinations), and Malaysia (29,500 MT, switched from unknown destinations),
were offset by reductions for El Salvador (6,600 MT) and unknown destinations (6,500 MT). For 2020/2021, net sales of 20,400 MT were reported for Italy (20,000 MT) and Nicaragua (400 MT). Exports of 339,300 MT were down 33 percent from the previous week
and 18 percent from the prior 4-week average. The destinations were primarily to Japan (80,900 MT), Indonesia (74,100 MT), South Korea (55,000 MT), Italy (49,800 MT), and Taiwan (42,700 MT). Optional Origin Sales: For 2019/2020, the current outstanding
balance of 56,000 MT is for the Philippines.
Corn: Net sales of 531,400 metric tons for 2019/2020 were down 15 percent from the previous week and 43 percent from the prior 4-week average. Increases primarily
for Mexico (237,700 MT, including decreases of 600 MT), Japan (172,100 MT, including 63,800 MT switched from unknown destinations and decreases of 300 MT), Colombia (66,600 MT, including 44,800 MT switched from unknown destinations and decreases of 1,500 MT),
the Dominican Republic (22,700 MT, including decreases of 1,300 MT), and Jamaica (16,900 MT), were offset by reductions for Guatemala (1,500 MT). For 2020/2021, total net sales of 8,600 MT were for Japan. Exports of 447,500 MT were up 35 percent from the
previous week, but down 14 percent from the prior 4-week average. The destinations were primarily to Mexico (166,600 MT), Japan (134,700 MT), Colombia (69,200 MT), Guatemala (25,600 MT), and the Dominican Republic (13,700 MT). Optional Origin Sales:
For 2019/2020, decreases totaling 10,000 MT were reported for Israel. The current outstanding balance of 496,900 MT is for South Korea (388,000 MT), Israel (50,000 MT), and Egypt (58,900 MT).
Barley: No net sales for 2019/2020 were reported for the week. Exports of 1,300 MT were up 74 percent from the previous week and 56 percent from the prior 4-week average.
The destination was Japan.
Sorghum: Net sales of 400 MT for 2019/2020 were reported for Mexico. Exports of 23,900 MT were up 84 percent from the previous week and 76 percent from the prior 4-week
average. The destination was Mexico.
Rice: Net sales of 45,900 MT for 2019/2020 were down 26 percent from the previous week and 4 percent from the prior 4-week average. Increases were primarily for Nicaragua
(15,00 MT), Venezuela (10,000 MT), Panama (6,300 MT), Mexico (4,900 MT, including decreases of 300 MT), and Guatemala (4,400 MT). Exports of 28,700 MT were down 73 percent from the previous week and 63 percent from the prior 4-week average. The destinations
were primarily to Guatemala (12,000 MT), Japan (5,800 MT), South Korea (4,100 MT), Saudi Arabia (1,700 MT), and Jordan (1,700 MT). Exports for Own Account: For 2019/2020, the current exports for own account outstanding balance is 200 MT, all Canada.
Soybeans: Net sales of 330,300 MT for 2019/2020–a marketing-year low–were down 55 percent from the previous week and 66 percent from the prior 4-week average. Increases
were primarily for China (160,200 MT, including 132,000 MT switched from unknown destinations), Bangladesh (112,300 MT, including 60,000 MT switched from unknown destinations and decreases of 7,200 MT), Vietnam (84,600 MT, including 70,00 MT switched from
unknown destinations), Spain (66,600 MT), and Japan (35,600 MT, including 26,800 MT switched from unknown destinations and decreases of 1,900 MT), were offset by reductions primarily for unknown destinations (202,900 MT). For 2020/2021, total net sales of
1,700 MT were for Japan. Exports of 1,076,400 MT were up 7 percent from the previous week, but down 20 percent from the prior 4-week average. The destinations were primarily to China (418,900 MT), Bangladesh (112,300 MT), Mexico (109,300 MT), Vietnam (77,400
MT), and Pakistan (68,300 MT). Exports for Own Account: For 2019/2020, the current exports for own account outstanding balance is 2,100 MT, all Canada.
Soybean Cake and Meal: Net sales of 94,700 MT for 2019/2020 were down 31 percent from the previous week and 41 percent from the prior 4-week average. Increases primarily
for Mexico (33,900 MT), Venezuela (15,000 MT), Morocco (15,000 MT), Colombia (6,600 MT), and Nepal (6,600 MT), were offset by reductions primarily for Ecuador (5,500 MT) and Oman (400 MT). For 2020/2021, total net sales of 1,500 MT were for Mexico. Exports
of 201,100 MT were primarily to the Philippines (45,200 MT), Peru (30,100 MT), Colombia (29,700 MT), Mexico (25,100 MT), and the Dominican Republic (15,700 MT).
Soybean Oil: Net sales reductions of 1,900 MT for 2019/2020 resulting in increases primarily for Mexico (2,500 MT), the Dominican Republic (1,500 MT), Morocco (1,000
MT), and Canada (100 MT), were more than offset by decreases for unknown destinations (7,000 MT). Exports of 29,900 MT were to Colombia (20,200 MT), Mexico (5,400 MT), Jamaica (3,500 MT), and Trinidad (800 MT).
Cotton: Net sales of 246,200 RB for 2019/2020 were up 82 percent from the previous week and 19 percent from the prior 4-week average. Increases primarily for Vietnam
(114,300 RB, including 1,500 RB switched from South Korea, 1,300 RB switched from Hong Kong, and 800 RB switched from Japan), Turkey (36,100 RB), Pakistan (32,800 RB), Malaysia (16,200 RB), and Bangladesh (13,600 RB, including decreases of 8,800 RB), were
offset by reductions for Japan (2,100 RB) and Hong Kong (1,300 RB). For 2020/2021, net sales of 19,400 RB were primarily for Vietnam (13,200 RB) and Bangladesh (6,000 RB). Exports of 224,500 RB were up 11 percent from the previous week and 17 percent from
the prior 4-week average. Exports were primarily to Pakistan (42,100 RB), Vietnam (41,100 RB), China (36,000 RB), Bangladesh (22,700 RB), and Indonesia (20,800 RB). Net sales of Pima totaling 15,300 RB were down 21 percent from the previous week, but up
39 percent from the prior 4-week average. Increases were primarily for India (5,400 RB, including decreases of 300 RB), Bahrain (2,600 RB), Turkey (2,200 RB), Bangladesh (2,000 RB), and Pakistan (1,300 RB), were offset by reductions for Japan (200 RB). For
2020/2021, total net sales of 900 RB were for Bahrain. Exports of 6,300 RB were down 26 percent from the previous week and 29 percent from the prior 4-week average. The primary destinations were India (1,500 RB), China (1,400 RB), Pakistan (1,400 RB), Indonesia
(1,000 RB), and Turkey (500 RB). Exports for Own account: For 2019/2020, new exports for own account totaling 200 RB were to Indonesia. Exports for own account totaling 2,800 RB to China (1,300 RB), Egypt (1,300 RB), and Indonesia (200 RB) were applied
to new or outstanding sales. Decreases were reported for India (200 RB). The current exports for own account outstanding balance of 15,500 RB is for India (8,700 RB), Bangladesh (4,300 RB), and China (2,500 RB).
Hides and Skins: Net sales of 272,300 pieces reported for 2019 were down 5 percent from the previous week and 27 percent from the prior 4-week average. Whole cattle
hide sales totaling 271,000 pieces primarily for China (213,400 pieces, including decreases of 24,700 pieces), South Korea (37,200 pieces, including decreases of 4,900 pieces), Thailand (12,100 pieces, including decreases of 600 pieces), Mexico (5,700 pieces),
and Japan (2,000 pieces, including decreases of 100 pieces), were offset by reductions for Brazil (400 pieces). For 2020, net sales of 91,700 pieces primarily for China (57,100 pieces), Indonesia (27,200 pieces), and Taiwan (6,200 pieces), were offset by
reductions for Thailand (700 pieces). Exports of 349,300 pieces reported for 2019 were up 13 percent from the previous week, but down 21 percent from the prior 4-week average. Whole cattle hide exports of 346,600 pieces were primarily to China (223,800
pieces), South Korea (81,100 pieces), Thailand (15,900 pieces), Mexico (10,900 pieces), and Brazil (6,800 pieces).
Net sales of 208,000 wet blues for 2019 were up noticeably from the previous week and from the prior 4-week average. Increases were primarily for Vietnam (93,400 unsplit),
China (68,600 unsplit and 12,300 grain splits), Thailand (10,500 unsplit and 3,000 grain splits), and Italy (7,500 unsplit and 1,900 grain splits). For 2020, net sales of 77,100 wet blues were primarily for Thailand (20,000 unsplit, including decreases of
3,200 grain splits), Italy (19,900 grain splits, including decreases of 1,400 unsplit), Brazil (19,800 grain splits, including decreases of 1,100 unsplit), and Taiwan (19,600 unsplit). Exports of 137,100 wet blues for 2019 were down up 24 percent from the
previous week and 22 percent from the prior 4-week average. The primary destinations were China (48,800 unsplit and 15,200 grain splits), Vietnam (45,900 unsplit), Thailand (13,900 unsplit), and Italy (6,400 unsplit and 1,900 grain splits). Total net sales
of splits, 121,500 pounds for 2019, were for Vietnam. For 2020, total net sales reductions of 12,800 pounds were for Vietnam. Exports of 401,900 pounds were to Vietnam.
Beef: Net sales of 3,700 MT reported for 2019 were down 42 percent from the previous week and 45 percent from the prior 4-week average. Increases primarily for Japan
(1,600 MT, including decreases of 200 MT), Mexico (500 MT, including decreases of 100 MT), Canada (300 MT), Taiwan (200 MT, including decreases of 100 MT), and Hong Kong (200 MT, including decreases of 100 MT), were offset by reductions primarily for South
Korea (200 MT). For 2020, net sales of 5,700 MT were primarily for Taiwan (2,100 MT), Japan (1,800 MT), South Korea (600 MT), Mexico (400 MT), and Hong Kong (300 MT). Exports of 12,600 MT were down 21 percent from the previous week and 23 percent from the
prior 4-week average. The destinations were primarily to Japan (3,900 MT), South Korea (3,200 MT), Mexico (1,500 MT), Taiwan (1,100 MT), and Hong Kong (1,000 MT).
Pork: Net sales of 3,300 MT reported for 2019–a marketing-year low–were down 80 percent from the previous week and 87 percent from the prior 4-week average. Increases
primarily for Mexico (9,600 MT), Japan (1,800 MT), South Korea (1,500 MT), Nicaragua (1,000 MT), and Chile (700 MT), were more than offset by reductions primarily for China (13,300 MT) and Colombia (200 MT). For 2020, net sales of 24,100 MT were primarily
for Mexico (10,400 MT), China (9,700 MT), Australia (2,700 MT), Japan (2,400 MT), and Canada (600 MT), were offset by reductions primarily for South Korea (2,100 MT) and Chile (100 MT). Exports of 30,600 MT were down 24 percent from the previous week and
19 percent from the prior 4-week average. The primary destinations were to China (10,400 MT), Mexico (9,200 MT), Japan (3,500 MT), South Korea (2,800 MT), and Canada (1,300 MT).
Terry Reilly
Senior Commodity Analyst C Grain and Oilseeds
Futures International │190 S LaSalle St., Suite 410│Chicago, IL 60603
W: 312.604.1366
AIM: fi_treilly
ICE IM:
treilly1
Skype: fi.treilly

Trading of futures, options, swaps and other derivatives is risky and is not suitable for all persons. All of these investment products are leveraged, and you can lose more than your initial deposit. Each investment product is offered
only to and from jurisdictions where solicitation and sale are lawful, and in accordance with applicable laws and regulations in such jurisdiction. The information provided here should not be relied upon as a substitute for independent research before making
your investment decisions. Futures International, LLC is merely providing this information for your general information and the information does not take into account any particular individual’s investment objectives, financial situation, or needs. All investors
should obtain advice based on their unique situation before making any investment decision. The contents of this communication and any attachments are for informational purposes only and under no circumstances should they be construed as an offer to buy or
sell, or a solicitation to buy or sell any future, option, swap or other derivative. The sources for the information and any opinions in this communication are believed to be reliable, but Futures International, LLC does not warrant or guarantee the accuracy
of such information or opinions. Futures International, LLC and its principals and employees may take positions different from any positions described in this communication. Past results are not necessarily indicative of future results.
This email, any information contained herein and any files transmitted with it (collectively, the Material) are the sole property of OTC Global Holdings LP and its affiliates (OTCGH); are confidential, may be legally privileged and are intended solely for
the use of the individual or entity to whom they are addressed. Unauthorized disclosure, copying or distribution of the Material, is strictly prohibited and the recipient shall not redistribute the Material in any form to a third party. Please notify the sender
immediately by email if you have received this email by mistake, delete this email from your system and destroy any hard copies. OTCGH waives no privilege or confidentiality due to any mistaken transmission of this email.